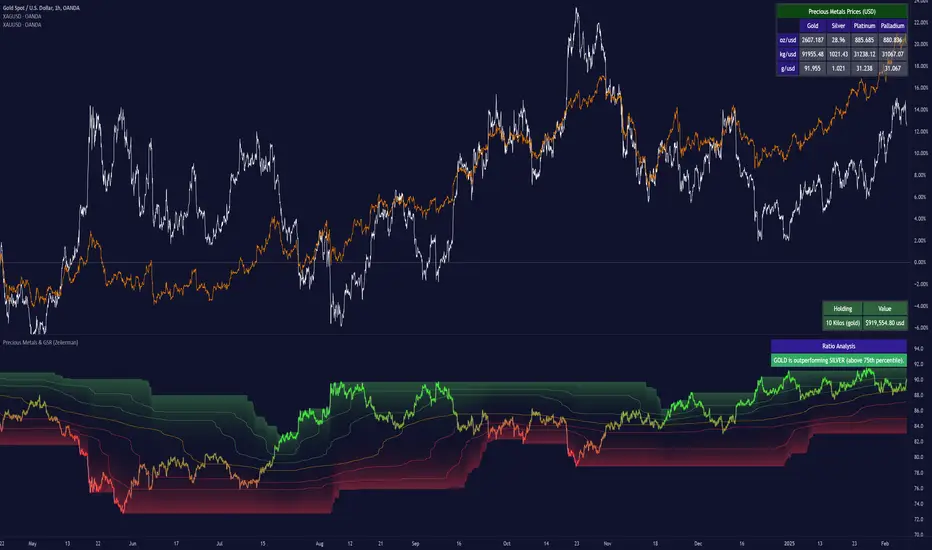
Precious Metals & GSR (Zeiierman)█ Overview
The Precious Metals & GSR (Zeiierman) is designed to provide traders and investors with a comprehensive view of the Gold-Silver Ratio (GSR) and other precious metal relationships. This tool helps evaluate the relative strength between different metals by analyzing their price ratios over historical periods, using quantile-based analysis and trend interpretation tables to highlight key insights.
The Gold-Silver Ratio (GSR) is a widely utilized metric in precious metals trading, representing the number of silver ounces required to purchase one ounce of gold. Historically, this ratio has fluctuated, providing traders with insights into the relative value of these two metals. By analyzing the GSR, traders can identify potential trading opportunities based on historical patterns and market dynamics.
By integrating customizable percentile bands, gradient coloring for performance visualization, and dynamic ratio analysis, this indicator assists in understanding how one metal is performing relative to another, making it useful for trend tracking, risk management, and portfolio allocation.
█ How It Works
The Precious Metals & GSR Indicator operates by fetching the latest prices of the selected precious metals in the user's chosen currency. It then calculates the ratio between two selected metals (Metal 1 and Metal 2) and analyzes this ratio over a specified period. By computing quantile bands and high/low bands, the indicator provides insights into the historical performance and current standing of the ratio.
⚪ Ratio Calculation
The core of this indicator is the metal ratio, calculated by dividing the price of Metal 1 by Metal 2.
A rising ratio means Metal 1 is outperforming Metal 2.
A falling ratio means Metal 2 is outperforming Metal 1.
The indicator automatically retrieves live market prices of Gold, Silver, Platinum, and Palladium to compute the ratio.
⚪ Quantile Ratio Bands
The indicator calculates the highest (max) and lowest (min) ratio levels over a user-defined period.
It also plots quantile bands at the 10th, 25th, 50th (median), 75th, and 90th percentiles, providing deeper statistical insights into how extreme or average the current ratio is.
The median (Q50) acts as a reference level, showing whether the ratio is above or below its historical midpoint.
⚪ Interpretation Table
The Ratio Interpretation Table provides a text-based summary of the ratio’s strength.
It detects whether Metal 1 is at a historical high, low, or within common ranges.
This helps traders and investors make informed decisions on whether the ratio is overextended, mean-reverting, or trending.
⚪ Precious Metals Table
Displays live market prices for Gold, Silver, Platinum, and Palladium.
Prices are shown in different units (oz, kg, grams, and troy ounces) based on user preferences.
A color-coded system highlights price changes, making it easier to track market movements.
⚪ Physical Holding Calculator
Users can enter their precious metal holdings to estimate their current value.
The system adjusts calculations based on weight, purity (24K, 22K, etc.), and unit of measurement.
The holding value is displayed in the selected currency (USD, EUR, GBP, etc.).
█ How to Use
⚪ Trend Identification
If the ratio is increasing, Metal 1 is gaining strength relative to Metal 2 → Possible Long Position on Metal 1 / Short on Metal 2
If the ratio is decreasing, Metal 2 is gaining strength relative to Metal 1 → Possible Short Position on Metal 1 / Long on Metal 2
⚪ Mean Reversion Strategy
When the ratio reaches the 90th percentile, Metal 1 is historically overextended (expensive) compared to Metal 2.
Traders may look to sell Metal 1 and buy Metal 2, expecting the ratio to decline back toward its historical average.
Example (Gold/Silver Ratio): If the GSR is above the 90th percentile, gold is very expensive relative to silver, suggesting a potential buying opportunity in silver and/or a selling opportunity in gold.
When the ratio reaches the 10th percentile, Metal 1 is historically undervalued (cheap) compared to Metal 2.
Traders may look to buy Metal 1 and sell Metal 2, expecting the ratio to rise back toward its historical average.
Example (Gold/Silver Ratio): If the GSR is below the 10th percentile, gold is very cheap relative to silver, suggesting a potential buying opportunity in gold and/or a selling opportunity in silver.
⚪ Common Strategy Based on GSR Insights
A common approach involves monitoring the ratio for extreme values based on historical data. When the ratio reaches historically high levels, it suggests that gold is expensive relative to silver, potentially indicating a buying opportunity for silver and/or a selling opportunity for gold. Conversely, when the ratio is at historically low levels, silver is expensive relative to gold, suggesting a potential buying opportunity for gold and/or selling opportunity for silver. This mean-reversion strategy relies on the tendency of the GSR to return to its historical average over time.
⚪ Hedging & Portfolio Diversification
If Gold is strongly outperforming Silver, investors may shift allocations to balance risk.
If Silver is rapidly gaining on Gold, it may indicate increased industrial demand or speculative interest.
⚪ Inflation & Economic Cycles
A rising Gold-Silver ratio often correlates with economic downturns and increased risk aversion.
A falling Gold-Silver ratio may signal stronger economic growth and higher inflation expectations.
█ Settings
Precious Metals Table
Select which metals to display (Gold, Silver, Platinum, Palladium)
Choose measurement units (oz, kg, grams, troy ounces)
Ratio Analysis
Select Metal 1 & Metal 2 for ratio calculation
Set historical length for quantile calculations
Interpretation Table
Enable automated insights based on ratio levels
Physical Holdings Calculator
Enter metal weight, purity, and unit
Select calculation currency
-----------------
Disclaimer
The content provided in my scripts, indicators, ideas, algorithms, and systems is for educational and informational purposes only. It does not constitute financial advice, investment recommendations, or a solicitation to buy or sell any financial instruments. I will not accept liability for any loss or damage, including without limitation any loss of profit, which may arise directly or indirectly from the use of or reliance on such information.
All investments involve risk, and the past performance of a security, industry, sector, market, financial product, trading strategy, backtest, or individual's trading does not guarantee future results or returns. Investors are fully responsible for any investment decisions they make. Such decisions should be based solely on an evaluation of their financial circumstances, investment objectives, risk tolerance, and liquidity needs.
Statistics
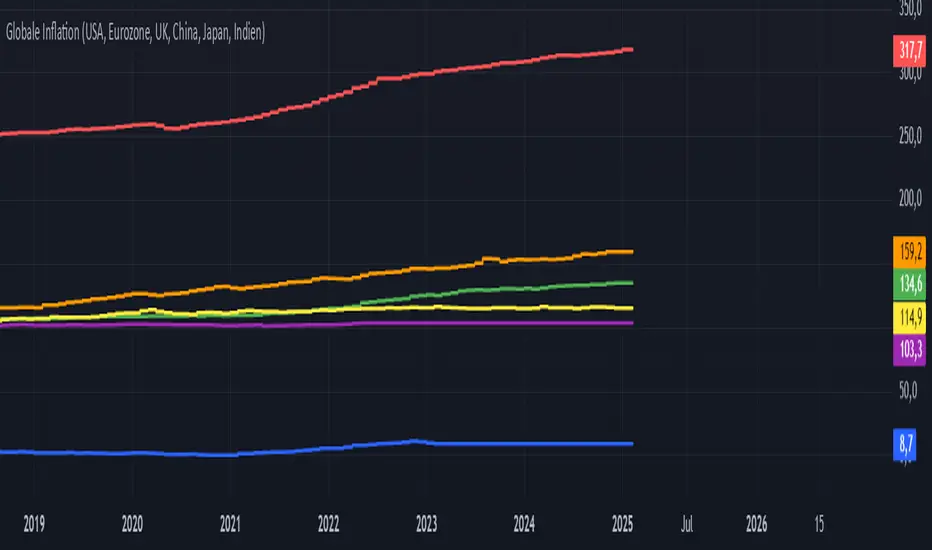
Global Inflation Indicator🔹 Overview:
The Global Inflation Indicator is a macro-analysis tool designed to track and compare inflation trends across major economies. It pulls Consumer Price Index (CPI) data from multiple regions, helping traders and investors analyze how inflation impacts global markets, particularly gold, forex, and commodities.
📊 Key Features:
✅ Tracks inflation in six major economies:
🇺🇸 USA (CPIAUCSL) – Key driver for USD and gold prices
🇪🇺 Eurozone (CPHPTT01EZM659N) – Euro inflation impact
🇬🇧 United Kingdom (GBRCPIALLMINMEI) – GBP & economic trends
🇨🇳 China (CHNCPIALLMINMEI) – Emerging market impact
🇯🇵 Japan (JPNCPIALLMINMEI) – Yen & inflation control policies
🇮🇳 India (INDCPIALLMINMEI) – Key gold-consuming economy
✅ Real-time Inflation Trends:
Provides a visual comparison of inflation levels in different regions.
Helps traders identify inflationary cycles & their effect on global assets.
✅ Macro-Driven Trading Decisions:
Gold & Forex Correlation: High inflation may increase demand for gold.
Interest Rate Expectations: Central banks respond to inflation shifts.
Currency Strength: Inflation impacts USD, EUR, GBP, JPY, CNY, INR.
📉 How to Use It:
Gold traders can assess inflation trends to predict potential price movements.
Forex traders can compare inflation effects on major currency pairs (EUR/USD, USD/JPY, GBP/USD, etc.).
Stock investors can evaluate how inflation affects central bank policies and interest rates.
📌 Conclusion:
The Global Inflation Indicator is a powerful tool for macroeconomic analysis, providing real-time insights into global inflation trends. By integrating this indicator into your gold, forex, and commodity trading strategies, you can make more informed investment decisions in response to economic changes.
Share SizeA helpful tool that estimates the amount of times you can trade at your current share size in a small account.
You can adjust the numbers in the settings page!

EMA Crossover Backtest [BarScripts]This indicator lets you backtest an EMA crossover strategy with built-in risk management and trade tracking. It simulates long and short trades based on EMA crossovers, allowing you to fine-tune entry conditions, stop-loss placement, and reward/risk settings.
🔹 How It Works:
Long Entry: Fast EMA crosses above Slow EMA, and price closes above Fast EMA.
Short Entry: Fast EMA crosses below Slow EMA, and price closes below Fast EMA.
Stop Loss: Set based on previous bars or a fixed amount.
Take Profit: Adjustable reward/risk ratio.
Higher Timeframe Confluence: Confirms trades based on a larger timeframe.
Trade Hours Filter: Limits trades to specific time windows.
🔹 Key Features:
✅ Shows Entry & Exit Points with visual trade lines.
✅ Customizable EMA Lengths to fit any strategy.
✅ P&L Tracking & Statistics to measure performance.
✅ Position Sizing Options: Fixed position, fixed risk, or percentage of balance.
✅ Commissions Tracking (based on total trades, not contracts).
Use this tool to fine-tune your EMA crossover strategy and see how it performs over time! 🚀
💬 Let me know your feedback—suggest improvements, report issues, or request new features!

Naive Bayes Candlestick Pattern Classifier v1.1 BETAAn intermezzo on why i made this script publication..
A : Candlestick Pattern took hours to backtest, why not using Machine Learning techniques?
B : Machine Learning, no that's gonna be really heavy bro!
A : Not really, because we use Naive Bayes.
B : The simplest, yet powerful machine learning algorithm to separate (a.k.a classify) multivariate data.
----------------------------------------------------------------------------------------------------------------------
Hello, everyone!
After deep research in extracting meaningful information from the market, I ended up building this powerful machine learning indicator based on the evolution of Bayesian Statistics. This indicator not only leverages the simplicity of Naive Bayes but also extends its application to candlestick pattern analysis, making it an invaluable tool for traders who are looking to enhance their technical analysis without spending countless hours manually backtesting each pattern on each market!.
What most interesting part is actually after learning all of likely useless methods like fibonacci, supply and demand, volume profile, etc. We always ended up back to basic like support and resistance and candlestick patterns, but with a slight twist on strategy algorithm design and statistical approach. Thus, the only reason why i made this, because i exactly know that you guys will ended up in this position as time goes by.
The essence of this indicator lies in its ability to automate the recognition and statistical evaluation of various candlestick patterns. Traditionally, traders have relied on visual inspection and manual backtesting to determine the effectiveness of patterns like Bullish Engulfing, Bearish Engulfing, Harami variations, Hammer formations, and even more complex multi-candle patterns such as Three White Soldiers, Three Black Crows, Dark Cloud Cover, and Piercing Pattern. However, these conventional methods are both time-consuming and prone to subjective bias.
To address these challenges, I employed Naive Bayes—a probabilistic classifier that, despite its simplicity, offers robust performance in various domains. Naive Bayes assumes that each feature is independent of the others given the class label, which, although a strong assumption, works remarkably well in practice, especially when the dataset is large like market data and the feature space is high-dimensional. In our case, each candlestick pattern acts as a feature that can be statistically evaluated based on its historical performance. The indicator calculates a probability that a given pattern will lead to a price reversal, by comparing the pattern’s close price to the highest or lowest price achieved in a lookahead window.
One of the standout features of this script is its flexibility. Each candlestick pattern is not only coded into the system but also comes with individual toggles to enable or disable them based on your trading strategy. This means you can choose to focus on single-candle patterns like Bullish Engulfing or more complex multi-candle formations such as Three White Soldiers, without modifying the core code. The built-in customization options allow you to adjust colors and labels for each pattern, giving you the freedom to tailor the visual output to your preference. This level of customization ensures that the indicator integrates seamlessly into your existing TradingView setup.
Moreover, the indicator isn’t just about pattern recognition—it also incorporates outcome-based learning. Every time a pattern is detected, it looks ahead a predefined number of bars to evaluate if the expected reversal actually materialized. This outcome is then stored in arrays, and over time, the script dynamically calculates the probability of success for each pattern. These probabilities are presented in a real-time updating table on your chart, which shows not only the percentage probability but also the count of historical occurrences. With this information at your fingertips, you can quickly gauge the reliability of each pattern in your chosen market and timeframe.
Another significant advantage of this approach is its speed and efficiency. While more complex machine learning models like neural networks might require heavy computational resources and longer training times, the Naive Bayes classifier in this script is lightweight, instantaneous and can be updated on the fly with each new bar. This real-time capability is essential for modern traders who need to make quick decisions in fast-paced markets.
Furthermore, by automating the process of backtesting, the indicator frees up your time to focus on other aspects of trading strategy development. Instead of manually analyzing hundreds or even thousands of candles, you can rely on the statistical power of Naive Bayes to provide you with insights on which patterns are most likely to result in profitable moves. This not only enhances your efficiency but also helps to eliminate the cognitive biases that often plague manual analysis.
In summary, this indicator represents a fusion of traditional candlestick analysis with modern machine learning techniques. It harnesses the simplicity and effectiveness of Naive Bayes to deliver a dynamic, real-time evaluation of various candlestick patterns. Whether you are a seasoned trader looking to refine your technical analysis or a beginner eager to understand market dynamics, this tool offers a powerful, customizable, and efficient solution. Welcome to a new era where advanced statistical methods meet practical trading insights—happy trading and may your patterns always be in your favor!
Note : On this current released beta version, you must manually adjust reversal percentage move based on each market. Further updates may include automated best range detection and probability.

[AcerX] Leverage, TP & Optimal TP CalculatorHow It Works
Inputs:
Portfolio Allocation (%): The percentage of your portfolio you're willing to risk on the trade.
Stop Loss (%): The stop loss distance below the entry price.
Taker Fee (%) and Maker Fee (%): The fees applied on entry and exit.
Calculations:
The script calculates the required "raw" leverage to risk 1% of your portfolio.
It floors the computed leverage to an integer ("effectiveLeverage").
If the computed leverage is less than 1, it shows an error message (and suggests the maximum allocation for at least 1× leverage).
Otherwise, it calculates the TP levels for target profits of 1.2%, 1.5%, and 2%, and an "Optimal TP" that nets a 1% profit after fees.
Display:
A table is drawn on the top right corner of your chart displaying the effective leverage, the TP levels, and an error message if applicable.
Simply add this script as a new indicator in TradingView, and adjust the inputs as needed.
Happy trading!

Adaptive Resonance Oscillator [AlgoAlpha]Introducing the Adaptive Resonance Oscillator , an advanced momentum-based oscillator designed to dynamically adjust to changing market conditions. This innovative indicator detects market frequency through a Hilbert Transform approach, adapting in real-time to identify overbought and oversold conditions with improved accuracy. With built-in divergence detection, trend analysis, and customizable smoothing, this tool is perfect for traders looking to refine their entries and exits based on adaptive oscillation mechanics.
🚀 Key Features :
🔹 Adaptive Frequency Detection – Uses Hilbert Transform principles to dynamically determine market cycle length for precise oscillator calculation.
⚙️ Customizable Smoothing – Option to apply a Hull Moving Average (HMA) for enhanced signal clarity.
📈 Divergence Detection – Identifies bullish and bearish divergences with visual markers, helping traders spot early trend reversals.
🟢 Overbought & Oversold Signals – Highlights extreme momentum conditions with adjustable thresholds.
🔔 Real-Time Alerts – Get notified for crossovers, divergences, and strong trend shifts directly on your TradingView chart.
🎨 Fully Customizable Appearance – Modify colors, divergence sensitivity, and smoothing options to fit your trading style.
🛠 How to Use :
Add the Adaptive Resonance Oscillator to your TradingView chart by clicking the ★ to favorite it.
Monitor the Charts , switch between smoothed and I smoothed modes to identify trend and price swings, use divergences and reversal signals for potential entry/exits.
Set alerts for bullish/bearish crossovers and divergence signals to stay ahead of market moves.
⚙ How It Works :
The indicator begins by applying a Hilbert Transform frequency estimation to the price series, identifying the dominant market cycle length. This is used to calculate a period for the RSI that matches its resonant frequency with the dominant market frequency, dynamically adjusting the Oscillator. The oscillator then applies an optional Hull Moving Average (HMA) smoothing for signal refinement. Additionally, the indicator scans for bullish and bearish divergences by comparing oscillator movements against price action, plotting signals accordingly. When overbought/oversold conditions or divergence events occur, alerts are triggered to notify the trader in real time.

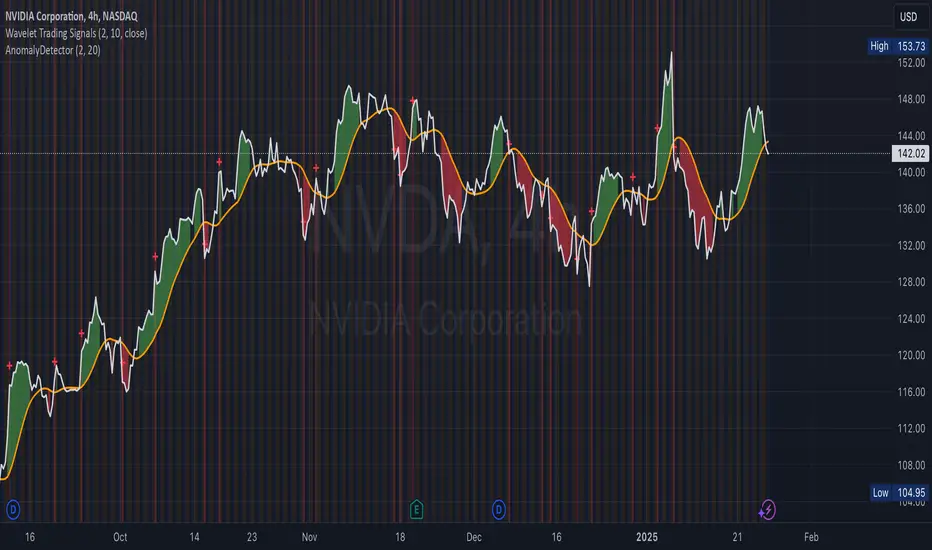
smolka Bayesian Volatile ChannelDescription in English and Russian.
Bayesian Volatile Channel
The script is a loose interpretation of Bayes' theorem, which allows calculating the probability of events given that another event related to it has occurred, the script analyzes volatility and detects anomalies in price charts using a Bayesian approach, updating the model parameters to accurately estimate market fluctuations and detect changes in trends.
How does it work?
1. The script sets the initial parameters (mean price and standard deviation), creating a "hypothesis" about the market behavior.
2. When a new price appears, the script calculates the probability of its compliance with previous expectations. If the new price differs from the forecast, the model parameters (mean and standard deviation) are updated.
3. After updating the model, the probability that the current price and volatility correspond to a normal distribution is calculated.
4. Based on the updated model, volatility channels are built (mean price ± two standard deviations). If the price goes beyond these limits, this signals a possible anomaly indicating changes in the market.
5. The moving averages in the script act as data smoothing and trend analysis, helping to identify the market direction and minimize the impact of random fluctuations. The script uses moving averages to identify uptrends and downtrends, and calculates the average between them to display the overall market balance. These moving averages make market analysis clearer and more resistant to short-term fluctuations.
******************************************************************
Описание на английском и русском языках.
Байесовский волатильный канал
Скрипт является вольной интерпретацией теоремы Байеса, которая позволяет расчитать вероятность событий при условии, что произошло связанное с ним другое событие, скрипт анализирует волатильность и обнаруживает аномалии в графиках цен, используя байесовский подход, обновляя параметры модели для точной оценки рыночных колебаний и обнаружения изменений в тенденциях.
Как это работает?
1. Скрипт устанавливает начальные параметры (среднюю цену и стандартное отклонение), создавая "гипотезу" о поведении рынка.
2. При появлении новой цены скрипт вычисляет вероятность её соответствия предыдущим ожиданиям. Если новая цена отличается от прогноза, параметры модели (среднее и стандартное отклонение) обновляются.
3. После обновления модели рассчитывается вероятность того, что текущая цена и волатильность соответствуют нормальному распределению.
4. На основе обновлённой модели строятся каналы волатильности (средняя цена ± два стандартных отклонения). Если цена выходит за эти пределы, это сигнализирует о возможной аномалии, указывающей на изменения на рынке.
5. Средние скользящие в скрипте выполняют роль сглаживания данных и анализа трендов, помогая выявить направление рынка и минимизировать влияние случайных колебаний. Скрипт использует скользящие средние для определения восходящего и нисходящего трендов, а также рассчитывает среднее значение между ними для отображения общего баланса рынка. Эти скользящие средние делают анализ рынка более чётким и устойчивым к краткосрочным флуктуациям.
Dynamic Deviation Levels [BigBeluga]Dynamic Deviation Levels is an innovative indicator designed to analyze price deviations relative to a smoothed midline. It provides traders with visual cues for overbought/oversold zones, price momentum, levels through labeled deviations and gradient candle coloring.
🔵Key Features:
Smoothed Midline:
A central line calculated as a smoothed median of the price source, serving as the baseline for price deviation analysis.
Dynamic Deviation Levels:
- Three deviation levels are plotted above and below the midline, with labels (1, 2, 3, -1, -2, -3) marking significant price movements.
- Helps traders identify overbought and oversold market conditions.
Heat-Colored Candles:
- Candle colors shift in intensity based on the deviation level, with four gradient shades for both upward and downward movements.
- Quickly highlights market extremes or stable zones.
Interactive Color Scale:
- A gradient scale at the bottom right of the chart visually represents deviation values.
- A triangle marker indicates the current price deviation in real time.
Optional Deviation Levels Display:
- Traders can enable all dynamic levels on the chart to visualize support and resistance areas dynamically.
🔵Usage and Benefits:
Identify Overbought/Oversold Zones: Use labeled deviation levels and heat-colored candles to spot stretched market conditions.
Track Trend Reversals and Momentum: Monitor price interactions with deviation levels for potential trend continuation or reversal signals.
Real-Time Deviation Insights: Leverage the color scale and triangle marker for live deviation tracking and actionable insights.
Map Dynamic Support and Resistance: Enable dynamic levels to highlight key areas where price reactions are likely to occur.
Dynamic Deviation Levels is an indispensable tool for traders aiming to combine price dynamics, momentum analysis, and visual clarity in their trading strategies.

Swing Profile Analyzer [ChartPrime]Swing Profile Analyzer
The Swing Profile Analyzer is a comprehensive tool designed to provide traders with valuable insights into swing frequency profiles, enabling them to identify key price levels and areas of market interest.
⯁ KEY FEATURES
Swing Frequency Profiles
Automatically plots frequency profiles for each swing, highlighting price distribution and key levels of significance.
Point of Control (POC) Line
Marks the price level with the highest number of closes within a swing, acting as a key area for potential price reactions.
Customizable Trend Display
Allows users to toggle between displaying profiles for bullish swings, bearish swings, or both, offering tailored analysis.
Integrated ZigZag Lines
Visualizes swing highs and lows, providing a clear picture of market trends and reversals.
Dynamic Profile Visualization
Profiles are color-coded to indicate the frequency of closes, with the highest value bins distinctly marked for easy recognition.
Max Frequency Highlight
Displays numerical values for the most active price level within each profile, showing how many closes occurred at the peak bin.
Updates only after swing formed
Profiles and POC lines automatically appear after swing is done
⯁ HOW TO USE
Identify Critical Price Levels
Use the POC line and frequency distribution to locate levels where price is likely to react or consolidate.
Analyze Swing Characteristics
Observe swing profiles to understand the strength, duration, and behavior of market trends.
Plan Entries and Exits
Leverage significant price levels and high-frequency bins to make more informed trading decisions.
Focus on Specific Trends
Filter profiles to analyze bullish or bearish swings based on your trading strategy.
⯁ CONCLUSION
The Swing Profile Analyzer is an essential tool for traders seeking to understand price dynamics within market swings. By combining frequency profiles, POC levels, and trend visualization, it enhances your ability to interpret and act on market movements effectively.

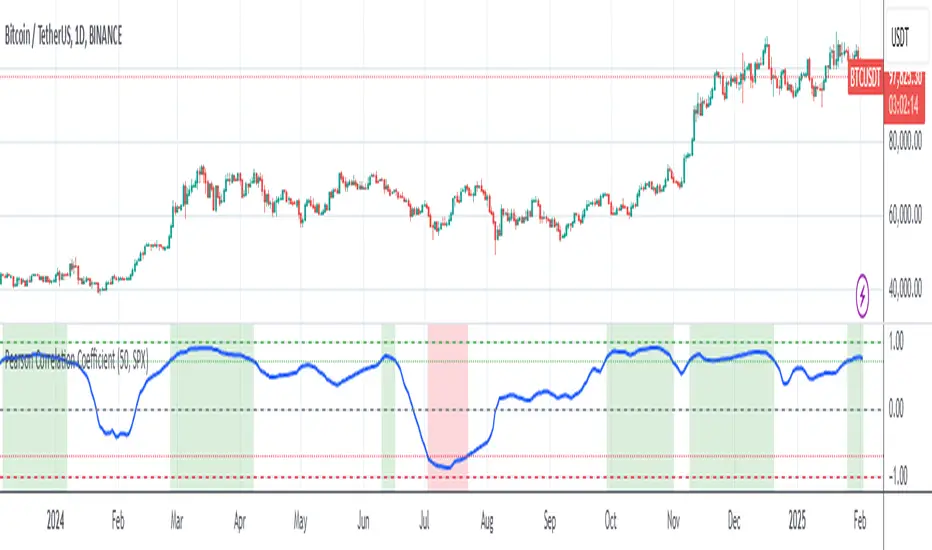
Pearson Correlation CoefficientDescription: The Pearson Correlation Coefficient measures the strength and direction of the linear relationship between two data series. Its value ranges from -1 to +1, where:
+1 indicates a perfect positive linear correlation: as one asset increases, the other asset increases proportionally.
0 indicates no linear correlation: variations in one asset have no relation to variations in the other asset.
-1 indicates a perfect negative linear correlation: as one asset increases, the other asset decreases proportionally.
This measure is widely used in technical analysis to assess the degree of correlation between two financial assets. The "Pearson Correlation (Manual Compare)" indicator allows users to manually select two assets and visually display their correlation relationship on a chart.
Features:
Correlation Period: The time period used for calculating the correlation can be adjusted (default: 50).
Comparison Asset: Users can select a secondary asset for comparison.
Visual Plots: The chart includes reference lines for perfect correlations (+1 and -1) and strong correlations (+0.7 and -0.7).
Alerts: Set alerts for when the correlation exceeds certain threshold values (e.g., +0.7 for strong positive correlation).
How to Select the Second Asset:
Primary Asset Selection: The primary asset is the one you select for viewing on the chart. This can be done by simply opening the chart for the desired asset.
Secondary Asset Selection: To select the secondary asset for comparison, use the input field labeled "Comparison Asset" in the script settings. You can manually enter the ticker symbol of the secondary asset you want to compare with the primary asset.
This indicator is ideal for traders looking to identify relationships and correlations between different financial assets to make informed trading decisions.
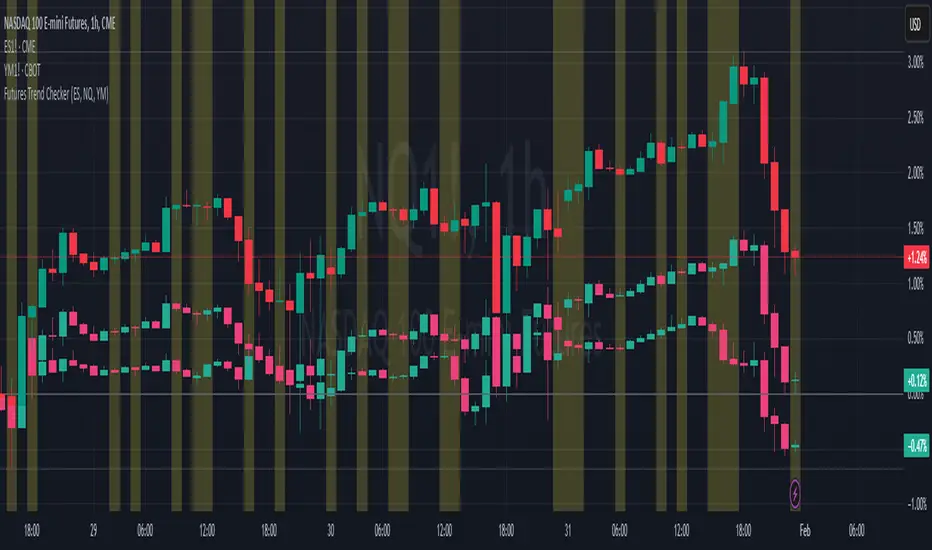
ELHAI Futures Trend Checker (ES, NQ, YM)The ELHAI Futures Trend Checker is a powerful TradingView indicator designed for futures traders who want to monitor the trend synchronization of the three major U.S. futures indices:
✅ E-mini S&P 500 (ES1!)
✅ E-mini Nasdaq 100 (NQ1!)
✅ E-mini Dow Jones (YM1!)
This indicator checks whether all three futures indices are bullish or bearish during each candle formation. If one of them is out of sync (e.g., two indices are bullish while one is bearish), the indicator triggers an alert and highlights the background in red, helping traders identify potential market indecision or divergence.
Key Features
📌 Designed for Futures Traders – Focuses on ES, NQ, and YM futures contracts.
📌 Live Market Monitoring – Works in real-time and updates dynamically with each tick.
📌 Bullish/Bearish Trend Confirmation – Detects when all three indices are in sync.
📌 Mismatch Detection – Alerts you when at least one index is out of trend.
📌 Custom Alerts – Set up TradingView alerts to be notified instantly when a trend mismatch occurs.
📌 Visual Background Highlight – A red background warns of a market divergence.
How It Works
The script retrieves open and close prices for ES, NQ, and YM.
Determines whether each futures index is bullish (close > open) or bearish (close < open).
If all three indices are bullish or all are bearish, it remains neutral.
If one index is different, an alert is triggered and the background turns red.
How to Use
Apply the indicator to your TradingView chart.
Choose any timeframe – Works well on intraday, daily, or higher timeframes.
Enable alerts: Go to Alerts → Create Alert, select "Futures Trend Mismatch", and set your preferred alert frequency.
Use alongside other indicators like moving averages, RSI, or MACD for better trade confirmation.
Best Use Cases
✔ Day traders & scalpers – Quickly spot market divergence in live trading.
✔ Swing traders – Identify when futures markets lose synchronization.
✔ Trend followers – Confirm if all major futures markets are aligned before making a move.
Final Notes
This indicator was built for Elhai to provide real-time trend analysis across major U.S. futures indices. Use it as a confirmation tool to improve market timing and decision-making.
ICT Killzones + Macros [TakingProphets]The ICT Killzones indicator is a powerful tool designed to visualize key trading sessions and market timing elements used in ICT (Inner Circle Trader) methodology. It includes:
• Session Markers:
- Asia Session
- London Session
- NY AM Session
- NY Lunch Session
- NY PM Session
• Key Price Levels:
- Session high/low levels that extend until violated
- Midnight Open price level (dotted line)
- True Day Open price level (6 PM EST, dotted line)
• ICT Macro Timing:
- First Macro: 9:45 AM - 10:15 AM EST
- Second Macro: 10:45 AM - 11:15 AM EST
- Distinctive L-shaped brackets marking start and end times
Features:
• Fully customizable colors and styles for all elements
• Adjustable label positions and sizes
• Toggle options for each component
• Smart timeframe filtering
• Clean, uncluttered visual design
This indicator helps traders identify key market structure points, session transitions, and optimal trading windows based on ICT concepts.

Binance Pseudo Funding FeeThe indicator calculates the Funding Fee for Binance based on the Premium Index provided by TradingView. The calculation formula can be found here: Binance Funding Rate Introduction . This is NOT the official rate visible on binance.com and used for settlements, but rather an estimated rate, which is inherently INACCURATE . The accuracy of the calculation heavily depends on the timeframe, with almost perfect results on minute-based timeframes.
For the most accurate calculations, you need to visit Binance Funding History and fill in the corresponding Interval , Interest Rate , and Funding Cap/Floor settings for the specific symbol in the indicator's settings. I understand this is not convenient, but for now, this is how it works.
The blue bars indicate the settlement time. Funding can be smoothed using moving averages. Both the funding rate and the moving averages are displayed using plot and are labeled, so you can set alerts on them.

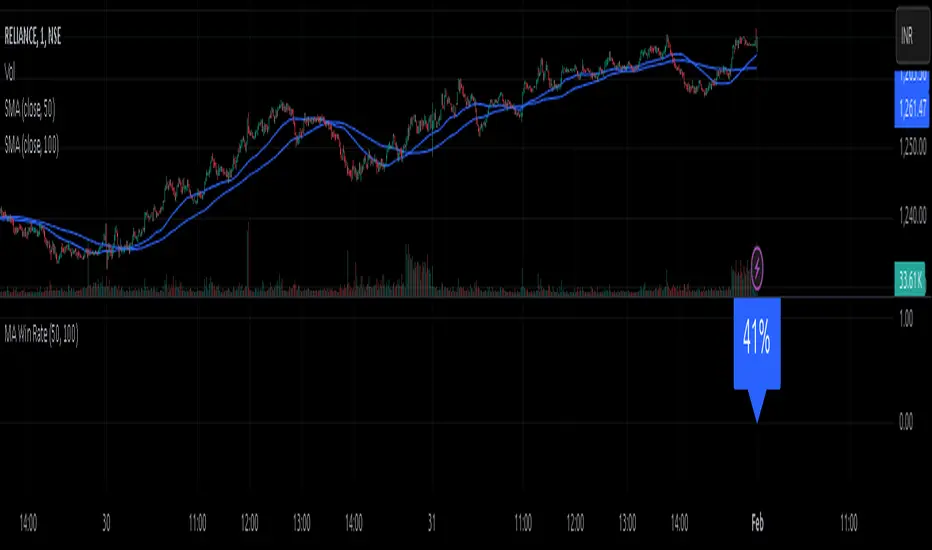
MA Win RateMoving Average Cross Win Rate
This simple yet useful script calculates the percentage of times a moving average crossover successfully predicts price movement.
Win Conditions:
1] A Golden Cross (fast MA crossing above slow MA) where the price moves up afterward.
2] A Death Cross (fast MA crossing below slow MA) where the price moves down afterward.
In this script, I have used a Simple Moving Average (SMA) for illustration.
You can modify the code to apply any type of moving average and test its accuracy.
Multi-indicator Signal Builder [Skyrexio]Overview
Multi-Indicator Signal Builder is a versatile, all-in-one script designed to streamline your trading workflow by combining multiple popular technical indicators under a single roof. It features a single-entry, single-exit logic, intrabar stop-loss/take-profit handling, an optional time filter, a visually accessible condition table, and a built-in statistics label. Traders can choose any combination of 12+ indicators (RSI, Ultimate Oscillator, Bollinger %B, Moving Averages, ADX, Stochastic, MACD, PSAR, MFI, CCI, Heikin Ashi, and a “TV Screener” placeholder) to form entry or exit conditions. This script aims to simplify strategy creation and analysis, making it a powerful toolkit for technical traders.
Indicators Overview
1. RSI (Relative Strength Index)
Measures recent price changes to evaluate overbought or oversold conditions on a 0–100 scale.
2. Ultimate Oscillator (UO)
Uses weighted averages of three different timeframes, aiming to confirm price momentum while avoiding false divergences.
3. Bollinger %B
Expresses price relative to Bollinger Bands, indicating whether price is near the upper band (overbought) or lower band (oversold).
4. Moving Average (MA)
Smooths price data over a specified period. The script supports both SMA and EMA to help identify trend direction and potential crossovers.
5. ADX (Average Directional Index)
Gauges the strength of a trend (0–100). Higher ADX signals stronger momentum, while lower ADX indicates a weaker trend.
6. Stochastic
Compares a closing price to a price range over a given period to identify momentum shifts and potential reversals.
7. MACD (Moving Average Convergence/Divergence)
Tracks the difference between two EMAs plus a signal line, commonly used to spot momentum flips through crossovers.
8. PSAR (Parabolic SAR)
Plots a trailing stop-and-reverse dot that moves with the trend. Often used to signal potential reversals when price crosses PSAR.
9. MFI (Money Flow Index)
Similar to RSI but incorporates volume data. A reading above 80 can suggest overbought conditions, while below 20 may indicate oversold.
10. CCI (Commodity Channel Index)
Identifies cyclical trends or overbought/oversold levels by comparing current price to an average price over a set timeframe.
11. Heikin Ashi
A type of candlestick charting that filters out market noise. The script uses a streak-based approach (multiple consecutive bullish or bearish bars) to gauge mini-trends.
12. TV Screener
A placeholder condition designed to integrate external buy/sell logic (like a TradingView “Buy” or “Sell” rating). Users can override or reference external signals if desired.
Unique Features
1. Multi-Indicator Entry and Exit
You can selectively enable any subset of 12+ classic indicators, each with customizable parameters and conditions. A position opens only if all enabled entry conditions are met, and it closes only when all enabled exit conditions are satisfied, helping reduce false triggers.
2. Single-Entry / Single-Exit with Intrabar SL/TP
The script supports a single position at a time. Once a position is open, it monitors intrabar to see if the price hits your stop-loss or take-profit levels before the bar closes, making results more realistic for fast-moving markets.
3. Time Window Filter
Users may specify a start/end date range during which trades are allowed, making it convenient to focus on specific market cycles for backtesting or live trading.
4. Condition Table and Statistics
A table at the bottom of the chart lists all active entry/exit indicators. Upon each closed trade, an integrated statistics label displays net profit, total trades, win/loss count, average and median PnL, etc.
5. Seamless Alerts and Automation
Configure alerts in TradingView using “Any alert() function call.”
The script sends JSON alert messages you can route to your own webhook.
The indicator can be integrated with Skyrexio alert bots to automate execution on major cryptocurrency exchanges
6. Optional MA/PSAR Plots
For added visual clarity, optionally plot the chosen moving averages or PSAR on the chart to confirm signals without stacking multiple indicators.
Methodology
1. Multi-Indicator Entry Logic
When multiple entry indicators are enabled (e.g., RSI + Stochastic + MACD), the script requires all signals to align before generating an entry. Each indicator can be set for crossovers, crossunders, thresholds (above/below), etc. This “AND” logic aims to filter out low-confidence triggers.
2. Single-Entry Intrabar SL/TP
One Position At a Time: Once an entry signal triggers, a trade opens at the bar’s close.
Intrabar Checks: Stop-loss and take-profit levels (if enabled) are monitored on every tick. If either is reached, the position closes immediately, without waiting for the bar to end.
3. Exit Logic
All Conditions Must Agree: If the trade is still open (SL/TP not triggered), then all enabled exit indicators must confirm a closure before the script exits on the bar’s close.
4. Time Filter
Optional Trading Window: You can activate a date/time range to constrain entries and exits strictly to that interval.
Justification of Methodology
Indicator Confluence: Combining multiple tools (RSI, MACD, etc.) can reduce noise and false signals.
Intrabar SL/TP: Capturing real-time spikes or dips provides a more precise reflection of typical live trading scenarios.
Single-Entry Model: Straightforward for both manual and automated tracking (especially important in bridging to bots).
Custom Date Range: Helps refine backtesting for specific market conditions or to avoid known irregular data periods.
How to Use
1. Add the Script to Your Chart
In TradingView, open Indicators , search for “Multi-indicator Signal Builder”.
Click to add it to your chart.
2. Configure Inputs
Time Filter: Set a start and end date for trades.
Alerts Messages: Input any JSON or text payload needed by your external service or bot.
Entry Conditions: Enable and configure any indicators (e.g., RSI, MACD) for a confluence-based entry.
Close Conditions: Enable exit indicators, along with optional SL (negative %) and TP (positive %) levels.
3. Set Up Alerts
In TradingView, select “Create Alert” → Condition = “Any alert() function call” → choose this script.
Entry Alert: Triggers on the script’s entry signal.
Close Alert: Triggers on the script’s close signal (or if SL/TP is hit).
Skyrexio Alert Bots: You can route these alerts via webhook to Skyrexio alert bots to automate order execution on major crypto exchanges (or any other supported broker).
4. Visual Reference
A condition table at the bottom summarizes active signals.
Statistics Label updates automatically as trades are closed, showing PnL stats and distribution metrics.
Backtesting Guidelines
Symbol/Timeframe: Works on multiple assets and timeframes; always do thorough testing.
Realistic Costs: Adjust commissions and potential slippage to match typical exchange conditions.
Risk Management: If using the built-in stop-loss/take-profit, set percentages that reflect your personal risk tolerance.
Longer Test Horizons: Verify performance across diverse market cycles to gauge reliability.
Example of statistic calculation
Test Period: 2023-01-01 to 2025-12-31
Initial Capital: $1,000
Commission: 0.1%, Slippage ~5 ticks
Trade Count: 468 (varies by strategy conditions)
Win rate: 76% (varies by strategy conditions)
Net Profit: +96.17% (varies by strategy conditions)
Disclaimer
This indicator is provided strictly for informational and educational purposes .
It does not constitute financial or trading advice.
Past performance never guarantees future results.
Always test thoroughly in demo environments before using real capital.
Enjoy exploring the Multi-Indicator Signal Builder! Experiment with different indicator combinations and adjust parameters to align with your trading preferences, whether you trade manually or link your alerts to external automation services. Happy trading and stay safe!

Percent Change HistogramThis indicator shows you percent changes in a super visual way using a color-coded histogram.
Here's how the colors work:
🟩 Dark green = percent change is growing stronger
🟢 Light green = still positive but losing steam
🟥 Dark red = getting more negative
🔴 Light red = negative but improving
The cool part? You can set any lookback period you want. For example:
24 periods on 1H chart = last 24 hours
30 periods on daily = last month
7 periods on daily = last week
Pro tip: You're not locked to your chart's timeframe! Want to see monthly changes while trading on 5min?
No problem.
You can even stack multiple indicators to watch different intervals simultaneously (daily, weekly, monthly) - super helpful for multi-timeframe analysis.
Perfect for spotting momentum shifts across different timeframes without switching between charts.

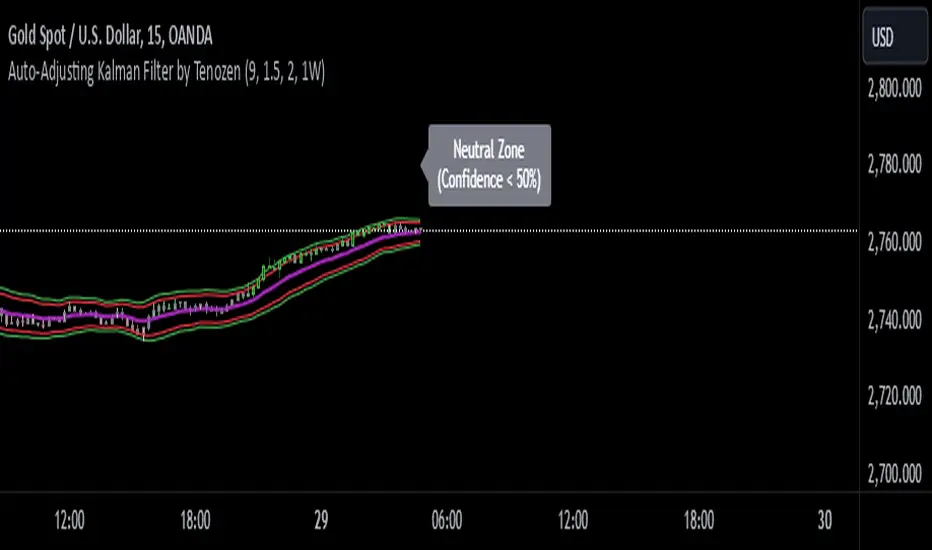
Auto-Adjusting Kalman Filter by TenozenNew year, new indicator! Auto-Adjusting Kalman Filter is an indicator designed to provide an adaptive approach to trend analysis. Using the Kalman Filter (a recursive algorithm used in signal processing), this algo dynamically adjusts to market conditions, offering traders a reliable way to identify trends and manage risk! In other words, it's a remaster of my previous indicator, Kalman Filter by Tenozen.
What's the difference with the previous indicator (Kalman Filter by Tenozen)?
The indicator adjusts its parameters (Q and R) in real-time using the Average True Range (ATR) as a measure of market volatility. This ensures the filter remains responsive during high-volatility periods and smooth during low-volatility conditions, optimizing its performance across different market environments.
The filter resets on a user-defined timeframe, aligning its calculations with dominant trends and reducing sensitivity to short-term noise. This helps maintain consistency with the broader market structure.
A confidence metric, derived from the deviation of price from the Kalman filter line (measured in ATR multiples), is visualized as a heatmap:
Green : Bullish confidence (higher values indicate stronger trends).
Red : Bearish confidence (higher values indicate stronger trends).
Gray : Neutral zone (low confidence, suggesting caution).
This provides a clear, objective measure of trend strength.
How it works?
The Kalman Filter estimates the "true" price by filtering out market noise. It operates in two steps, that is, prediction and update. Prediction is about projection the current state (price) forward. Update is about adjusting the prediction based on the latest price data. The filter's parameters (Q and R) are scaled using normalized ATR, ensuring adaptibility to changing market conditions. So it means that, Q (Process Noise) increases during high volatility, making the filter more responsive to price changes and R (Measurement Noise) increases during low volatility, smoothing out the filter to avoid overreacting to minor fluctuations. Also, the trend confidence is calculated based on the deviation of price from the Kalman filter line, measured in ATR multiples, this provides a quantifiable measure of trend strength, helping traders assess market conditions objectively.
How to use?
Use the Kalman Filter line to identify the prevailing trend direction. Trade in alignment with the filter's slope for higher-probability setups.
Look for pullbacks toward the Kalman Filter line during strong trends (high confidence zones)
Utilize the dynamic stop-loss and take-profit levels to manage risk and lock in profits
Confidence Heatmap provides an objective measure of market sentiment, helping traders avoid low-confidence (neutral) zones and focus on high-probability opportunities
Guess that's it! I hope this indicator helps! Let me know if you guys got some feedback! Ciao!
Moon Phases by Shailesh DesaiTrading Strategy Based on Lunar Phases
This custom trading indicator leverages the power of lunar cycles to provide unique market insights based on the four primary moon phases: New Moon, First Quarter, Full Moon, and Third Quarter. By aligning your trades with the natural rhythm of the moon, this strategy offers a different perspective to trading and can help enhance decision-making based on the cyclical nature of the market.
Key Features:
1. Moon Phase Identification:
o The indicator automatically identifies the current moon phase based on the user's selected timeframe and marks it on the chart.
o Each phase is visualized with a specific symbol and color to help traders easily recognize the current moon phase:
New Moon/Waxing Moon: Represented by a circle (colored as per user input).
First Quarter: Represented by a cross (colored as per user input).
Full Moon/Waning Moon: Represented by a circle (colored as per user input).
Third Quarter: Represented by a cross (colored as per user input).
2. Automatic Moon Phase Transition Detection:
o The indicator tracks and highlights when a phase change occurs. This feature ensures you are always aware of when the market moves from one phase to another.
o Moon phase changes are only visualized on the first bar of each new phase to avoid cluttering the chart.
3. Background Color Indicators:
o The background color dynamically changes according to the current moon phase, helping to reinforce the phase context for the trader. This feature makes it easy to see at a glance which phase the market is in.
4. Customizable Appearance:
o Customize the color of each moon phase to suit your preferences. Adjust the colors for the New Moon, First Quarter, Full Moon, and Third Quarter to align with your visual strategy.
5. Avoids Unsupported Timeframes:
o This indicator does not support monthly timeframes, ensuring that it operates smoothly only on timeframes that are compatible with the lunar cycle.
How to Use:
• The moon phases are thought to have an influence on human behavior and the market's psychology, making this indicator useful for traders who wish to integrate lunar cycles into their strategy.
• Traders can use the phase changes as an indicator of potential market momentum or reversal points. For example:
o New Moon may indicate the beginning of a new cycle, signaling a potential upward or downward move.
o Full Moon might suggest a peak or significant shift in market direction.
o First Quarter and Third Quarter phases may represent moments of consolidation or decision points.
Ideal for:
• Traders interested in cycle-based strategies or looking to experiment with new approaches.
• Those who believe in the influence of natural forces, including moon phases, on market movements.
• Technical analysts who want to add another layer of insights to their chart analysis.
Important Notes:
• The indicator uses precise astronomical calculations to identify the correct phase, ensuring accuracy.
• It’s important to understand that moon phase-based trading is not a standalone strategy but should ideally be combined with other technical analysis tools for maximum effectiveness.
Volatility & Big Market MovesThis indicator shows the volatility per candle, and highlights candles where volatility exceeds a defined threshold.
Data shown:
Furthest %-distance from the previous candle's closing price to the top (positive histogram).
Furthest %-distance from the previous candle's closing price to the bottom (negative histogram).

Asset Rotation System [InvestorUnknown]Overview
This system creates a comprehensive trend "matrix" by analyzing the performance of six assets against both the US Dollar and each other. The objective is to identify and hold the asset that is currently outperforming all others, thereby focusing on maintaining an investment in the most "optimal" asset at any given time.
- - - Key Features - - -
1. Trend Classification:
The system evaluates the trend for each of the six assets, both individually against USD and in pairs (assetX/assetY), to determine which asset is currently outperforming others.
Utilizes five distinct trend indicators: RSI (50 crossover), CCI, SuperTrend, DMI, and Parabolic SAR.
Users can customize the trend analysis by selecting all indicators or choosing a single one via the "Trend Classification Method" input setting.
2. Backtesting:
Calculates an equity curve for each asset and for the system itself, which assumes holding only the asset deemed optimal at any time.
Customizable start date for backtesting; by default, it begins either 5000 bars ago (the maximum in TradingView) or at the inception of the youngest asset included, whichever is shorter. If the youngest asset's history exceeds 5000 bars, the system uses 5000 bars to prevent errors.
The equity curve is dynamically colored based on the asset held at each point, with this coloring also reflected on the chart via barcolor().
Performance metrics like returns, standard deviation of returns, Sharpe, Sortino, and Omega ratios, along with maximum drawdown, are computed for each asset and the system's equity curve.
3 Alerts:
Supports alerts for when a new, confirmed optimal asset is identified. However, due to TradingView limitations, the specific asset cannot be included in the alert message.
- - - Usage - - -
1. Select Assets/Tickers:
Choose which assets or tickers you want to include in the rotation system. Ensure that all selected tickers are denominated in USD to maintain consistency in analysis.
2. Configure Trend Classification:
Decide on the trend classification method from the available options (RSI, CCI, SuperTrend, DMI, or Parabolic SAR, All) and adjust the settings to your preferences. This customization allows you to tailor the system to different market conditions or your specific trading strategy.
3. Utilize Backtesting for Calibration:
Use the backtesting results, including equity curves and performance metrics, to fine-tune your chosen trend indicators.
Be cautious not to overemphasize performance maximization, as this can lead to overfitting. The goal is to achieve a robust system that performs well across various market conditions, rather than just optimizing for past data.
- - - Parameters - - -
Tickers:
Asset 1: Select the symbol for the first asset.
Asset 2: Select the symbol for the second asset.
Asset 3: Select the symbol for the third asset.
Asset 4: Select the symbol for the fourth asset.
Asset 5: Select the symbol for the fifth asset.
Asset 6: Select the symbol for the sixth asset.
General Settings:
Trend Classification Method: Choose from RSI, CCI, SuperTrend, DMI, PSAR, or "All" to determine how trends are analyzed.
Use Custom Starting Date for Backtest: Toggle to use a custom date for beginning the backtest.
Custom Starting Date: Set the custom start date for backtesting.
Plot Perf. Metrics Table: Option to display performance metrics in a table on the chart.
RSI (Relative Strength Index):
RSI Source: Choose the price data source for RSI calculation.
RSI Length: Set the period for the RSI calculation.
CCI (Commodity Channel Index):
CCI Source: Select the price data source for CCI calculation.
CCI Length: Determine the period for the CCI.
SuperTrend:
SuperTrend Factor: Adjust the sensitivity of the SuperTrend indicator.
SuperTrend Length: Set the period for the SuperTrend calculation.
DMI (Directional Movement Index):
DMI Length: Define the period for DMI calculations.
Parabolic SAR:
PSAR Start: Initial acceleration factor for the Parabolic SAR.
PSAR Increment: Increment value for the acceleration factor.
PSAR Max Value: Maximum value the acceleration factor can reach.
Notes/Recommendations:
While this system is operational, it's important to recognize that it relies on "basic" indicators, which may not be ideal for generating trading signals on their own. I strongly suggest that users delve into the code to grasp the underlying logic of the system. Consider customizing it by integrating more sophisticated and higher-quality trend-following indicators to enhance its performance and reliability.
Disclaimer:
This system's backtest results are historical and do not predict future performance. Use for educational purposes only; not investment advice.

[COG] Advanced School Run StrategyAdvanced School Run Strategy (ASRS) – Explanation
Overview: The Advanced School Run Strategy (ASRS) is an intraday trading approach designed to identify breakout opportunities based on specific time and price patterns. This script applies the concepts of the Advanced School Run Strategy as outlined in Tom Hougaard's research, adapted to work seamlessly on TradingView charts. It leverages 5-minute candlestick data to set actionable breakout levels and provides traders with visual cues and alerts to make informed decisions.
Features:
Dynamic Breakout Levels: Automatically calculates high and low levels based on the market's behavior during the initial trading minutes.
Custom Visualization: Highlights breakout zones with customizable colors and transparency, providing clear visual feedback for bullish and bearish breakouts.
Configurable Alerts: Includes alert conditions for both bullish and bearish breakouts, ensuring traders never miss a trading opportunity.
Reset Logic: Resets breakout levels daily at the market open to ensure accurate signal generation for each session.
How It Works:
The script identifies key levels (high and low) after a configurable number of minutes from the market open (default: 25 minutes).
If the price breaks above the high level or below the low level, a corresponding breakout is detected.
The script draws breakout zones on the chart and triggers alerts based on the breakout direction.
All levels and signals reset at the start of each new trading session, maintaining relevance to current market conditions.
Customization Options:
Line and box colors for bullish and bearish breakouts.
Transparency levels for breakout visualizations.
Alert settings to receive notifications for detected breakouts.
Acknowledgment: This script is inspired by Tom Hougaard's Advanced School Run Strategy. The methodology has been translated into Pine Script for TradingView users, adhering to TradingView’s policies and community guidelines. This script does not redistribute proprietary content from the original research but implements the principles for educational and analytical purposes.

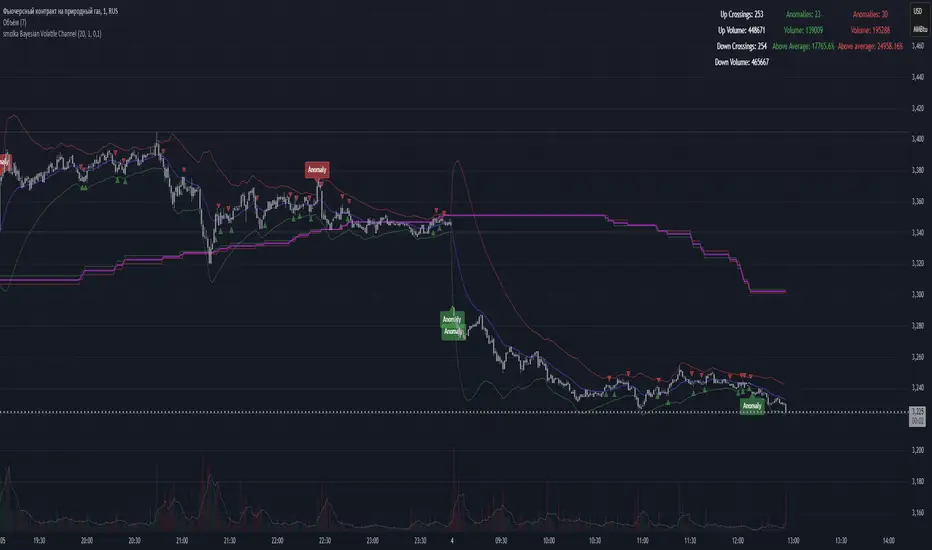
Anomaly DetectorPrice Anomaly Detector
This is a script designed to identify unusual price movements. By analyzing deviations from typical price behavior, this tool helps traders spot potential trading opportunities and manage risks effectively.
---
Features
- Anomaly Detection: Flags price points that significantly deviate from the average.
- Visual Indicators: Highlights anomalies with background colors and cross markers.
- Customizable Settings: Adjust sensitivity and window size to match your trading strategy.
- Real-Time Analysis: Continuously updates anomaly signals as new data is received.
---
Usage
After adding the indicator to your chart:
1. View Anomalies: Red backgrounds and cross markers indicate detected anomalies.
2. Adjust Settings: Modify the `StdDev Threshold` and `Window Length` to change detection sensitivity.
3. Interpret Signals:
- Red Background: Anomaly detected on that bar.
- Red Cross: Specific point of anomaly.
---
Inputs
- StdDev Threshold: Higher values reduce anomaly sensitivity. Default: 2.0.
- Window Length: Larger windows smooth data, reducing false positives. Default: 20.
---
Limitations
- Approximation Method: Uses a simple method to detect anomalies, which may not capture all types of unusual price movements.
- Performance: Extremely large window sizes may impact script performance.
- Segment Detection: Does not group consecutive anomalies into segments.
---
Disclaimer : This tool is for educational purposes only. Trading involves risk, and you should perform your own analysis before making decisions. The author is not liable for any losses incurred.