Fixed price Stop Loss [Takazudo]This strategy is a demo for fixed price stop loss.
This strategy enables you to specify fixed price stop loss. Let's say your deposit is USD. When you trade EURCAD, you need to specify the quantity for trade. Here comes three chances for trade.
A: SL pips: 500
B: SL pips: 200
C: SL pips: 100
In these trade, the risk is different for each. ABC risk ratio is 5:2:1. And, you cannot know how much to lose if the price hits the stop loss. This is a huge problem.
With this strategy, You can specify the fixed risk price for each trade. If you specify 100 USD for the risk, this strategy calculates how much quantity to buy or sell for each entry. In the case above, this strategy guides you how much quantity to buy or sell like below.
A: 2,000 qty (SL: 500pips)
B: 5,000 qty (SL: 200pips)
C: 10,000 qty (SL: 100pips)
If you make entries with those quantity and the price hits the stop loss, You will lose the money like below.
A: 100 USD
B: 100 USD
C: 100 USD
This is what this script does. Fixed price SL.
I tested this caliculation for OANDA's main 28 currency pairs forex listed below.
AUDUSD, EURUSD, GBPUSD, NZDUSD, USDCAD, USDCHF, USDJPY, AUDCAD, AUDCHF, AUDJPY, AUDNZD, CADCHF, CADJPY, CHFJPY, EURAUD, EURCAD, EURCHF, EURGBP, EURJPY, EURNZD, GBPAUD, GBPCAD, GBPCHF, GBPJPY, GBPNZD, NZDCAD, NZDCHF, NZDJPY
I may add more pairs later.
Note: The entry strategy in this script is not intented to win. Check the result. Be careful.
Stoploss

ATR SL/TPThis indicator uses the ATR to give areas where the user might want to take profit or set a stop loss.

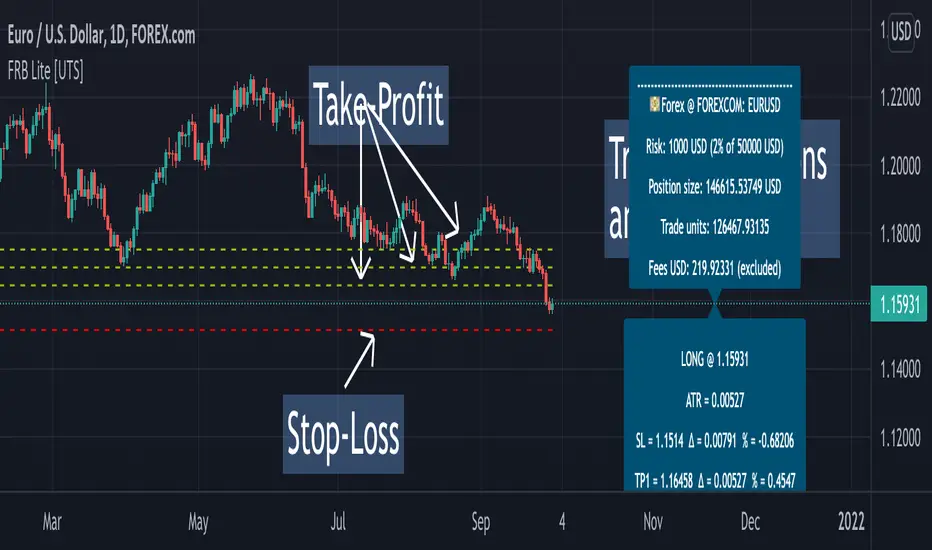
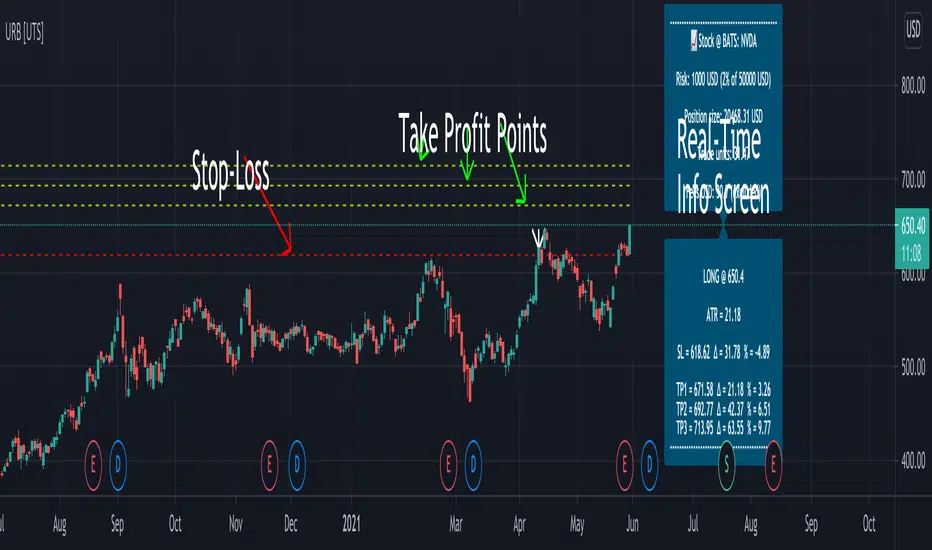
Forex Risk Buddy - Lite: Position Size, SL & TP System [UTS]Forex Risk Buddy - Lite
Position Size, Stop Loss & Take Profit System
The ultimate system to calculate trading risk on forex markets.
The 'Lite' version is limited to the EUR/USD forex trading pair.
💵 Forex
Position Sizing
De-risk possible drawdown by calculating a proper position size.
Define your risk percent based on your net value
Freely define your account currency
Trade any asset by the customizable Base / Quote currency factor
Calculate trading fees
Show all information on a customizable data screen
Stop Loss
Minimize trade risk by calculating your stop-loss.
Percent, Value and Delta display from current price
ATR based (Average True Range, modifiable)
Custom SL value possible
Adjustable
Two visual representations on chart
Automatically and real-time calculated on screen
Take Profit
Multiple take-profit levels to ensure not giving back to the market.
Up to 3 take profit levels to define
ATR based (Average True Range, modifiable)
Custom TP values possible
Easily customizable
Two visual representations on chart
Automatically and real-time calculated on screen
Currencies
Choose an account currency and calculate your risk for every trading pair.
USD
EUR
GBP
AUD
CAD
CHF
HKD
JPY
NOK
NZD
RUB
SEK
SGD
TRY
ZAR
BTC (crypto)
ETH (crypto)
USDT (crypto)
BUSD (crypto)
USDC (crypto)
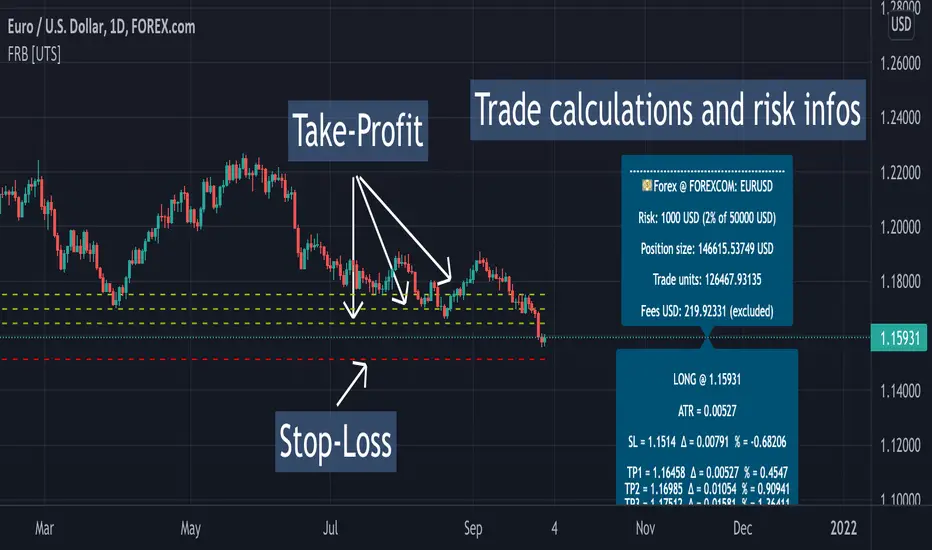
Forex Risk Buddy: Position Size, SL & TP System [UTS]Forex Risk Buddy
Position Size, Stop Loss & Take Profit System
The ultimate system to calculate trading risk on forex markets.
💵 Forex
Position Sizing
De-risk possible drawdown by calculating a proper position size.
Define your risk percent based on your net value
Freely define your account currency
Trade any asset by the customizable Base / Quote currency factor
Calculate trading fees
Show all information on a customizable data screen
Stop Loss
Minimize trade risk by calculating your stop-loss.
Percent, Value and Delta display from current price
ATR based (Average True Range, modifiable)
Custom SL value possible
Adjustable
Two visual representations on chart
Automatically and real-time calculated on screen
Take Profit
Multiple take-profit levels to ensure not giving back to the market.
Up to 3 take profit levels to define
ATR based (Average True Range, modifiable)
Custom TP values possible
Easily customizable
Two visual representations on chart
Automatically and real-time calculated on screen
Currencies
Choose an account currency and calculate your risk for every trading pair.
USD
EUR
GBP
AUD
CAD
CHF
HKD
JPY
NOK
NZD
RUB
SEK
SGD
TRY
ZAR
BTC (crypto)
ETH (crypto)
USDT (crypto)
BUSD (crypto)
USDC (crypto)
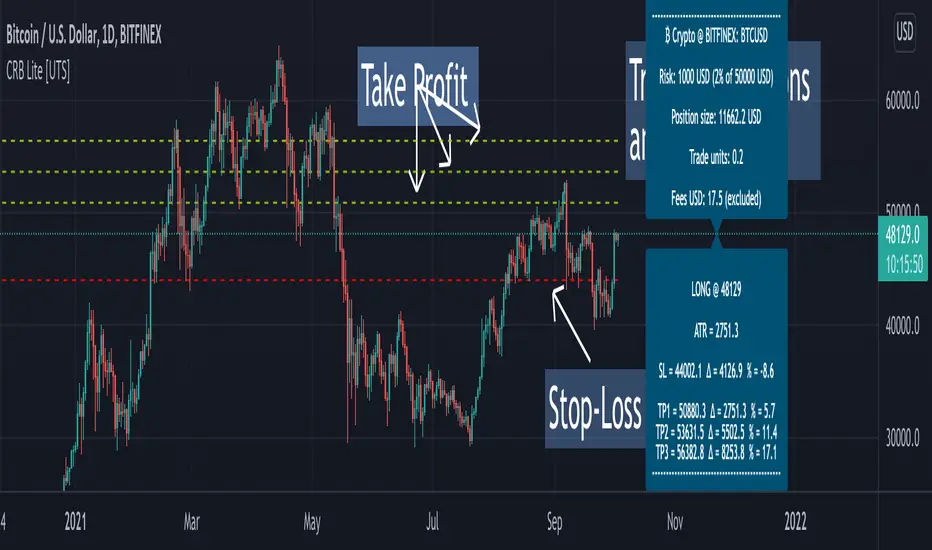
Crypto Risk Buddy - Lite: Position Size, SL & TP System [UTS]
Crypto Risk Buddy - Lite
Position Size, Stop Loss & Take Profit System
The ultimate system to calculate trading risk on crypto assets.
The 'Lite' version is limited to BTC as base currency.
₿ Cyptocurrencies
Position Sizing
De-risk possible drawdown by calculating a proper position size.
Define your risk percent based on your net value
Freely define your account currency
Trade any asset by the customizable Base / Quote currency factor
Calculate trading fees
Show all information on a customizable data screen
Stop Loss
Minimize trade risk by calculating your stop-loss.
Percent, Value and Delta display from current price
ATR based (Average True Range, modifiable)
Custom SL value possible
Adjustable
Two visual representations on chart
Automatically and real-time calculated on screen
Take Profit
Multiple take-profit levels to ensure not giving back to the market.
Up to 3 take profit levels to define
ATR based (Average True Range, modifiable)
Custom TP values possible
Easily customizable
Two visual representations on chart
Automatically and real-time calculated on screen
Currencies
Choose an account currency and calculate your risk for every trading pair.
USD
EUR
GBP
AUD
CAD
CHF
HKD
JPY
NOK
NZD
RUB
SEK
SGD
TRY
ZAR
BTC (crypto)
ETH (crypto)
USDT (crypto)
BUSD (crypto)
USDC (crypto)
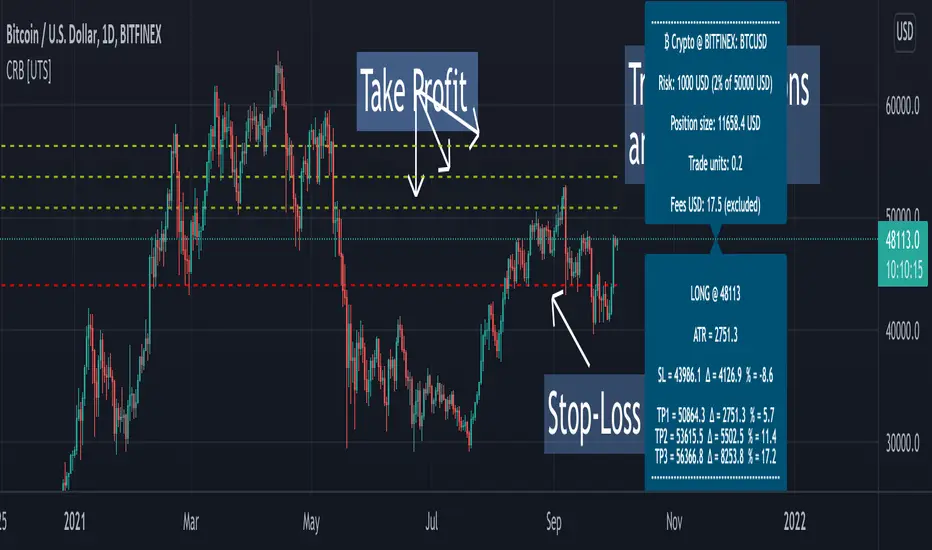
Crypto Risk Buddy: Position Size, SL & TP System [UTS]
Crypto Risk Buddy
Position Size, Stop Loss & Take Profit System
The ultimate system to calculate trading risk on crypto assets.
₿ Cyptocurrencies
Position Sizing
De-risk possible drawdown by calculating a proper position size.
Define your risk percent based on your net value
Freely define your account currency
Trade any asset by the customizable Base / Quote currency factor
Calculate trading fees
Show all information on a customizable data screen
Stop Loss
Minimize trade risk by calculatig your stop-loss.
Percent, Value and Delta display from current price
ATR based (Average True Range, modifiable)
Custom SL value possible
Adjustable
Two visual representations on chart
Automatically and real-time calculated on screen
Take Profit
Multiple take-profit levels to ensure not giving back to the market.
Up to 3 take profit levels to define
ATR based (Average True Range, modifiable)
Custom TP values possible
Easily customizable
Two visual representations on chart
Automatically and real-time calculated on screen
Currencies
Choose an account currency and calculate your risk for every trading pair.
USD
EUR
GBP
AUD
CAD
CHF
HKD
JPY
NOK
NZD
RUB
SEK
SGD
TRY
ZAR
BTC (crypto)
ETH (crypto)
USDT (crypto)
BUSD (crypto)
USDC (crypto)
Probability of Touch [racer8]This indicator calculates the probability of touch for a stop loss...the probability that it will be triggered. Does it really calculate probability? Yes, it gives you an idea of the probability of being stopped out of a trade... but results are not guaranteed as this is a theoretical formula I developed on my own. Nevertheless, use this at your own discretion...and hope you enjoy it ;)
FYI: This indicator was inspired by the Probability of Touch concept in options trading!

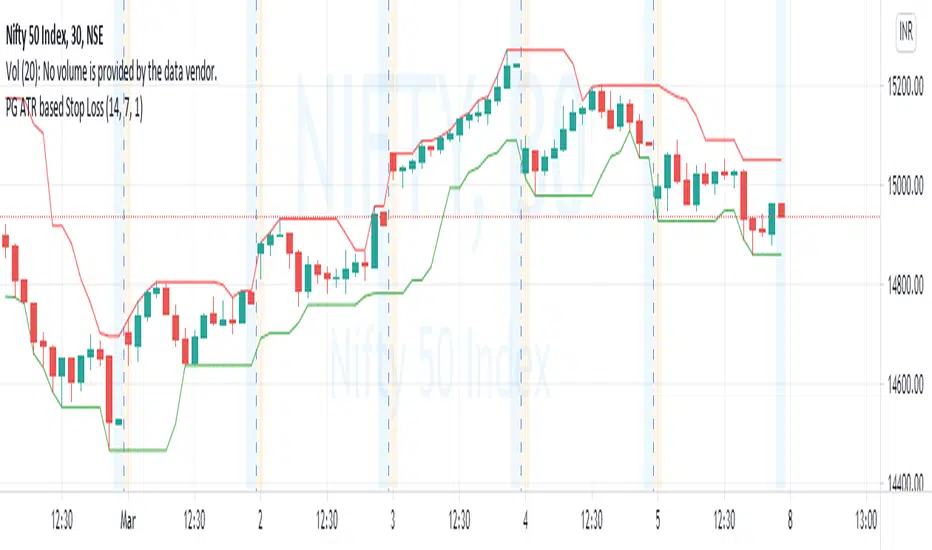
PG ATR based Stop LossA stoploss system that enables traders to exit with limited loss or even trailing loss.
Use the levels of indicator against the candle that has seen signidicant move for running positions and the candle in which a new position is taken.
Example : For long Nifty Future at 14990 levels, when Indicator is showing 14820 at bottom on a 30 min chart, 14820 can be used as a stop loss,
similarly for short conditions upper values above top of he candle will be followed.
For medium term ongoing positions, use the levels marked against candle that offered a major move, or the candles that has put the underlying in a new price zone or range.
15-30 minutes are suitable period for intraday / short term trades. Two hours or day periods can be used for positional trades.
**Queries are welcme.**
CUT MY LOSSESS - Levereged Stop loss + R / R ratio checker Hello traders!
We have heard many times that keep your losses small and allow your profits to grow. But what happens is that we often make the mistake of doing high-margin trades that we cannot afford to lose. The main reason for this problem, in my opinion, is the rush to open a position and not paying attention to how much acceptable loss in each trade is for us? Is our stop loss point compatible with the loss we are willing to accept?
Many of the losses we incur are not due to our erroneous analysis but to the wrong trading strategy, miscalculation of Stop Loss and failure to calculate the Risk/Reward for each trade. At least for most novice traders, these mistakes happen .
This script does not have complicated logic and is designed only as a help for those who are not interested in working with calculators !! I hope that sometimes that we are very excited to buy, looking at this script can give us a serious flip to avoid risk .
This is a basic script that helps us to intuitively check our stop loss in according to our leverage and to guess the approximate risk/reward of our trade. This script assumes that you always trade with half of your total capital. It is also assumed that you routinely use up to ten percent of your capital for each trade. Therefore, the first variable in this script is the amount of tolerable loss in each trade for you, which is set to 25% by default. So if you follow the previous assumptions, each trade will endanger 2.5% of your capital.
Since not all analyzes are ever accurate, we need to enter into positions that have good Risk/Reward ratio, so that even if half of our analysis fails, we will profitable. Therefore, the second variable in this script is the acceptable Risk/Reward ratio for us, which is set to 1:4 by default.
Also, to check the efficiency of the stop-loss with different trading leverage, I add five leverage by default from 1 to 5 as lines on the side of your stop-loss point.
LeV A (Lowest Leverage-WHITE): 1 by default
LeV B (AQUA): 2 by default
LeV C (YELLOW): 3 by default
LeV D (ORANGE): 4 by default
LeV E (Highest Leverage-RED):5 by default
You can change all these leverages and Acceptable margin loss and R/R ratio according to your needs.
You can also hide the leverage lines you are not dealing with through the script settings .
You will also see lines on the side of your target point to check your risk/reward ,so you can approximate your target according to your trading leverage and the risk/reward you accept. you can also hide these R/R lines from the setting.
Important Note: This script is not designed to give you a stop loss point or take profit point.
To find these points, you must use technical analysis methods , and then use this script to check the coordination of these points with your trading strategy.
Using the script is simple, but I will try to explain it with a few examples.

Risk Management: Position Size & Risk RewardHere is a Risk Management Indicator that calculates stop loss and position sizing based on the volatility of the stock. Most traders use a basic 1 or 2% Risk Rule, where they will not risk more than 1 or 2% of their capital on any one trade. I went further and applied four levels of risk: 0.25%, 0.50%, 1% and 2%. How you apply these different levels of risk is what makes this indicator extremely useful. Here are some common ways to apply this script:
• If the stock is extremely volatile and has a better than 50% chance of hitting the stop loss, then risk only 0.25% of your capital on that trade.
• If a stock has low volatility and has less than 20% change of hitting the stop loss, then risk 2% of your capital on that trade.
• Risking anywhere between 0.25% and 2% is purely based on your intuition and assessment of the market.
• If you are on a losing streak and you want to cut back on your position sizing, then lowering the Risk % can help you weather the storm.
• If you are on a winning streak and your entries are experiencing a higher level of success, then gradually increase the Risk % to reap bigger profits.
• If you want to trade outside the noise of the market or take on more noise/risk, you can adjust the ATR Factor.
• … and whatever else you can imagine using it to benefit your trading.
The position size is calculated using the Capital and Risk % fields, which is the percentage of your total trading capital (a.k.a net liquidity or Capital at Risk). If you instead want to calculate the position size based on a specific amount of money, then enter the amount in the Custom Risk Amt input box. Any amount greater than 0 in the Custom Risk Amt field will override the values in the Capital and Risk % fields.
The stop loss is calculated by using the ATR. The default setting is the 14 RMA, but you can change the length and smoothing of the true range moving average to your liking. Selecting a different length and smoothing affects the stop loss and position size, so choose these values very carefully.
The ATR Factor is a multiplier of the ATR. The ATR Factor can be used to adjust the stop loss and move it outside of the market noise. For the more volatile stock, increase the factor to lower the stop loss and reduce the chance of getting stopped out. For stocks with less volatility , you can lower the factor to raise the stop loss and increase position size. Adjusting the ATR Factor can also be useful when you want the stop loss to be at or below key levels of support.
The Market Session is the hours the market is open. The Market Session only affects the Opening Range Breakout (ORB) option, so it’s important to change these values if you’re trading the ORB and you’re outside of Eastern Standard Time or you’re trading in a foreign exchange.
The ORB is a bonus to the script. When enabled, the indicator will only appear in the first green candle of the day (09:30:00 or 09:30 AM EST or the start time specified in Market Session). When using the ORB, the stop loss is based on the spread of the first candle at the Open. The spread is the difference between the High and Low of the green candle. On 1-day or higher timeframes, the indicator will be the spread of the last (or current) candle.
The output of the indicator is a label overlaying the chart:
1. ATR (14 RMA x2) – This indicated that the stop loss is determined by the ATR. The x2 is the ATR Factor. If ORB is selected, then the first line will show SPREAD, instead of ATR.
2. Capital – This is your total capital or capital at risk.
3. Risk X% of Capital – The amount you’re risking on a % of the Capital. If a Custom Risk Amt is entered, then Risk Amount will be shown in place of Capital and Risk % of Capital.
4. Entry – The current price.
5. Stop Loss – The stop loss price.
6. -1R – The stop loss price and the amount that will be lost of the stop loss is hit.
7. – These are the target prices, or levels where you will want to take profit.
This script is primarily meant for people who are new to active trading and who are looking for a sound risk management strategy based on market volatility . This script can also be used by the more experienced trader who is using a similar system, but also wants to see it applied as an indicator on TradingView. I’m looking forward to maintaining this script and making it better in future revisions. If you want to include or change anything you believe will be a good change or feature, then please contact me in TradingView.

coates moving averages (cma)This indicator uses three moving averages:
2 period low simple ma
2 period high simple ma
9 period least squares ma
The trend is determined by the angle of the moving averages, current close relative the the 9 least squares ma (lsm) and the current close relative to the prior two periods high and low.
When there are consecutive closes inside the prior two candles high and low then a range is signaled:
In ranges the buy zone is between the lowest low and the lowest close of the current range. The sell zone is between the highest high and the highest close. The zones are adjusted as long as the new close is within the prior two candles range:
When price closes above the 2 high ma and the 9 lsm then a bull trend is signaled if all moving averages are angled upward (as seen at #4 in the chart above and #1 the chart below ). If the 9 lsm and / or the 2 low ma continue to angle downward, following a close above the 2 high ma and 9 lsm, then a prolonged range or reversal is expected (#2 in the chart below):
During a bull trend the buy zone is between the 2 low ma and the 9 lsm. The profit target is the 2 high ma:
During dip buying opportunities price should resist closing below the 9 lsm. If there is one close below the 9 lsm then it is a canary in the coalmine that tells us to proceed with caution. This will often signal a range, based on the conditions outlined above. To avoid a prolonged range, or reversal, price needs to immediately react in the direction of the prevailing trend:
If the moving averages are angled down and the most recent close is below the 2 low ma and 9 lsm then trend is fully bearish:
During a bear trend the short zone is between the 2 high ma and 9 lsm. The profit target is the 2 low ma:
When the 2 high ma angles down and the 2 low ma angles up while price closes inside both mas then it indicates a cma squeeze:
Volatility is expected in the direction of the breakout following the squeeze. In this situation traps / shakeouts are common. If there is a wick outside the cma, with a close inside, then it indicates a trap / shakeout. If there is a close outside the 2 high / low ma then it signals a breakout.
A trend is considered balanced when the 9 lsm is roughly equidistant from the 2 low and 2 high mas. If the 9 lsm crosses the 2 high or 2 low ma then it signals exhaustion / imbalance.
For a stop loss I use the prior three periods low, for bull trends, and the prior three periods high for bear trends. I would expect other reliable stops, such as the parabolic sar or bill williams fractal, to be effective as well. The default moving averages should be very effective on all timeframes and assets classes, however this indicator was developed for bitcoin with a focus on higher timeframes such as the 4h, daily and weekly.
As with any other technical indicator there will be bad signals. Proceed with caution and never risk more than you are willing to lose.

ATR Without OutliersIt is an ATR indicator which filters out outliers.
Outliers are values which are higher than the standard deviation of the true range.
It may be better than normal ATR for stop loss, because it does not keep large values after pump or dump.
It is very useful for high volatile markets like crypto markets.

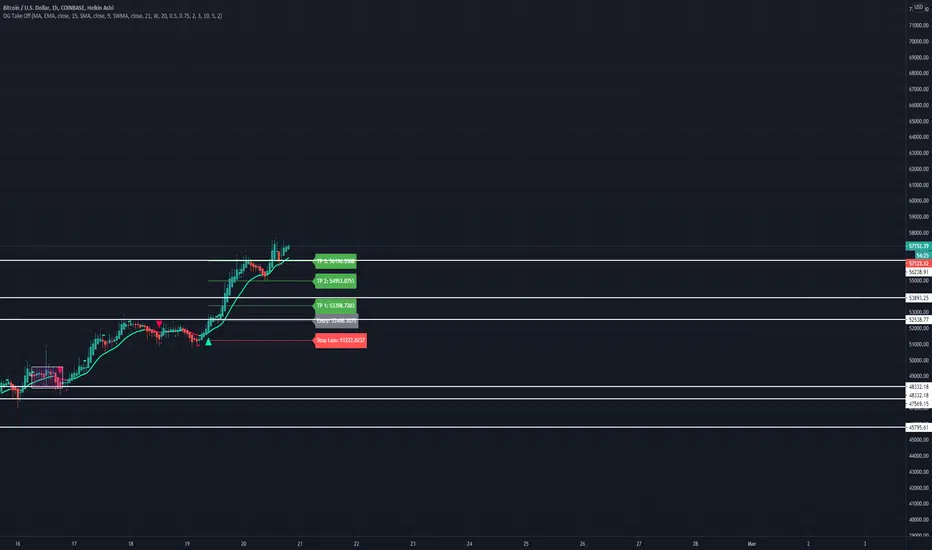
OG Take OffThis indicator is put in place to help you identify the 3 market phases.
Consolidation can be indicated by either dots or color coded candlesticks . You can use both. Consolidation zones are represented by the dotted lines.
A green arrow indicates a buy signal. A red arrow indicates a sell signal.
Theme allows you to change the color of the background to whatever you like.
To change the color of the moving average, you must uncheck "Modern Theme Trend MA Color" under 'Style'.
When price is above 50 moving average on the higher timeframe and the color of the candle is green on the higher time frame, you are in a long market. When price is below the 50 moving average and the color of the candle is red on the higher timeframe, you are in a short market.
Trend puts a trend cloud on the chart. When green and above the 50 moving average, you can assume the market is long. Look for buys on the smaller time frame. When red and below the 50 moving average, you can assume the market is short on the smaller time frame. You can also draw an average price line through the middle of the consolidation box to tell you the directional bias.
The moving average is set to 50 by default but can be changed. You can also add 2 more moving averages to the chart. (Options: SMA , EMA , SWMA , WMA , VWMA , HMA )
Consolidation on the inputs page allows you to see when the market is consolidating with dots and color change of the candlesticks . Opacity of the dots can be changed under 'Style' (Upper Band Dots/Lower Band Dots) You can assume when the dots are below the candlestick , price is buying; when the dots ae above the candlesticks , price is selling.
't' and 'b' represent tops and bottoms and can help you recognize finding the top and bottom on the daily when doing top down analysis. It can also help you recognize double tops, double bottoms, triple tops, etc.
This indicator is best used on the 1 hr or 4 hr time frame. If you zoom out on the chart, you can notice when the market is consolidating, when the market is in expansion phase, and when the market is trending. When the market is in expansion phase, you may see a lot of 'swing low/swing high' action. When the market is trending, it takes off and doesn't look back.
If you enter on the 5 min and ride the 1 hr trend, that is a great idea. If you enter on the 15 min and ride the 4 hr trend, that is an even better idea.
The TP levels can be changed according to your risk reward ratio.
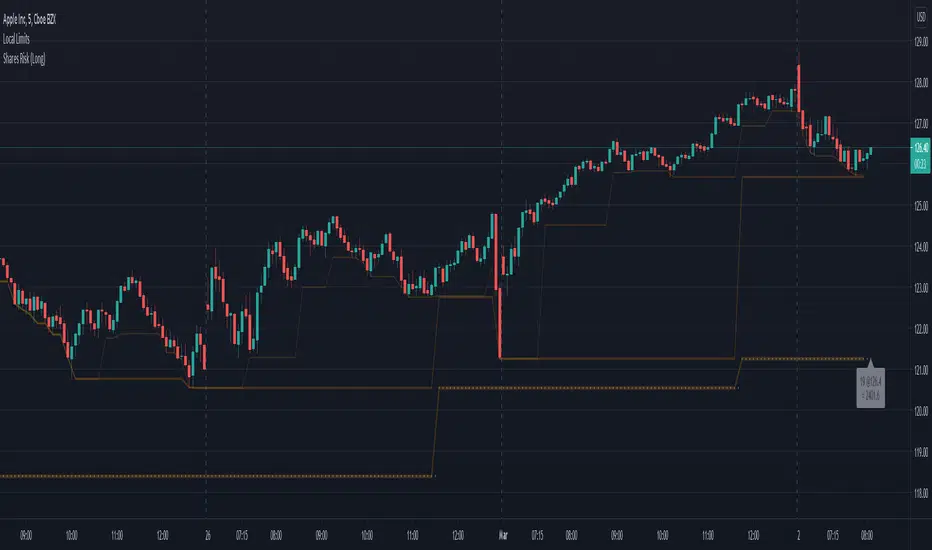
Shares Risk (Long)Ever struggle to know how many shares you should be placing your order with? Risk is different for every person and every stock. This can help.
In the example above, I've added this indicator the the chart.
I then specified:
Risk Amount ($) = $500. (The max amount I'm willing to risk.)
Risk Source = (another indicator) Lower Limit 3 . (See Lower Limits for more details)
Source Risk (%) = 0.0 (The default is 5.0 expecting the Risk Source to be the close.**)
Based upon how much I'm willing to risk, and the price difference between the close and Risk Source , this indicator will show the number of shares to purchase such that if the price drops to the stop level specified, my value loss should be limited to the Risk Amount .
333 shares is the value calculated for this example (latest bar). You can easily see how many shares you need to purchase for the lastest bar as well as track the previous values on the chart and the indicator cursor data.
---
** WARNING: There's no magic here. It's just math. So if you specify another indicator as the source, the values could get a bit strange and if the price is very close to the stop level, the number of shares could be unreasonably high. To help avoid this you can increase the minimum percent.
MRC Trend Trader [VK]MRC Trend Trader one of the best indicator by VK. Usable for Trend, Swing, positional Trading. Works on all types of markets and symbols, Best To use in Time Frame Higher Than 30m
About The Indicator :
This indicator uses MACD to scan the Trend Based on Higher TF and RSI+CCI for entries . It also has the ability to plot MACD crossing signal line in higher TF, plotted on the bottom of the chart and ATR is used for Stop Loss, plotted below Signals. One of the best function of this indicator is support/resistance levels, dot lines plotted on the chart, Which can be used to Take Profit as targets.
How To Use :
The main strategy behind this indicator is to only Long When Background Trend is green and only Short when Background trend is red . Enter on B/S Signal close.
Functions :
- MACD to scan Trend and MACD cross on Multi Time Frame.
- RSI to find lower Buy entry and Higher Sell entry (MTF - Only use current TF or Lower).
- CCI to find continuation entries (More Signals).
- Stop Loss.
- Support and Resistance Levels (Take Profit Targets).
This indicator is set up keeping Money management as one of the main priority, Keep taking profits on targets and always move Stop Loss to Breakeven Once in Profit.
PM for access.

Uber Risk Buddy: Position Size, SL & TP System [UTS]
Uber Risk Buddy
Position Size, Stop Loss & Take Profit System
The ultimate system to calculate trading risk on any asset e.g.:
💰 Futures
₿ Cyptocurrencies
💵 Forex
📈 Stocks
📉 Fund
🗂️ Indices
Position Sizing
De-risk possible drawdown by calculating a proper position size:
Define your risk percent based on your net value
Freely define your account currency (Base currency)
Trade any asset by the customisable Base/ Quote currency factor
Optional trading fee calculation
Show all information on a customisable data screen
Stop Loss
Minimise trade risk by calculating your stop-loss:
Percent, Value and Delta display from current price
ATR based (Average True Range, modifiable)
Adjustable
Two visual representations on chart
Automatically and real-time calculated on screen
Take Profit
Multiple take-profit levels to ensure not giving back to the market.
Up to 3 take profit levels to define
ATR based (Average True Range, modifiable)
Easily customisable
Two visual representations on chart
Automatically and real-time calculated on screen
Indicator Access: 1 week trial available (DM for access)
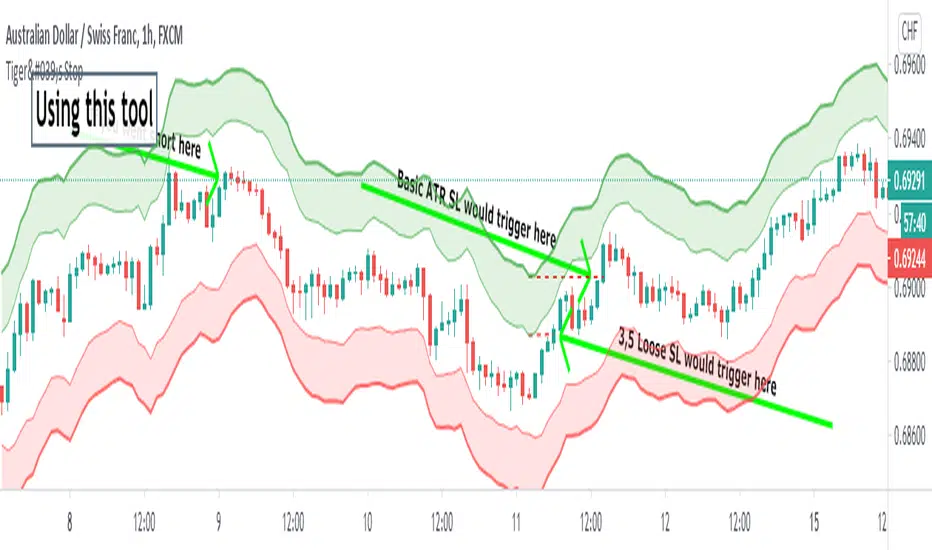
Tiger's Stop - Objective Stoploss SettingTrading is a lot about risk management too. I created this script to help with setting and moving a proper stop-loss. It plots an area that is a result of adding and subtracting both average true range and something I call "false range".
►The Average True Range is calculated as the candle's high-low. If there is a gap, it is added to complete the result.
►My own False Range just candle bodies. It is calculated as an absolute value of (close-open).
Then, Rolling Moving Average is applied on both ATR and False Range to get an idea of how far the price tends to extend out of pure randomness. The resulting value is multiplied by a Multiplier.
The next step is an addition of the values to the higher part of the candle for short or a lower part of the candle for long. I prefer a special calculation instead of using Highs and Lows because it allows for more precise observation and stop-loss set up for less wicky symbols.
►►►Additional Functions
• Smoothing - applies moving average to candles from which range distance is calculated. This can achieve good smoothness but higher values will lead to using outdated price in the SL area calculation.
• Enable/Disable - if you know the direction you are going to trade in, it is good to disable either Long Stop-Loss Area or Short Stop-Loss Area. Just untick it in the settings.
►►►Actual Using
Before using the script to set your stop-loss, check the historical data and find a similar set-up. Is it engulfing you use as a trigger? Find a different one and see how effective the stop-loss based on the ATR*multiplier was. This will help you to optimize Multiplier value. A picture shows such research for a double top. You should find more similar situations to find an optimal value.
Ultimately, the indicator still gives you relatively a lot of freedom with your stop-loss settings (at least, that is with the default settings). You need to decide how loose stop-loss you want to set. Average True Range is the furthermost part which will make for a very large stop-loss, on the other hand, False Range might be triggered by a villainous wick unnecessarily. The choice should depend on the specific symbol you trade and perhaps, you will learn to set stops regardless of the indicator.
A little trick : 1. You can set the loosest stop-loss and set a TradingView alert for where the tightest stop-loss would be. When alerted, you will get the opportunity to reconsider the trade and take a loss if needs be or exit if a candle closes there. 2. Mostly for cryptocurrencies, you can set the tightest stop-loss to protect yourself from sudden spikes. If the price approaches it slowly enough, you can move the stop-loss to the further part of the channel. This is not the same as moving stop-loss indefinitely with hopes of reversal if you plan it from the beginning and a smaller stop is meant to protect you from spikes that are not always predictable and drive to both directions.
►►►Advantages of trailing stop-loss
I usually stick with my original stop-loss instead of moving to break even. If my entry area was functional support once, it may work again and is, therefore, still a good entry zone. But an alternative used to preserve as much of the profit as possible is trailing.
Trailing is setting a specific value in ticks or a calculation of how to move the stop-loss whenever the price moves in your favor. Tiger's Stop can be used this way. Whenever there is a new value as the candle closes and that value is closer to price than your current stop-loss, you can update it. However, if it moves further from your price, don't change the stop-loss. This can be a little tiresome if you do it manually but should be worth the effort.
I usually start trailing only after the price moves significantly in my favor that allowing it to return to the entry price would not make any sense.
►►►Feedback and optimization
The preview chart is chosen entirely at random and the values are not optimized for any specific symbol. If you opt to use it, let me know which values work for you the best, I'll add it to the description when I update it.
Furthermore, let me know if you think any sort of alerts would be useful with my script.
Good luck!
Anti-Volume Stop Loss multi timeframe [LM]Hello Traders,
I would like to introduce you fork of popular indicator Anti-Volume Stop Loss created by Buff Dormeier and cracked here on tradingview by @Rafka so shout out to him. I have tried to crack it myself as well as I'm big fan of Dormeier's work but it's not easy so really big thanks to Rafka
I have refactored original script and have included multi timeframe setting.
As its shown below you can select higher timeframe to track lower one:
Enjoy!

MACD 50x Leveraged Strategy Real Equity Simulation Hello, I wrote this script to merge the two scripts I shared before.
The aim here is to see the real value of the state of the capital as a result of leveraged transactions and to combine both long and short directions.
Scripts :
MACD Long 50x Leverage Strategy :
MACD Short 50x Leverage Strategy :
The parameters have not changed so they are the same as the previous two scripts:
Adding margin: Forbidden or not specified. (Add Margin : No)
Position Size : %1 (0.01) (For each trade)
Stop-Loss : %2 (For each trade)
Long : Crossover(delta,0) (Standard MACD)
Long Exit : Long Stop Level or Short Entry
(In the case of Long Stop, all trades are closed and no positions are opened in short direction.)
Short : Crossunder(delta,0) (Standard MACD)
Short Exit : Short Stop or Long Entry
(In the case of Short Stop, all trades are closed and no positions are opened in the long direction.)
NOTE :
This is a simulation made using standard parameters, showing the state of the balance in very simple rules with leveraged transactions only.
The nice thing here is the direct observation of the results by making modifications on the strategy parameters.
Regards.

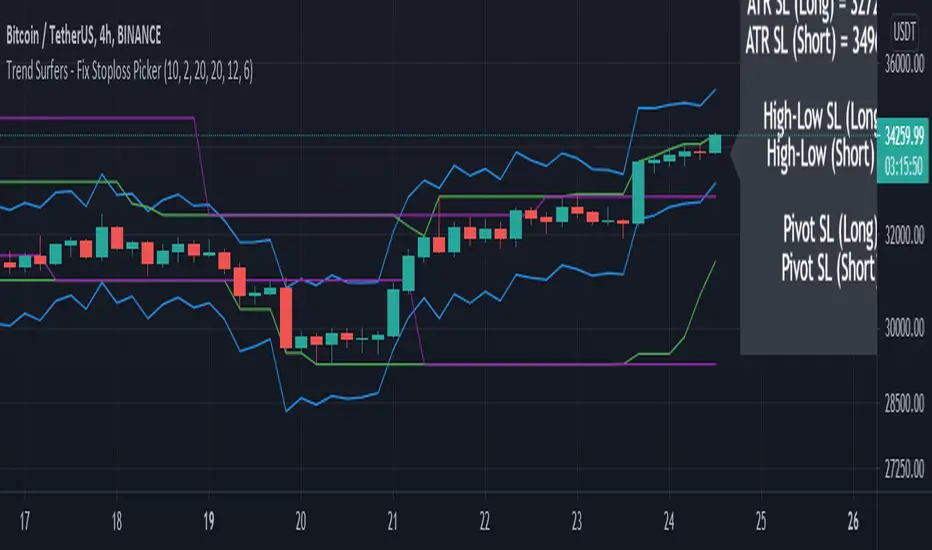
Trend Surfers - Fix Stoploss PickerThis study include 3 types of stop-loss (ATR, High/Low and Pivot point)
This script aimed to help new traders to respect risk management.
Simply select which stop-loss you would like to use in the settings and the suggested stop-loss will be displayed on the chart for Long and Short positions.
Please let me know in the comment if you would like me to add more indicators for the stop-loss in this script.
Hope you like it!
MA, MATR, ChEx | All in One - 4CR CUPIn trade position setup, we always need to determine the market structure and manage the position sizing in a short period of decision time. Indicators such as moving average, initial stop loss and trailing stop loss are always helpful.
This indicator put all these handy tools into a single toolkit, which includes the following price action and risk management indicators:
MA - Moving Average
MATR - Moving Average less Average True Range
ChEx - Chandelier Exit
This script further enhances the setting so that you can easily customize the indicators.
For both the Moving Averages and the Moving Average less Average True Range , you can pick a type of moving average which suits your analysis style from a list of commonly used moving average formulations: namely, EMA , HMA , RMA, SMA and WMA , where EMA is selected as default.
The Moving Average less Average True Range , MATR, is usually applied as a reference to set the initial stop loss whenever opening a new position.
The abbreviation, MATR, is picked, so that this can serve as a handy reminder of a very good trading framework as elaborates as below:
M – Market Structure
A – Area of Value
T – Trigger
R – Risk Management (aka. Exit Strategy)

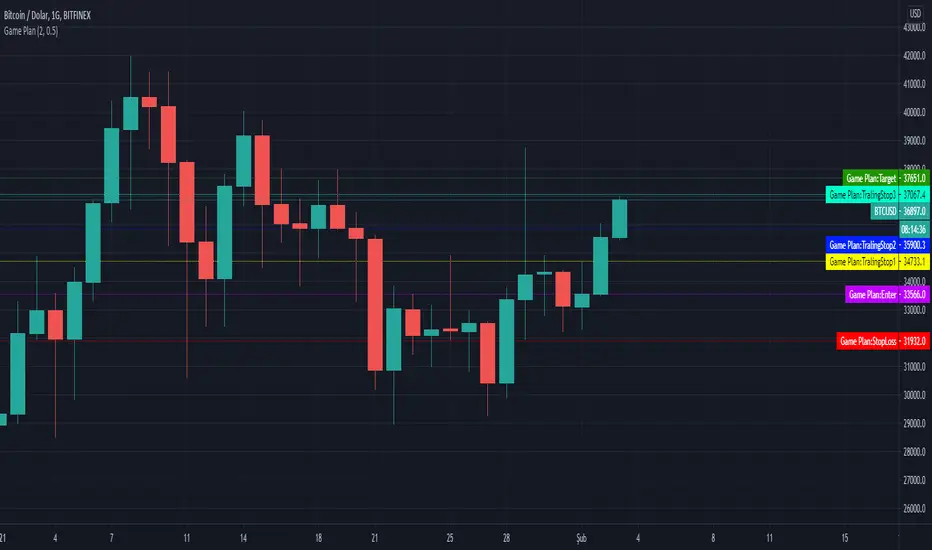
Game PlanAllows to automatically calculate Ali Persembe's, who wrote Teknik Analiz mi Dedin? Hadi canım sende, Game Plan Strategy
What is the Game Plan?
ALi Persembe claims, If you create a game plan for yourself and follow this plan completely, you will increase your profit. He tells that there is nothing to surprise you when your stop loss and target is determined in your game plan. You only need to follow this plan.
How does the indicator work?
It helps you determine your target price and stop point according to the risk ratio you will take on the basis of Atr, regardless of technical analysis.
The minumum risk ratio is calculated as 0.5 Atr according to the Atr 14 period. It automatically sets 2.5 times the risk ratio taken as your target price.
With this game plan, the more goals you reach by trading, the more profitable you will be. By reaching your target at risk ratio, you can determine the stops that follow the
Allows you to move your stoploss level up.
You can change your risk rate in the indicator settings. Minumum risk rate can be 0.5 maximum can be 5.
You can also choose the time you want to calculate your game plan from the indicator settings. Calculation can be made up to 100 bars before.
This indicator helps you to set a target on the basis of ATR, independent of technical analysis.
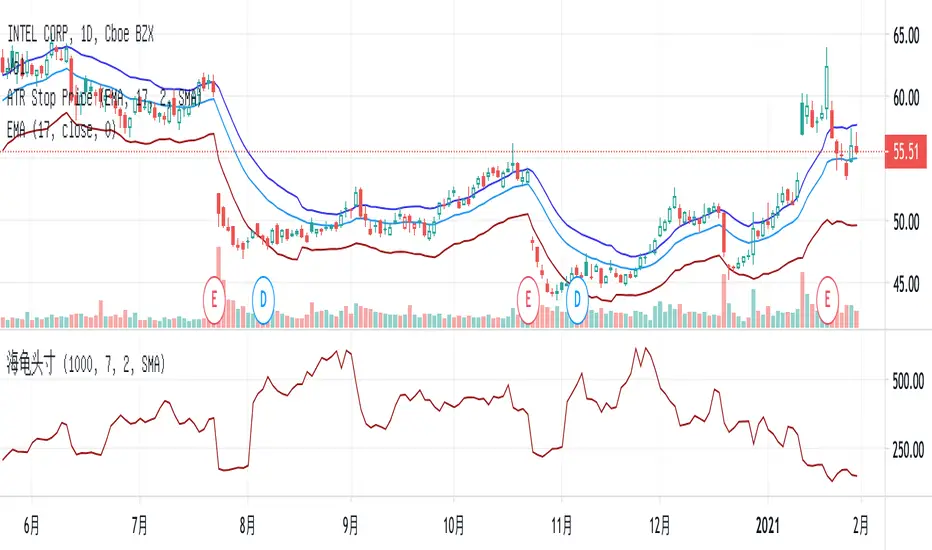
ATR Stop PriceSet stop price and add-position price according to the cost and current ATR.
You may set an alert with the condition when the stock price crossing down the Stop Price.
Example:
stock price: $150
volatility multiple: 2
current ATR: $3
stop price = $150 - $3 * 2 = $144
add-position price = $150 + $3 * 2 / 2 = $153