MrBS:Directional Movement Index [Trend Friend Strategy]This goes with my MrBS:DMI+ indicator. I originally combined them into one, but then you cannot set alerts based on what the ADX and DMI is doing, only strategy alerts, so separate ones have more flexibility and uses.
Indicator Version is found under "MrBS:Directional Movement Index " ()
//// THE IDEA
The majority of profits made in the market come from trending markets. Of course there are strategies that would say otherwise but for the majority of people, THE TREND IS YOUR FRIEND (until the end). The idea is to follow the trend, entering once it has established its self and exiting positions when the trend weakens. This strategy gives a rough idea of the returns produced from following purely the ADX signals. At first Heikin Ashi values were used for the calculation but the results show it's not that effective. The functionality to switch between calculation types has been left in, so we can uses HA candle data to generate signals from while looking at an OHLC chart, if we want to experiment. Due to the way strategies work, we are unable to get reliable results when running the strategy on the HA chart even if we are calculating the signals from the real OHLC values. It is best to always run strategies on standard charts.
When using this strategy, I look for confirmation of the signal based on stochastic (14:3:6) direction, reversal level of stochastic, and divergance, to add confidence and adjust position size accordingly. I am going to try and code some version of that in future updates, if anyone can help or has suggestions please drop me a message.
//// INDICATOR DETAILS
- The default settings are for optimized Daily charts, for 4 hour I would suggest a smoothing of 2.
- The default values used for calculation are the Real OHLC, we can change this to Heikin Ashi in the menu.
- The strategy enters a position when ADX crosses the threshold level, and closes the position when ADX starts to fall.
- There is a signal filter in the form of a 377 period Hull Moving Average, which the price must be above or bellow for long and short positions respectively.
- The strategy closes the position when a cross-under of the ADX and its 4 period EMA. This is an attempt to stay into positions longer as sometimes the ADX will fall for 1 bar and then keep rising, while the overall trend is strong. The downside to this is that we exit trades later and this affects our max drawdown.
Strategy!

Momentum Strategy for cryptos (V7.B.4)Here's a strategy for low time frames (30min suggested) for BTC, based on momentum Analysis using Stochastic RSI
By default the strategy will use the 50% of the specified capital for each trade; if "Gamble Sizing" is enabled, it will add the specified amount of capital (25% by default, until reaching the 100% limit or lower) for the next trade after having detected a loss in the previous trade; if the next trade is successful, the size for the next trade comes back to 50%
• Trend Filter LONG: If the fast exponential moving average is UNDER the slow exponential moving average, it won't open LONG positions
• Trend Filter SHORT: If the fast exponential moving average is ABOVE the slow exponential moving average, it won't open SHORT positions
• Bars delay: the strategy will wait the specified amount of bars before closing the current position; the counter is triggered as soon as the closing trade condition is verified
BY MAKING USE OF THIS STRATEGY, YOU ACKNOWLEDGE AND AGREE THAT: (1) YOU ARE AWARE OF THE RISKS ASSOCIATED WITH TRANSACTIONS OF DIGITAL CURRENCIES AND THEIR DERIVATIVES; (2) YOU SHALL ASSUME ALL RISKS RELATED TO THE USE OF THIS STRATEGY AND TRANSACTIONS OF DIGITAL CURRENCIES AND THEIR DERIVATIVES; AND (3) I SHALL NOT BE LIABLE FOR ANY SUCH RISKS OR ADVERSE OUTCOMES.

Scalping Strategy with SL and TP activation settingsThis strategy can be used on pretty much every timeframe that gives you a satisfying performance and will give you entries with a high probability of a winning trade.
Recommended are lower timeframes, because after all this is a scalping strategy and with that your chart wont be cluttered.
How to use this script?
Currently you can setup your positions SL and TP, because the markets vary in volatility it could improve the performance of the strategy.
You will simply get your signals and can decide to act upon them.
Stop loss: Simply your stop loss order which will trigger when price moves a given % away from your entry.
TP-Activation: When price reaches your % target it will trigger a stop limit order. So if price turns against your position after reaching your target it will close your position in profit and if it runs in your favoured direction it will trigger at a later stage.
Trailing-Offset-%: After reaching your % target it will trigger the TP order with an offset. So if you set your trailing offset to 0.1%, your TP order will be set behind 0.1 %. This can be used to test if the strategy would perform as well
if you leave more room for trades to play out.
Will this script make me profitable?
No strategy is a silver bullet and it depends mostly on you.
Trading is not easy and most people fail, because their risk management skills arent solid or they cant control their emotions.
This script will give you statistically often good entries, so even if you hit a losing streak your SL will protect you from losing more than necessary until you get a winning streak.
Patience and consistency is key to be profitable in the long run.
Does the script repaint?
Although you will get a notification when setting an alarm that the indicator may repaint, no security function is used and the signals will stay on the chart, because the signal is calculated based on the last candle close and will trigger with the next candle.
I am still looking into why that notification pops up.
You are free to try the indicator for a limited time to be sure.
My experience with the strategy
The overall statistical advantage is great. The strategy can be used simply as it is, but becomes better if you already have some experience with trading. Sometimes it will give you a good entry, reaches your target and the price still goes in your preferred direction. So your trading returns and experience could be improved with confluence, but it is totally fine as it is and if used right will help you get going.
Disclaimer: This is no financial advice. This is a tool and I am not responsible for your actions.
If you are interested in the indicator feel free to dm me on TradingView.

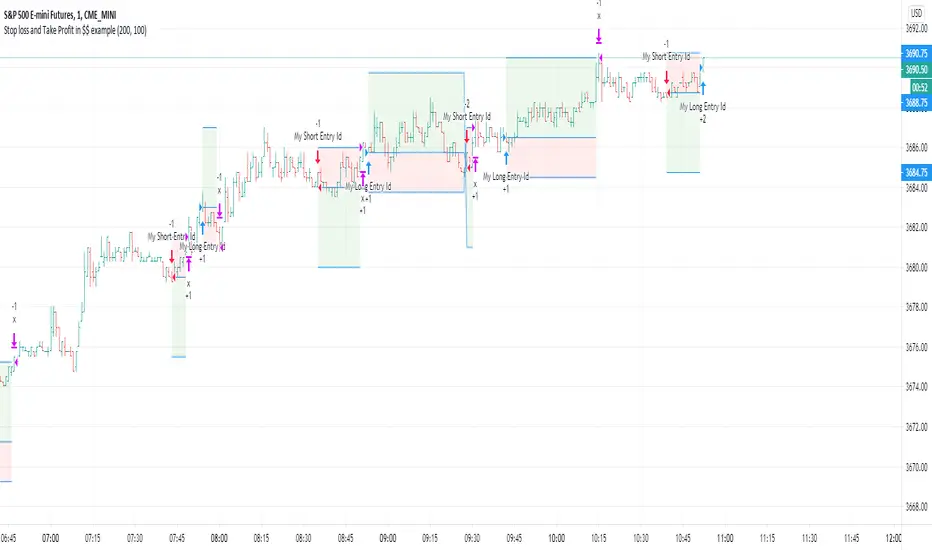
Stop loss and Take Profit in $$ exampleThis is a simple exit example in $$ (symbol's currency) for educational purpose .
BB+K strategyApplying Bollinger Bands and K-bar strategies
Suitable for long time periods
Suitable for forex trading, when the forex deviation is too large, the Fed will intervene and thus correct
Strategy: Enter when the price hits the upper or lower BB track and there is a reversal of the strong signal, and exit when it hits the other track and there is a reversal signal.

Escaping of Rate from Avarage By Mustafa OZVER StrategyI simulated the EoRfA indicator with the gold price
For details about the indicator, visit my profile on tradingview
For Simulation, with default settings, we order
if Eorfa > 1 and change(eorfa) < 0
sell
if Eorfa < -1 and change(eorfa) > 0
buy
And we got
- 2.49 % profit
- 74 % profittable order from all
But only this value can not guarantee good results for trading. BE CAREFUL

Vegas Tunnel strategyApply Vegas Tunnel,
Use EMA144 169 as medium-term trend support
Also use EMA 576 676 and 4 multiples of 144 and 169 as long-term support and trend direction
Also increase EMA 36 43 as a short-term trend support
Suitable for stocks, indices, commodities
The applicable time scale can back-test the usability of the strategy by itself, and select the most applicable target
Introduction to current trading strategy:
According to the trend, the price will enter the market when it touches the support of each stage. When it touches the bollinger bands, it is Squeeze. Hold until it leaves the bollinger bands
But the trading strategy can be more optimized, see the code for details

MACD 50x Leveraged Short Strategy with Real Equity
Hello there ,
Short version of the Macd Long strategy.
MACD Long strategy:
Adding margin: Forbidden or not specified. (Add Margin : No)
Position size: (for each trade) 1%
Stop-Loss: (2% Above Entry Level)
Long: macd crossunder
Exit: macd crossover
Or ofc touching the stop-Loss value as predicted.
These strategies are just examples.
The goal is to observe true equity and equity change.
Warning: This strategy simulation is for Short direction only.
Regards.

MACD Strategy with trailing ATR stopThis is a trend based strategy that uses EMA and SMA intersection for determining the direction of the trend and MACD for the entry signal. At the same time, the strategy uses ATR, which is working as a trailing stop.
The strategy entry will work when the Trend ribbon will turn green and MACD line will crossover the signal line. This strategy also takes into account the pyramiding and allows to enter the second time if the signal will repeat itself.
There are 3 exit points. The first 10% of the position will be closed when the price will increase by 1%. The second portion of 50% will be closed when the price reaches 5% Take profit target. The remaining 40 % of the position will wait for the exit signal which will occur when the price closes below the ATR line.
The strategy is using a fixed amount in dollars, each time the entry occurs the strategy will enter with 100$ in the order.
The strategy can be applied to other crypto assets. However, they will require input changes.
Best of luck with your trading.

RSI7 + DCA Long StrategyThe strategy will start new deal when RSI is less than specified value.
The start is not that important though, the real value of this strategy the very flexible DCA settings.

MOM+RSI StrategyThis is a momentum based strategy which generates signals when the price moves with momentum in either direction. This strategy works well on liquid stocks. Its not necessary to close the trade as soon as the close signal is generated and one can wait for the price to move in the direction as indicated by the prior signal unless price starts to go in the opposite direction. The best set up for a trader is his/her own set up and hence it is recommended to use this strategy with your set up/research.

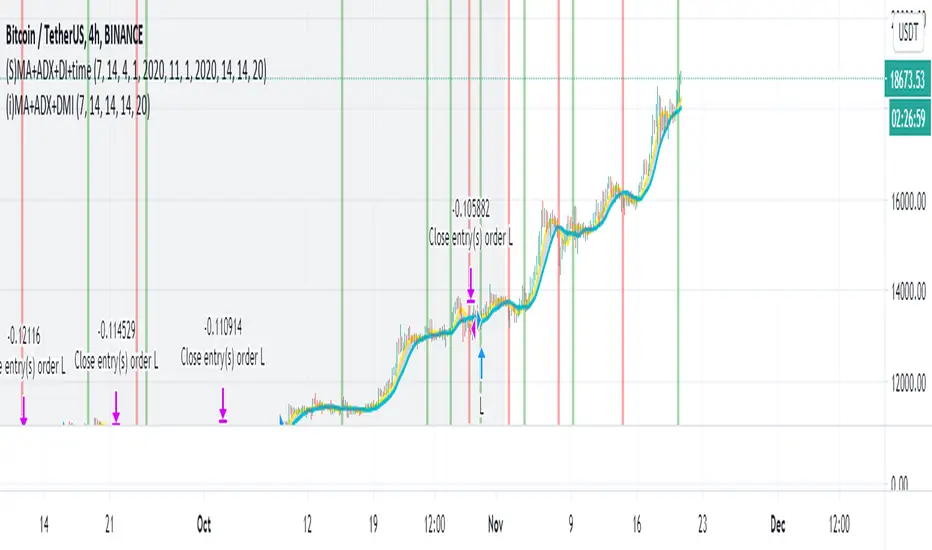
Simple Moving Average + ADX + DMI + Time Range Test
Use long and short moving average to look for a potential price in/out. (default as 14 and 7, bases on the history experience)
ADX and DMI to prevent the small volatility and tangling MA.
This script allows you to set the beginning & end time to test the bullish & bearish market.
If you want an indicator version, here is it.
Thanks.
BUY/SELL_Strategy_Paydar_V.07BUY/SELL_Strategy_Paydar_V.07
Hello dear friends
This system can be considered as a signal system.
*** This system just Suggests you for points. ***
My suggestion is not to use this system alone and conclude about entry and exit points according to charts, news, market fluctuations and trend direction.
The agenda of this system is as follows:
- Buy signal means:
Time to enter the trade / buy / take a long position and ...
- Sell signal means:
Time to leave the trade / sell / exit the long position
* I suggest you use this system in trading for cryptocurrency and especially for bitcoin.
* My suggested time frame is 1 minute, because during this time and according to the settings of this system, a better result was obtained for me.
* I suggest using this system first in spot trading and then in future trading.
System function:
This system is based on the analysis of 74 different systems, which are:
> 19 indicators and oscillators separately which include:
MACD, RSI, STOCHASTIC, STOCHASTIC RSI, BOLLINGER BANDs, PARABOLIC SAR, VOLATILITY and ...
(All of which can be used on the Trading View site as a public domain and open source)
> 11 cases of previous oscillators and indicators in combination
(All of which can be used in public view and open source on the Trading View site)
> 27 items MA, EMA, VMA, WM, MSM, etc. in combination and separately
> 9 lines and areas of automatic support and resistance
(All of which can be used in public view and open source on the Trading View site)
> 8 different strategies, all of which can be used in public view and open source on the Trading View site
Points.
*** All indicators, oscillators, lines and areas of automatic support and resistance, strategies, etc. can be used as a public domain and open source on the Trading View site. ***
Comment on using this system as well as how to use it.
_______________________________________________________________________________
* In this system, the main and basic indicators and oscillators are used, all of which are in the public view and open source site in Trading View *
I am very grateful and very loyal to Trading View, which built all the indicators, oscillators and strategies, because I used them to build this strategy system.
_______________________________________________________________________________
Be successful and profitable.

Profitable Strategy Forex 80 by LukasHello all,
Herewith I publish my Forex strategy, it's works for major pairs only.
I ran more than a thousand test to get this result! :))
The strategy have more than 8 Buy and Sell signal condition with 2 core signal provider.
You can turn on/off each 7 signal and find the most profitable combination for each pairs.
If you trade on lower timeframe, you can turn on "Higher Timeframe MA".
It's also will trigger buy/sell when breakout from monthly high / low when entry condition meets.
You can set weekly or monthly.
I work on 4H timeframe when develop the script, so best use is 4H.
Basically i want to make reliable strategy that can automate trade
without the need to check chart every minutes! Hahha
So i think higher time frame is the best time to start,
and I found 4H chart on Forex have more clear structure and volatility .
I make the signal visible, it consist of 3 line represent The Pairs, Base and Counter pairs,
basically when Green line on top it means Base currency is strong, vice versa.
You may share your setting in the comment section, so others can try it :)
For this result I turn on Signal A,C,D,E,F
Signal A and B use special RSI
Signal C and D use special MACD
Signal E use RSI
Signal F use EMA and DEMA combination
In my opinion each pairs has unique character, some of them move faster than others.
So, adjust the setting for each pairs will benefit you more.
For further develop of this strategy, please give me feedback! :)

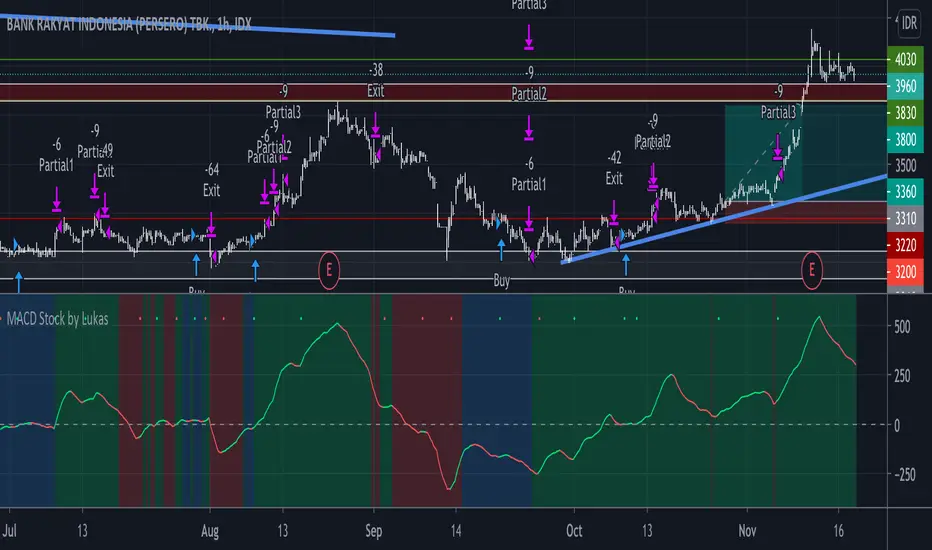
Strategy MACD Stock by LukasHello guys, long time no update.
This time I make strategy for Stock,
The strategy is for LONG only because where I live I can not Short Stock (Indonesia :) )
Basically I combine MACD, DEMA, RSI and EMA.
I try 1D, 4H, 1H and it's perfect for me, when you play higher timeframe try to turn "ON" "Filter" on the menu setting.
RED GREEN line is represent MACD
YELLOW ORANGE line represent Bull and Bear, useful when you play on high timeframe.
There is also setting for Stop Loss and Take Profit level.
Please give it try and give me some feedback.
Hope its useful,
Stay safe everyone :)
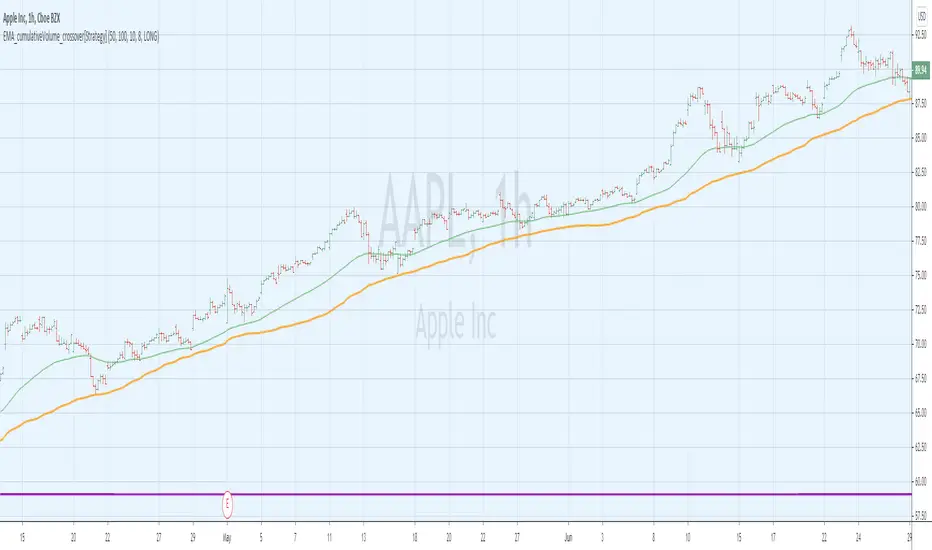
EMA_cumulativeVolume_crossover[Strategy]This strategy is back test for EMA_cumulativeVolume_crossover
BUY
When ema50 crossover cumulative volume of 100 period
Exit
When ema50 cross down cumulative volume of 100 period
Partial Exit
for the partial profit I have used stopLoss value , but up side. When price is above partial profit and crossing down EMA 50 , exit 1/3 position
Please note when you select this setting, you see spike number of trades, that is because you closing partial number of trades. which increases the winning rate but reduces the total net profit.
Stop Loss
Defaulted to 8%
Added parameter to take LONG or SHORT trades ... on SHORT side not very good results ... you can review it and provide feedback how to improve the performance.
Short Selling
Reverse above BUY conditions
I have tested LONG trades on SPY , QQQ and AAPL on 1 Hour and 30 mins timeframes. for AAPL on DAY timeframe it shows crazy results :-)
Note
For the use of educational purposes only.
Stepped trailing strategy exampleThis is a stepped trailing exit example for educational purpose .
Short brief.
There are 1 stop loss and 3 profit levels.
When first tp is reached we move stop loss to break-even.
When second tp is reached we move stop loss to first tp.
When third tp is reached we exit by profit.

Pivot STRTGY_V1This Strategy operates on a Daily Time Frame and decisions are made based on monthly Pivot Points.
Choosing different time frames and pivot periods influences trading decisions and is not recommended
The script contains the following calculations:
-Pivot Points,
-Short and long term moving averages (sma, ema, getting),
-Bollinger bands,
-Trend following
The strategy aims to keep the asset profitable for as long as possible by predicting the turning points of the price.
Therefore, it is not suitable for day-trade.
Average holding period of assets is 15-20 days.
The script makes decisions to buy or sell when the price is above or below the determined averages and pivot points.
In this way, it follows the trend and aims for maximum profit.
It continuously makes calculations for the distortion conditions of the trend and generates orders to exit the position when the necessary conditions are met to stop the loss.

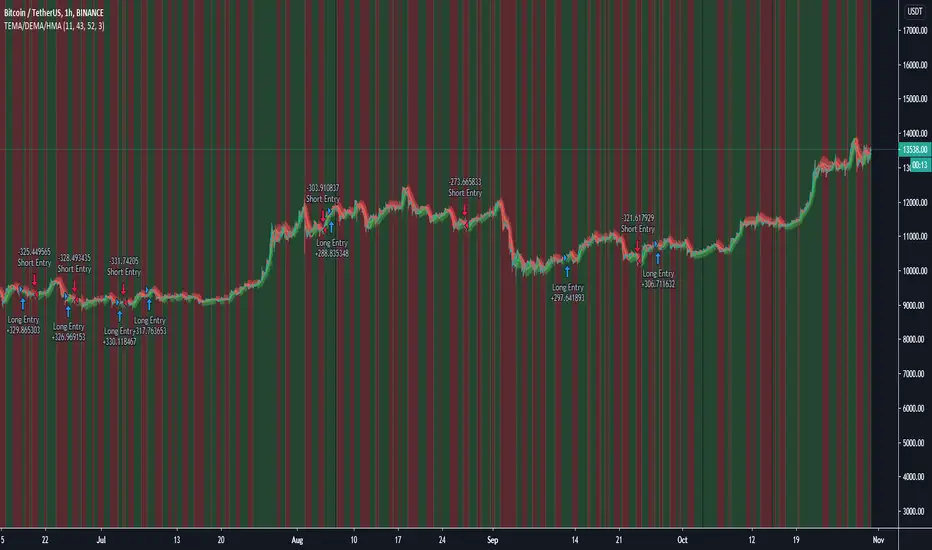
TEMA/DEMA/HMA StrategyThe TEMA/DEMA/HMA strategy is a basic trend follower looking for when the TEMA crosses above the DEMA as a buy signal and the opposite for the sell.
The HMA is used as a longer more Dynamic MA to confirm the wider trend to filter out bad trades.
This is a basic idea that can be expanded on using different indicator types to either add signals or filter out more bad signals!
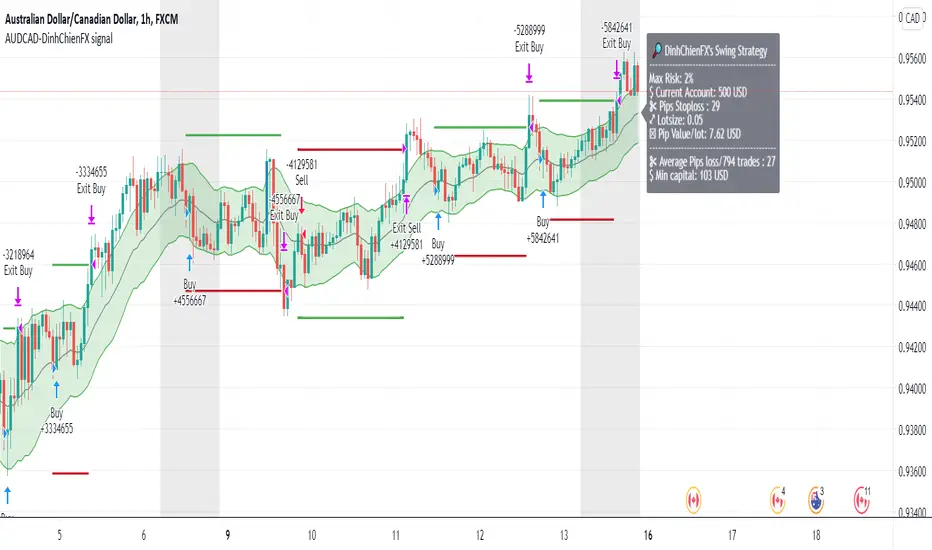
AUDCAD - DinhChienFX Corner signal- Long signal is comfirmed when the Candle's close crossover the Keltner Channel:
- Short's signal confirms when Candle' close crossunder Lower Keltner.
- The formule Stoploss and Take profit
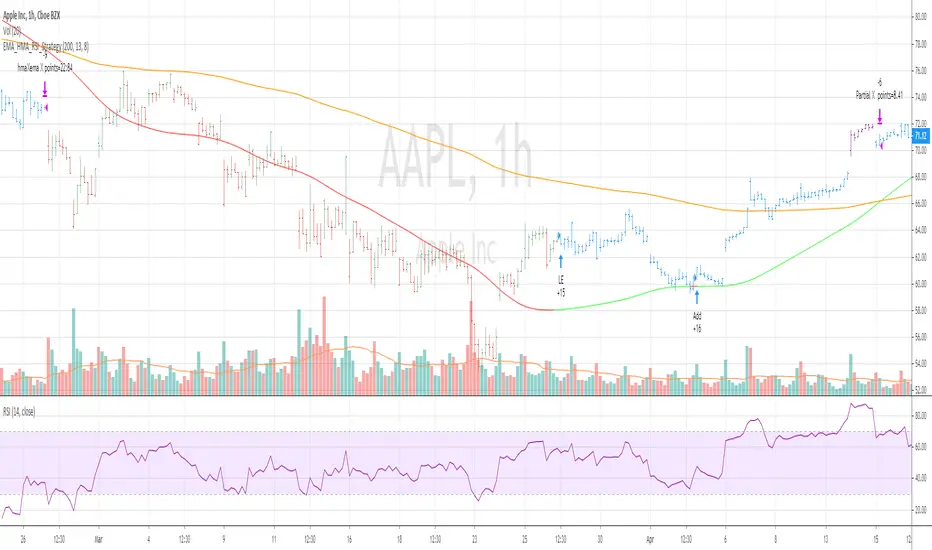
EMA_HMA_RSI_StrategyThis strategy BUYS when HMA is below EMA (default setting is 200) and HMA turning to green and RSI 13 is below 70
Adds to existing position when current price is below BUY price and RSI crossing above 30 or 40
Exits the long position when HMA crosses down EMA
when you select Take Profit setting , partial profits are taken when current price > BUY price and RSI 13 crossing down 80
Bar color changes to purple when RSI13 is above 80 (if only in Long position exists)
Tested for SPY QQQ AAPL on hourly and 30 mins chart
Warning : For educational purposes only
My Version of No-Nonsense Forex (NNFX) Strategy - MQAHNAF SignalThis is my version of the No-Nonsense Forex (NNFX) Strategy, namely MQAHNAF Signal.
This strategy shows you only the entry signal with 1.5 x ATR for Stop Loss and 1 x ATR for Taking Profit.
This strategy uses 5 kinds of indicators:
1. Average True Range for SL and TP placement, and also for pullback range;
2. Kijunsen for Baseline;
3. SSL Channel for 1st Confirmation;
4. Absolute Strength Histogram for 2nd Confirmation;
5. Waddah Attar Explosion for Volume/Volatility.
This strategy implements the "Bridge Too Far" strategy.
This strategy also implements the "Pullback" strategy, with some modification: 1.5 x ATR from Kijunsen
This strategy doesn't use the exit indicator because this strategy intended only to shows you the entry signal, but you can use the SSL Channel (the yellow line) for the exit indicator.
This strategy also doesn't use the "Scale-Out" and the "Trailing Stop" strategy because again, this strategy only shows you the entry signal.
On the contrary, this strategy works best on the 4H timeframe, different from what VP emphasizes in his videos about the daily timeframe.
I hope you like this strategy and don't forget to thumb this up!
Also, don't forget to follow me for the update and for my other strategy/indicator/trade ideas!
Thank you for your attention!
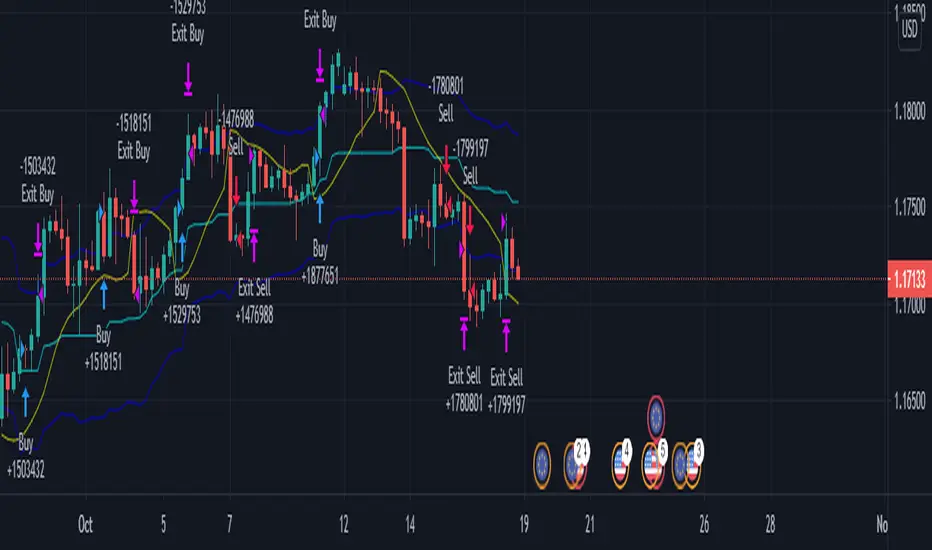
VWAP + Fibo Dev Extensions StrategyBased on my VWAP + Fibo deviations indicator, I tested some strategies to see if the indicator can be profitable; and I got it !
This strategy uses:
H1 timeframe
Weekly VWAP
+1.618 / +2.618 / -1.618 / -2.618 Deviations Extensions to create 2 bands
The value of the deviation
First, the 2 bands are plotted : +1.618/+2.618 painted in red and -1.618/-2.618 painted in lime.
Then, we wait for the deviation value to reach at least 150 (see thumbnail) to avoid littles moves when the gaps between bands are too short.
Entry long position :
first candle must crossunder the -1.618 level and low have to stay over the -2.618
low of the second one must stay in the lime band
enter the third one if the deviation value is over limit (150)
Exit long position :
TP : when a high crossover VWAP
SL : when a low crossunder -2.618
Entry short position :
first candle must crossover the +1.618 level and high have to stay under the +2.618
high of the second one must stay in the red band
enter the third one if the deviation value is over limit (150)
Exit short position :
TP : when a low crossunder VWAP
SL : when a high crossover +2.618
Notes :
this strategy uses pyramiding (5), be careful and calculate your risk management
the comission value is set to 0.08% to include slippages when entering a trade because of market orders
This strategy is not an advice to invest, make your own decisions.
