Money Flow LineWhat is this? The Money Flow Line (MFL) indicator is at its core a more even-tempered version of the Price-Volume-Trend (PVT). The primary difference is the usage of `hlc3` ((high + low + close) / 3) rather than `close` to use the "typical price" that it critical to the calculation of the Money Flow Index (MFI). Other similar indicators include the Accumulation Distribution Line (ADL) and the On Balance Volume (OBV) indicators. The purpose of all of these indicators is to attempt to measure the strength of the money flow by combining price and volume into a rolling measurement that can be compared over time to look for confirmations and divergences.
The indicator also includes an optional averaging (smoothing) line that can be enabled in the display settings. Enabling this smoothing line with a desired period allows for simpler trend comparisons and also allows the user to view how far the line has diverged from the mean. This creates an indicator very similar to Elder's Force Index (EFI), which is also a `close * volume` style indicator.
Why is this important? After an extreme movement or volume spike the MFI will "snap back" sharply as that bar eventually exits the set period. This produces a result that is meaningless and skews the indicator away from the market structure. Because of this behavior, range clamping, and the loss of comparative history I prefer to shy away from oscillator style indicators. The Money Flow Line instead gives you all of the history so you may compare and see the broader trend without sharp snaps in history based on an arbitrary period setting.
Why is this better? This produces a no-lag indicator that isn't subject to the harsh skewing produced by they Money Flow Index's period calculation. It doesn't lose history like MFI or EFI, is clear about the trend direction, and prefers a "typical price" (averaging the entire range of each bar) rather than whatever happens to be the closing price for a given bar.
How can I use it? The indicator is attempting to measure supply and demand in the markets. No indicator is perfect, but we can use all of the information we have available to make our best predictions. There are only 3 pieces of data the market gives us:
1. Price (action)
2. Volume
3. Time
The Money Flow Line combines all of these data points into a readable rolling data set that attempts to show subtle balance of power shifts based on changes in volume and "smart money" (or "big money") stepping in and out of the picture. Much like PVT, we look for the same things:
- Trend Identification: an up or down trend appears in the MFL
- Confirmations: the MFL agrees with price action in direction and magnitude
- Divergence: the MFL disagrees with price action, indicating a reversal may be coming soon
When applying the smoothing line we can also look for similar things we would with EFI. The primary case would be to look for the MFL to jump very far away from the mean (a high magnitude movement) which indicates that price may be reverting towards the mean soon (a "mean reversion"). On the other hand, it may indicate strength in the current price direction. All of these predictions depend heavily on price action and market structure. Good luck!
Supply_and_demand

[VC] Box Chart Histogram V1.0V.C Box Chart Histogram draws the cumulative delta that correlates to another indicator named ''V.C Box Chart Index'' .
(In other words, ''V.C Box Chart Histogram'' & ''V.C Box Chart Index'' are correlated.)
V.C Box Chart Histogram draws the cumulative delta as histogram based on ''V.C Box Chart Index''. Combining these two indicators empowers you to see the cumulative demand & supply / cumulative buying & selling quantity of each box.
You can also switch from cumulative delta mode to cumulative delta % from input settings. See the difference between simple delta & delta % mode from these examples.
Simple Delta Mode (Cumulative Demand & Supply)
In the above example, green & red boxes on the histogram show the cumulative delta of each box from the main chart. In simple words, these boxes show the cumulative net demand & supply of the corresponding box from the main chart. In this example, Big green boxes indicate demand is increasing, whereas small red boxes indicate that supply is decreasing.
Delta % Mode (Cumulative Volume-Weighted Demand & Supply)
Similar to the simple delta mode, in the above example, blue & red boxes on the histogram show the cumulative delta % of each box from the main chart. In simple words, these boxes show the cumulative & volume-weighted demand & supply of the corresponding box from the main chart.
In this example, Big blue boxes indicate that demand is increasing, whereas small red boxes indicate that supply is decreasing.
V.C Box Chart Histogram Properties & Settings
Inputs
Choose Your Source:
Allow you to switch from simple delta to delta %
Choose color of the box on simple delta:
Allow you to change the color of the box
Choose color of the box on delta %:
Allow you to change the color of the box
Style
Positive & Negative Simple Delta:
Allow you to see the simple delta in the column format.
Positive & Negative Delta %:
Allow you to see the delta % in the column format.
Boxes:
Allow you to show/hide the boxes
NOTE: You can also see both delta formats in dual view mode. (in column & box at the same time to have a more precise & detailed look)
See Below Example
Disclaimer Note:
V.C Box Chart Histogram is not a Buy/Sell signal based indicator or a holy grail trading system. It is purely a leading indicator that can help you to analyse demand & supply and buying & selling forces of the market in a smart & effortless way. Before applying this indicator to your analysis, you should have some basic knowledge about volume, delta, & supply & demand. Some basic understanding of Sir Richerd Wyckoff's Theory can also be helpful.

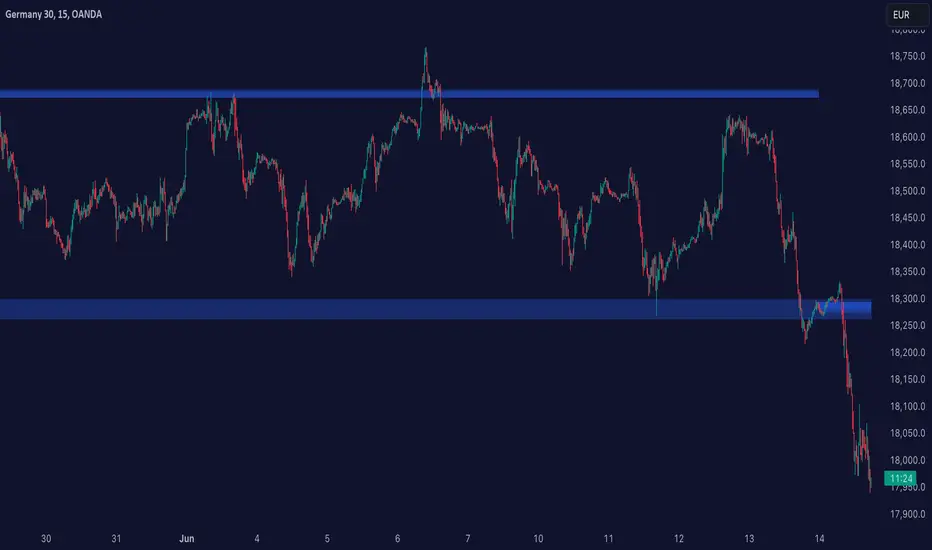
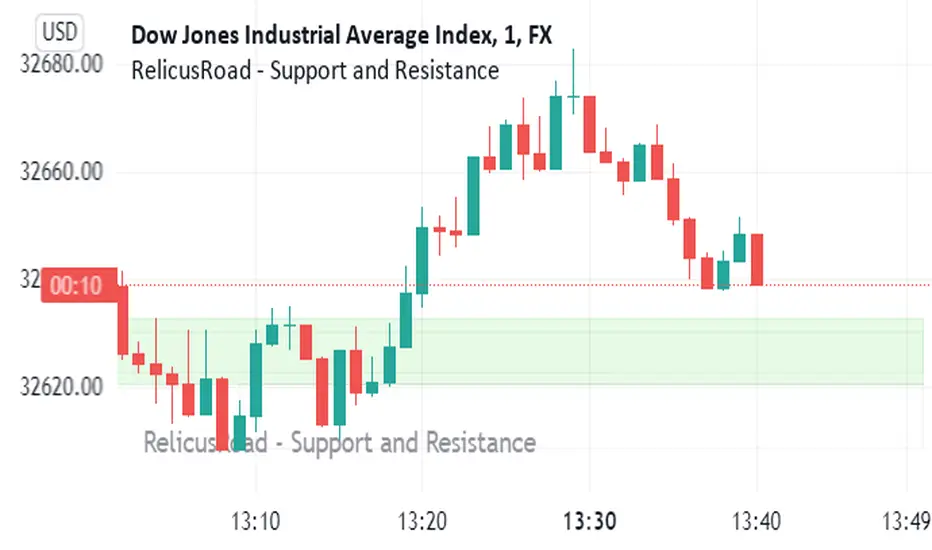
RelicusRoad - Support and ResistanceWe bring you dynamically created fundamental support and resistance analysis required for any instrument a trader trades.
Support & Resistance Concept
The concepts of trading level support and resistance are undoubtedly two of the most highly discussed attributes of technical analysis . As part of analyzing chart patterns, these terms are used by traders to refer to price levels on charts that tend to act as barriers, preventing the price of an asset from getting pushed in a certain direction.
At first, the explanation and idea behind identifying these levels seem easy, but as you'll find out, support and resistance can come in various forms, and the concept is more difficult to master than it first appears, this is where RelicusRoad - Support and Resistance comes in and draws them for you.
Technical analysts use support and resistance levels to identify price points on a chart where the probabilities favor a pause or reversal of a prevailing trend.
Support occurs where a downtrend is expected to pause due to a concentration of demand.
Resistance occurs where an uptrend is expected to pause temporarily, due to a concentration of supply.
Market psychology plays a major role as traders and investors remember the past and react to changing conditions to anticipate future market movement.
Support and resistance areas can be identified on charts using trendlines and moving averages.
Imbalance Finder By DrewThis indicator is created to find the imbalances when a market exchange receives too many of one kind of order—buy, sell, limit—and not enough of the order's counterpoint. If you know how to trade the imbalances, this indicator can help you by find imbalances automatically.

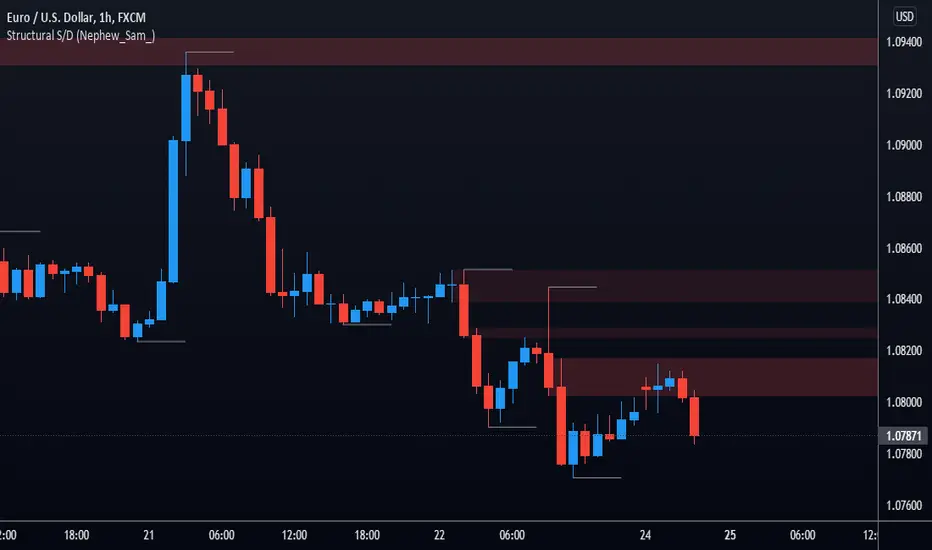
Structural S/D (Nephew_Sam_)This is a supply and demand indicator based on structural pivot points.
Everytime a pivot high/low is broken, it will plot the recent wicks of the candle that caused the break of pivot stucture and the one before it.
This is know as a 'stall' before an explosive move.
Indicator Settings:
Filled type - is zone filled once price closes away from it or if wick fills it
Delete filled - delete boxes once price has filled it
Pivots - similar to fractal points, each pivot is the highest/lowest point in a group of x left and x right bars
Box visuals - extend, colors, style etc
Supply, Demand and Equilibrium Zones, Interactive by DGTSupply, Demand and Equilibrium Zones, Interactive
The law of supply and demand is a theory that explains the interaction between the sellers of an asset and the buyers for that asset. The theory defines the relationship between the price of a given asset and the willingness of traders to either buy or sell it. Generally, as price increases, traders are willing to supply more and demand less and vice versa when the price falls.
Simply said, the higher the price, the lower the quantity demanded, and from the seller's perspective, the higher the price, the higher the quantity supplied
Equilibrium zones are the price levels where both selling and buying trading activity is high, both sellers and buyres are interested at that price levels. More correctly, there is a great deal of activity on both the buy and sell side and the market stays at that price level for a great deal of time. Supply and demand are balanced or in equilibrium
Supply and Demand Shifts may occur when institutional investors step in, a change in both price and quantity demanded from one point to another
This experimental study attempts to presend Supply, Demand and Equilibrium Zones by measuring traded volume at all price levels on the market over a specified time period. Then the result is plotted as horizontal zones on the finacial isntrumnet's chart that highlights supply, demand and equilibrium zones at specific price levels
It is important for supply, demand and equilibrium zones to understand that time is always a dimension on charts. The quantity demanded or supplied, found along the horizontal axis, is always measured in traded volume of the asset over a given time interval. Longer or shorter time intervals can influence the levels of supply, demand and equilibrium zones
The study is made interactive, which requires the users to select two points on the chart, by simply clicking on the chart. In case the user would like to view different range then just dragging the vertical lines will be enough
By increasing/decreasing values for supply and demand zones or equilibrium zones, you will either get the zones enlarged or detect supply and demand shifts or other equilibrium zones
It is adviced to use this study in conjuction with a Volume Profile study, such as Volume-Profile-and-Volume-Indicator , Volume-Profile-Custom-Range , Anchored-Volume-Profile , and Price-Action-Support-Resistance , where volume profiles presents trading activities at specific price levels and Supply and Demand Zones can be treated as Value Area (they are not exact same but similar) for Volume Profiles
Disclaimer: Trading success is all about following your trading strategy and the indicators should fit within your trading strategy, and not to be traded upon solely
The script is for informational and educational purposes only. Use of the script does not constitutes professional and/or financial advice. You alone the sole responsibility of evaluating the script output and risks associated with the use of the script. In exchange for using the script, you agree not to hold dgtrd TradingView user liable for any possible claim for damages arising from any decision you make based on use of the script

Volume Profile - Custom Range, Interactive by DGTVolume Profile - Custom Range aims to display trading activity at specific price levels over user defined Custom Range of trading. Start and End Time is Interactive , they can be adjusted simply by clicking on the chart and drag the lines to specify the desired custom range. Same as is with the drawing tools available in TV
Please note, while switching between timeframes or switching to different instruments with different exchange timezones you may need to adjust the locations in case the plotting is not displied
Volume Profile - Custom Range is plotted as two horizontal histograms on the finacial isntrumnet's chart that highlights the trader's common interest at specific price levels as well as aims to reveal dominant party of who is in control, bulls or bears
You are also invated to galnce at Volume-Profile-and-Volume-Indicator , Anchored-Volume-Profile , and Price Action-Support-Resistance for different perspective of Volume Profiles
Special thanks to everyone who commented and presented their valuable suggestions
Disclaimer: Trading success is all about following your trading strategy and the indicators should fit within your trading strategy, and not to be traded upon solely
The script is for informational and educational purposes only. Use of the script does not constitutes professional and/or financial advice. You alone the sole responsibility of evaluating the script output and risks associated with the use of the script. In exchange for using the script, you agree not to hold dgtrd TradingView user liable for any possible claim for damages arising from any decision you make based on use of the script

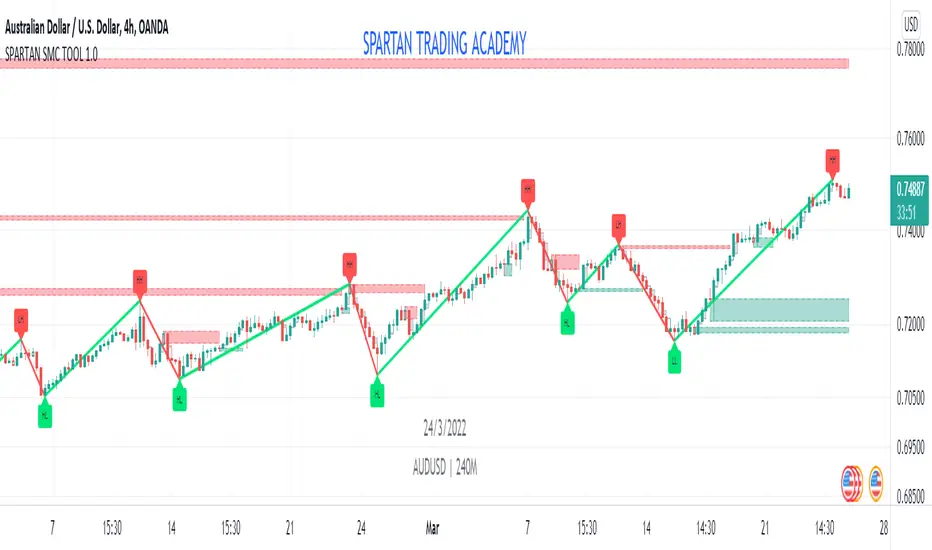
SPARTAN SMC TOOL 1.0SPARTAN SMC TOOL 1.0
1. Order Block
2.Double Zig Zag
3. Imbalance
//--------------------- details about smc tool -----------------------//
Order Block:
I) The Order Blocks are NOT DETECTED in REAL TIME!
- A Bullish Order Block is the last red candle BEFORE a subsequent series of green candle
- A Bearish Order Block is the last green candle BEFORE a subsequent series of red candles
The required length of the series is defined by the parameter "Relevant Periods to identify OB" (by default it is set to 5).
This means that the earliest an Order Block can be identified with these settings is 5 candles AFTER it has occurred!
As a result of this....
II) The identified Order Blocks (and therefore also the Alerts) are not BUY or SELL signals!
As I have mentioned in the description before, these identified Order Blocks rather show "Areas of Interest" on the chart where there is an increased probability that the price will revisit these levels at one point in the future (but no guarantee of course!).
III) ....and YES, it REPAINTS....by definition!
A "repainting" indicator is changing signals in the past. As according to the defined logic an Order Block can only be identified AFTER future conditions are met, it will of course "repaint" the signal into the chart only after at least the relevant period has elapsed - the same applies to the Alerts. If you intend to complain about this "repainting", then I am sorry to say that you did not understand what this is used for and I advise you not to use this indicator. I would then advise you to first read a bit about Institutional Order Flow.
IV) This is not the "Perfect Indicator".....
When you look at the historical performance on the chart, it looks like that the Indicator ALWAYS called a perfect entry! But due to the definition of the logic and due to the delay/repainting, this is misleading if you do not understand how it is supposed to work. So please make sure that you REALLY understand it before you use it - I tried to be very clear in my explanations.
Double Zig Zag:
Here Double Zig Zag with HHLL script is with you. it calculates 2 Zig Zag simultaneously and draws them, and also it calculates and puts Higher High, Lower Low, Higher Low, Lower High labels. All these are done dynamically, it means last HH/HL/LL/LH can change. if price continues to go up then HL can turn to LL or if price continues to go down then LH can turn to HH. This script can be used for different purposes such trend analysis, support/resistance levels, breakouts etc.
I tried to make many things optional:
You can set Periods for Zig Zags as you wish
You can set different colors for both Zig Zag Up/Down lines
You have option to show both Zig Zag , one of them or none them
You have option to show both HHLL, one of them or none them
You can set Zig Zag 1 line style as Dashed or Dotted
You can set Line Widths for Zig Zags
Imbalance and Fair Value Gaps
Imbalance and Fair Value Gaps are created when Price moves away in one direction at speed / impulsively.
A gap is created between the first and third candle wick which creates the Imbalance / Fair Value Gap and is sometimes a potential area of where the market could return
making the area a good place to look to trade from or to aim for.
This Imbalance / Fair Value Gap indicator will change the color of the candles where these gaps have been created and also created a Line at the start of the Gap.
Although the candle color will not change, the lines however will be removed when price has closed the Gap making it easier to look for the untouched Imbalance / Fair Value Gaps when opening the charts or changing between timeframes and allowing you to create your potential areas to trade from or areas to target.
You are also able to add a shape on the gaps and change style of lines created along with the width and length.
From the testing I have carried out whilst trading, using more than a 500 bar look back seems to cause issue so this is the max you can set the candle look back.
There are other Imbalance / Fair Value Gap indicators but I just wanted to create one with a few additional options which suited my trading style.
Hope you find it useful and happy safe trading...
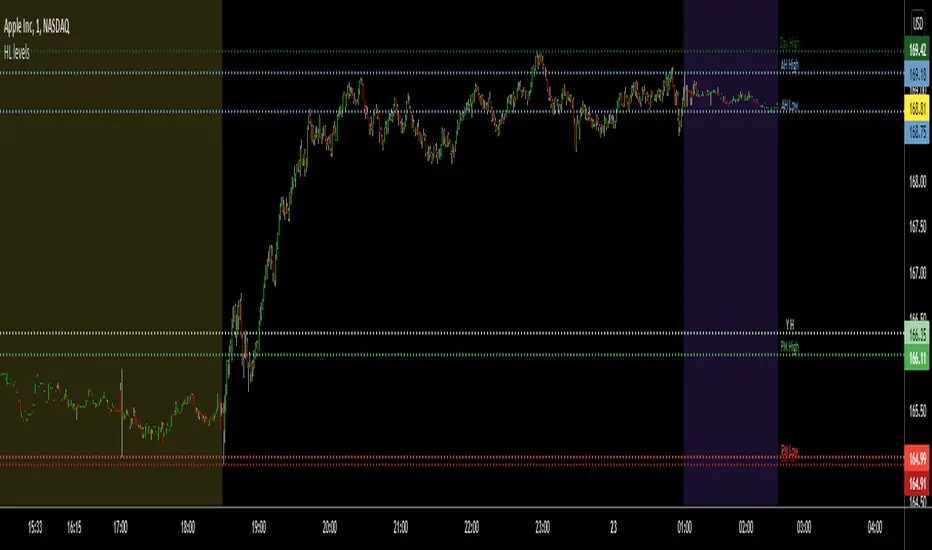
Pre-MKT H/Ls, YDH/Ls, TH/Ls (FX/Cryptos/Stocks)This is really a very useful indicator for price action traders who are watching the key areas for potentially high probable trade setups. This script can be applied to see the pre-market highs and lows for stocks, also today's high/lows, yesterday's highs/lows and after hours highs/lows too.
You also have the option to turn on/off the highs/lows in the settings.
Any questions, let me know. Always happy to help.
Thank you!
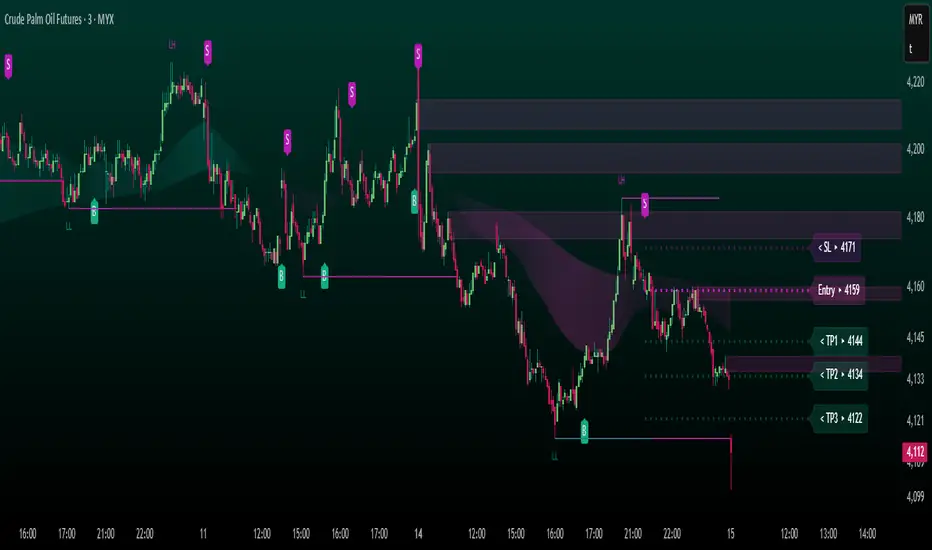
FUTURES ScalpV2 PROTECHFUTURES ScalpV2 PROTECH system
This indicator is built specifically for fast trading i.e. scalping/intraday in the commodity market or futures market. It uses an indicator instrument consisting of ATR TRAILING STOP (ATR), EXPONENTIAL MOVING AVERAGE, PIVOT POINT, and FIBONACCI.
Rebuild of Instrument & Parameter
This indicator is also an upgraded instrument that is sourced from the previous indicator, the COMPLETELY FCPO INDICATOR.
This R&D of course to make trading activities more effective, dynamic and to increase the confidence of traders in current trading activities. The indicator has been upgraded in terms of parameters as well as additional instruments. Among them are;
1. ATR Trailing Stop
2. Exponential Moving Average – fastMA/slowMA Length
3. Label@Entry Price/Stoploss/Takeprofit line
>The best timeframe is 3 minutes
>The take profit and stop loss rates are based on percentages. However
traders can change the percentage rate according to their respective
trading plans.
>existing percentage rates have been set(build-in) specifically for the FCPO
market. So you have to reset for other markets.
>The candle/bars have been colored to make it easier for traders to see price
trends whether in bullish or bearish conditions.
The original instrument has been retained but changed in terms of display & facelift features.
The original indicator (COMPLETELY FCPO INDICATOR) still remains in use and can used together. Hopefully with the combination of these indicators will make traders more successful in trading activities, especially in the futures market.
DISCLAIMER;
ALL NOTES AND INDICATING TOOLS ARE FOR EDUCATIONAL ONLY AND AS A FACILITATOR AND PREPARATION IN TRADING ACTIVITIES. ADMIN IS NOT RESPONSIBLE FOR ANY RISKS IN YOUR TRADING ACTIVITIES. TAKE AT YOUR OWN RISK.
FunTrader/Aieyee @2022
[blackcat] L3 Supply and Demand Zones MTFLevel: 3
Background
Supply and Demand represent the two most powerful forces of the market. Demand means the number of buyers buying a security in the market. Supply means the number of sellers selling a security in the market. Large supply takes the price to move down and large demand takes the price to move up. Balance in both forces will keep the price in sideways movement. There are two types of states of the price of a security in technical analysis. 1. Balanced state; 2. Unbalanced state. In a balanced state, the price is moving in a range like moving sideways. Simply means forces of buyers and sellers are balanced. Both of them don’t have the ability to create a trend either bearish or bullish trend. After breakout of this sideways (range) movement of price, imbalance in price occur. And after the breakout, the recent range will be called a base zone and the price will again come to this base zone to pick unfilled orders.
Function
This is a composite supply and demand zone indicator, which inlcude:
1. demand and supply zones: yellow color box for demand zone while fuchsia color box for supply zone
2. half-semi log based fibo levels
3. multiple time frame (MTF) manual or automatic setting to see clear trend
4. tendline drawing. Default 610 bars back to draw, you can change it to your preferred value. However, you need to guarantee the existing chart already have equal or more than the number of bars you set or 610 bars.
5. blackcat reveral labels
6. box color to indicate volume information as:
box border color is green --> bullish
box boarder color is red --> bearish
box body color meanings:
a. turquoise or aqua or cyan box body color --> no volume indicaor signal or NA --> no supply and demand signal
b. red box body color --> volume climax up - strong bullish high volume --> demand >> supply
c. white box body color --> volume climax down - strong bearish high volume --> supply >> demand
d. green box body color --> high volume churn - bars with high volume and low range --> suppy and demand is balancing
e. yellow box body color --> low Volume - bar for low volume --> bullish/bearish trend is exhausted, reversal may happen soon --> supply or demand dominance will be changed soon.
f. fuchsia box body color --> volume climax plus high volume churn --> two possibilities: red+green=fuchsia or white+green=fuchsia, so fuchsia is a mixed state --> srong demand with supply attack or strong supply with demand attack.
Remarks
Free but closed sourced.
If the trendline is not drawn but you can see the red resistance and green support dashed lines, please drag the the chart to the left unitl you see the yellow solid trend line appears.
This is the initial version. This will be contineously improved along time.

RSI Supply / Demand ZonesLines plotted for the Low and High of the region of price that was Overbought or Oversold
(Low of the candle that became overbought and highest high in the Overbought period)
(High of the candle that became oversold and highest high in the Oversold period)
I like to use the dotted lines as pivot points for the reversal of the trend, and also pay attention to small tops and bottoms (normal lines) that form in strong trends, as they usually make for brief periods of acummulation/distribution before the continuation of the strong trend.

Supply and Demand Zone IndicatorOVERVIEW
The supply and demand zone indicator shows real-time supply and demand zones on the chart. It also plots a table including the high and low values of the zones. The last row of the table also shows the daily trend in the market.
CONCEPTS
What is Supply & Demand?
Supply and Demand represent the two most powerful forces of the forex market. Demand means the number of buyers buying a security in the market. Supply means the number of sellers selling a security in the market.
How to identify supply and demand zones?
Supply and Demand zones are formed on the base region of price on the chart. There are two types of movement of price in technical analysis.
Impulsive wave
Retracement wave
The impulsive wave represents the price movement of market makers. The Retracement wave indicates base regions where market makers decide their next direction to go up or down.
There are four fundamental concepts of Demand and supply in forex.
Rally Base Rally (RBR)
Rally Base Drop (RBD)
Drop Base Rally (DBR)
Drop Base Drop (DBD)
How does supply & demand indicator work?
Our supply & demand indicator will use a simple formula based on price action to plot the zones. It will plot the zone on the base candles using the high and low of the base zone.
Base candle = a candlestick that has a small body and big shadows like a Doji candlestick.
Big candle = a candlestick with a large body and small shadows.
The zone will be drawn on the high and low of the base candlestick. There can be more than one base candlesticks in the base zone, but our indicator will identify the maximum of 4 base candlesticks.
FEATURES
Specify desired Big Body Candle Size Percentage
Specify desired Small Body Candle Size Percentage
Change the Colors of Zones at your own will
The Indicator Draws the latest zones and puts a label on historical Zones
The Indicator Draws real-time Zones under specified conditions of candle body sizes. The Zone will stop once the candlestick closes above the supply zone or below demand zones.
Recommended Timeframe
Above 30 Minutes

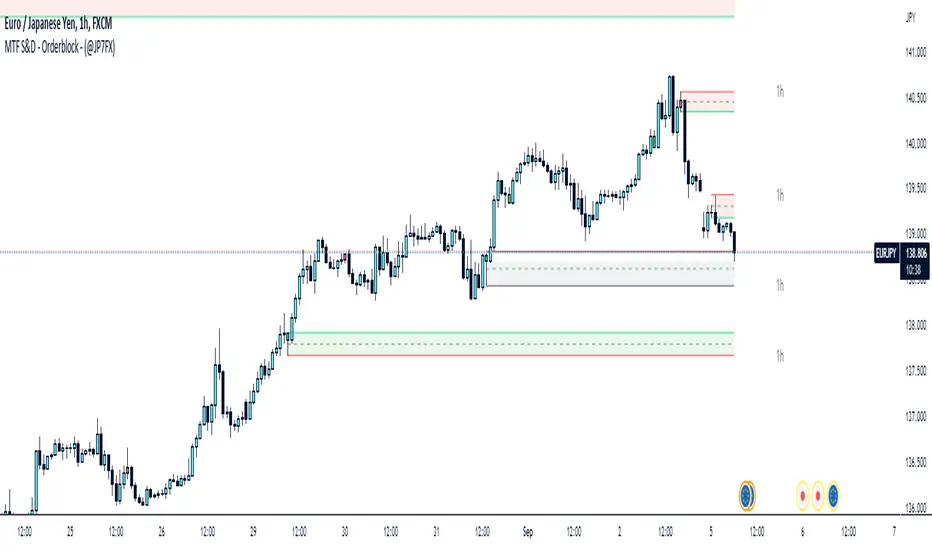
Supply & Demand / Orderblocks - Multi TimeFrame (@JP7FX)This should easily find the clear BUY to SELL / SELL to BUY candles with imbalance created.
There are options to change the Supply and Demand / OrderBlock CREATION based off the OPEN or WICK imbalance and also the option to DRAW the zones from the OPEN or the WICK.
Will also draw HTF zones with options to change the colour of zones when price has mitigated these areas, zones will be deleted once price has passed through.
Each Zone has the 50% line drawn and will delete when Price has reached - maybe useful for traders who look for 50% mitigation of areas.
When using HTF zones (max of 2) a Timeframe display will show for that zone.
There are many options to change colours and lines etc to suit the layout you prefer.
The zones that are created are not to trade from without additional analysis its simply to help draw strong zones.
Hope this provide some help and Trade Safe :)
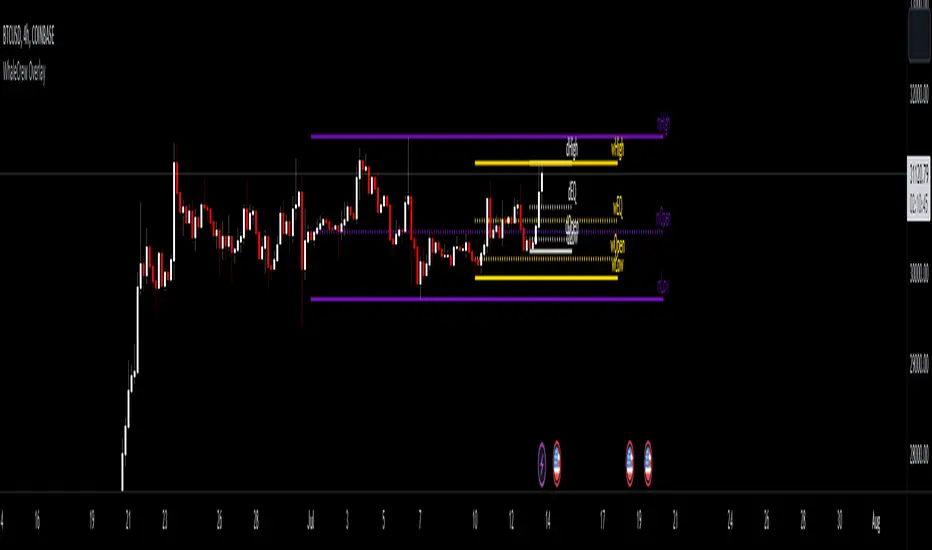
WhaleCrew OverlayThis overlay is all about looking for confluence, and this is achieved by combining the power of Support/Resistance trading and Moving Averages.
Features
Support and Resistance
Trend Visualization
Fib Ribbons
Moving Average System
Intraday Tools
Support and Resistance
This involves Daily Levels (High, Low, Open, and Range Center), Weekly Levels (Open, High and Low), as well as the Monthly/Quarterly/Yearly Open.
Automatically having these support/resistance levels on your chart no matter what timeframe you're on is a big advantage, they can be used as confluence levels for potential trades.
Trend Visualization
Our trend component visualizes the current trend using two moving averages. There are multiple inbuilt modes that should be picked based on your trading style.
Use this indicator as confluence and don't rely solely on it.
Fib Ribbons
Our Fib Ribbons are a bundle of multiple EMAs with custom timeframe built-in. Unlike EMA Ribbons our EMA lengths are only based on Fibonacci Numbers.
The numbers of EMAs is four by default (fastest: 8, slowest: 34), but EMA 5 & 55 can be manually enabled.
The ribbons will act as support in an uptrend and as resistance in a downtrend. A ribbon cross often indicates a potential trend change.
Moving Average System
Build a system around 2 custom moving averages for more confluence (supports custom timeframes and many moving average types).
The moving averages can be used for generating signals whenever they cross, or as possible support/resistance.
Intraday Tools
We also support intraday tools like VWAP (Volume-Weighted-Average Price) and TWAP (Time-Weighted-Average-Price).
They differ from normal moving averages by taking volume/time into account and will act as potential support/resistance (commonly used by big market participants).
Usage
You should look for price levels where moving averages and support/resistance are lined up for confluence.
Closely monitor price action near important price levels for potential trade setups:
Consolidation right below resistance is considered bullish
Consolidation right at support might be considered bearish
Watch out for rejections and retests (also counts for moving averages)
Access to this indicator can be obtained through our website.
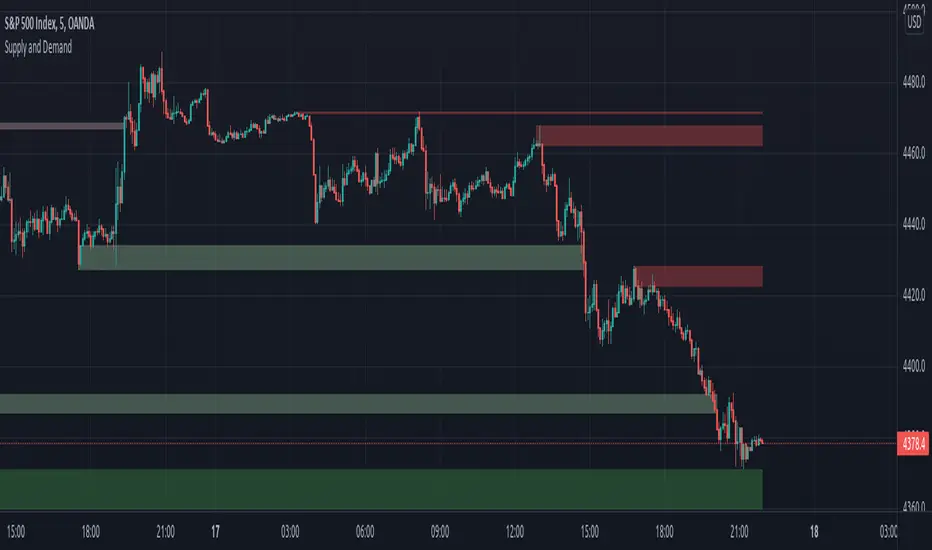
Supply and DemandOur Indicator “Supply and Demand” offers an insight into the structure of any given Instrument applied to. Understanding Supply and Demand is essential for using this Indicator. If you are familiar with the concept, then you will most likely find this indicator useful in your trading. If you are unfamiliar with the concept and are interested then continue reading a “Brief Concept of Supply and Demand” at the end of the description, where we will provide some informational Links.
This description will provide a High Level description of how our Indicator identifies and visualizes Supply and Demand, followed by how to use the Indicator in your trading. At the end we would like to introduce our team and experience.
High Level Description of “Supply and Demand”:
Our indicator searches for price zones where the current Instrument has experienced a significant liquidity imbalance in the recent relative past. Our indicator uses a Multi timeframe approach to identify these areas. These Zones will be referred to as “Active Zones” from now on.
When Price exceeds the outer boundary of the Active Zones, then this Supply or Demand Zone will be identified as “Expired”, and the zone is no longer in play. These Zones will be referred to as “Expired Zones” from now on.
Visualisation:
What do the Boxes mean:
Our Indicator visualises active Supply and Demand Zones. Supply zones are red and Demand Zones are green. Furthermore, our indicator shows a brief history of Expired Supply and Demand Zones. These Zones have the same color as the active Supply and Demand Zones, just with a higher color transparency so that you can distinguish between active and Expired Zones.
The boxes start at the time where the supply/demand has occurred historically, providing a simple method to review the Market reaction to the historic supply/demand event.
History:
Due to the high calculation effort, the history is limited to 20 Zones in total. All zones prior to that will not be displayed.
Important:
All Zones will not be repainted. That being said, once our indicator has started displaying a Zone, then it will be visible until it exceeds the 20 Zone history limit and “falls of” the chart.
How to use it:
Approaching an Active Supply/Demand Zone:
When price is approaching or entering an active Supply/Demand Zone, look for reversal patterns you are familiar with. It is important that you have a tested method behind your entry and exit strategy. Please note, that the indicator itself just presents price areas where there is a potential for a price reversal, and that these levels should not be traded blindly.
Expired Supply/Demand Zones:
Expired Supply and Demand Zones are mainly just to provide a small History of Supply and Demand Zones to you. There are more advanced concepts for also using Expired Supply and Demand Zones in your Trading, but this is not the focus of this Indicator.
Time frame:
This indicator is programmed to be used on all Timeframes.
Instruments:
This indicator aims to visualize areas of where Market price has the potential to reversal, hence this is a mean reverting Indicator.
Taking this statement to account, it is recommended to apply this Indicator to Instruments with a mean reverting character.
Examples of mean reverting markets could be for example …
...all FOREX instruments, as FOREX is considered a mean reverting Market.
...an instrument that is in a consolidation, or which you are expecting to enter a period of consolidation.
Indicator settings and configuration:
The Indicator has no functional parameters, to reduce User error, and only has visual parameters. The color of the Supply and Demand Zones can be tailored to your liking.
Brief concept of Supply and Demand:
Supply and Demand is a concept that has been around for a very long time. Following links are helpful to get a grasp of the concept:
en.wikipedia.org www.investopedia.com
www.investopedia.com
Our Team:
We are a team of 3 Traders with a combined experience of 40 years. We are using our experiences from the market to create Indicators to Visualize the most relevant Patterns to us in our trading today. Our goal is to reconstruct these patterns to match our understanding of the market and to simplify the process of creating reproducible trading Strategies.
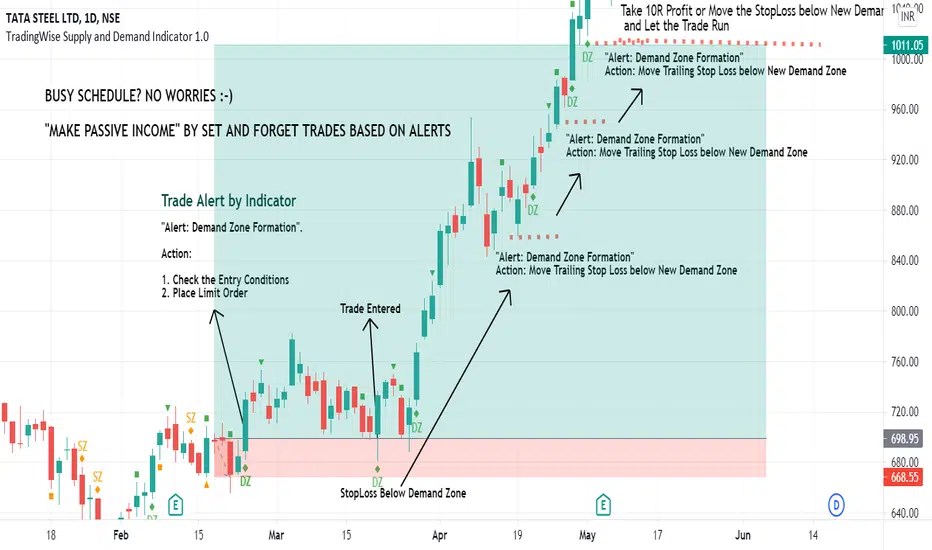
TradingWise Supply and Demand Indicator 1.0TradingWise Supply and Demand Indicator 1.0 is based on the Price Action candlestick patterns to identify the Supply and Demand zones in the charts (Areas of liquidity). It works on all Timeframes and Asset Classes. This Script helps the traders to identify the demand and supply zones with identifications on the candle stick patterns indicating the origin of the Strong move. Also it generates Alerts automatically once the supply or demand area is formed thus by reducing the hours spent on the charts and reducing the missed trade Opportunities as well. This Indicator is extremely helpful for those on Full time Jobs/ Busy Schedule.
Buy/Sell Alerts by Indicator:
Green Diamond + DZ Sign ---> Indicates the Demand Zone Formation. Place Buy Trade upon Entry Criteria Met
Orange Diamond + SZ Sign ---> Indicates the Supply Zone Formation. Place Sell Trade upon Entry Criteria Met
Mayfair Supply & Demand Zones 1.0Identifying Supply and Demand zones can be tricky.
Just using price levels can mislead you, so why not include volume ramps to detect zones?
This indicator does it for you. It spots areas where volume has rapidly increased, measures the speed of the increase, and assigns three different levels of importance.
The red areas are the strongest zones, followed by amber, then green, like a traffic light.
The red areas are persisted longer than the amber, which are persisted longer than the green. As the persistence fades, the colour of the zone fades as well.
It is possible to set the levels of all three volume thresholds to suit yourself, as well as the lookback period the script uses to detect volume increases.
In this chart, only very large volume increases are used:
As you can see, the bands are narrower, but we feel the defaults give the best results.

KryptOkib Supply and Demand with AlertsAs the name suggests, this is a supply and demand indicator script with alerts that i have made based on sole price actions. I have used 3 different methods of identifying supply and demand zones and tested to make sure they work. Nonetheless some zones will fail as no strategy is 100% and some zone will fail due to other reasons.
How this works:
As a basic rule, demand and supply zones can easily be identified from the base of a drop to a rally or vice versa and the base of a rally to a new rally, hence rally base rally, drop base rally for demand zones and rally base drop and drop base drop for supply zones.
While that is true, i basically search for areas where demand/bulls overpower supply/bears and vice versa with a strong move away. So not all the base are a consideration in this script unless we see a clear sign of bulls overpowering bears, or say demand overpowering supply and bears overpowering bulls or say supply overpowering demand. Several rules has been put in place to identify and filter this out so you may have a Rally Base Drop get ignored by this indicator as it do not meet my requirement.
Once this pattern is detected by the script using either of the 3 price action methods, and then a breakout of the basing candles occurs, the indicator paints the candlestick that broke out of the range/base with a different color, which is blue for demand breakout candle, and orange for a supply breakdown candle as circled on the chart.
The algorithm makes sure that this breakout candles follow strict rules set by mean of which 1 is a very bullishly closing breakout candle for demand or a very bearishly closing candle for a supply, with a follow through candle which is the next trading period /candle.
it is strongly recommended that you wait for the close of the next candlestick before attempting to take the demand/supply zone formed as there are further calculations done on the follow through breakout candle to make sure the demand/supply is a good one, the candle might be painted before the close of the next candle but after the close, the paint will be removed due to the fact that the zone no longer meets strict criteria as defined by me.
It is also suggested that you use the alert function that comes with script and wait for the alert to come through before taking the demand if you cannot wait for the second breakout candle to close as the alert will be fired only on close of the second follow through breakout candle.
One of the strict rules is wanting to see strong bullish/bearish presence apart from the way the breakout candle closes, there are many rules to filter out ugly zones, even though some good zones get caught up in this as well.
Identification of Zones:
Demand Zone: the previous candle open or high(based on personal preference) will be the proximal, where you start to draw your demand zone and the low of the basing/ranging candles or swing low will be the distal, where you end your demand zone as seen on the chart. Stop loss goes under this.
Supply Zone: The previous candle open or low will be the proximal, where the supply zone starts and the high of the range/basing candles or swing will be the distal where the supply zone ends as seen on the chart. Stop loss goes above this
Note that some zones with a-lot of basing candles tend to fail, while some tend to work, i have not algorithmically filtered this as i prefer to examine with eyes the zones alerted to me and take the ones with lesser basing candles.
Generally, Rally Base Rally and Drop Base Drop zones are mostly weaker than the other type of zones but sometimes works perfectly.
How to use Alert Function:
- Go on the ticker you will like to set alert for
- Go on the timeframe you wish to be alerted for
- Right Click on the chart and select Add Alert or Alt + A (keyboard combination)
- Under Condition, click the arrow down and select "KryptOkib SAND"
- Under Options, select "Once Per Bar Close"
- Set Expiration and Alert Actions as you prefer.
- Click on "Create" Button
That is it.
You can repeat this process for all other tickers you wish to have alerts for and you will be notified once price movement has met the conditions outlined in the script.
This is an invite only indicator, to request access to it, kindly do the following:
- Add indicator to favorite
- Make Sure you follow me
- Send me a PM requesting access.
Once this is done and PM received, access will be granted.
Further updates will come along once there are changes to be made or new calculations to add.
Works on any market of choice.

PIVOT EDGE - The complete trading setup - LITEIntroduction to the Indicator " PIVOT EDGE - The complete trading setup - LITE "
The Foundation layout for this indicator is based on PIVOT's which are nothing but the most important levels that the price has respected in the past.The values for the pivots are derived from the key attributes of the price in any timeframe such as the OPEN, HIGH, LOW and CLOSE. These define the mood of the price and where it intends to move in relation to the previous range formed.Earlier HIGH - LOW i.e the RANGE indicates the possible movement that a stock can make in the current session and as per the calculated pivots we can possible find out the tentative supports and resistances. In addition to this indicator, It is advisable to use the price action theory which helps in taking a right decision for entries.
This indicator by itself is complete in nature, i.e it guides the user for possible entry levels and the projected targets that we can achieve and also the likely stop loss limit in case the price reverses. So beforehand even before entering into a trade position, the user can ascertain what can be his loss or max profit and then he can chose an optimum position size for favorable results.
The beauty of this Indicator lies in the fact that it can be used for all types of trading like Scalping, Intra day, Swing or Positional and Investments also. It works on all timeframes and across all market segments like EQUITY, COMMODITIES, FUTURES , OPTIONS , FOREX etc.
This indicator can be used for any exchange and any timezone also without any changes or adjustments needed.
Now let us understand the features of this Indicator in detail.
TIMEFRAME - It has options to choose between Day,week and month as timeframe. By default it is set to Day timeframe
DISPLAY MAJOR LEVELS - These are the important support and resistance levels calculated based on the past price data. Most important ones are marked in BOLD RED and BOLD GREEN between which the price tends to move generally.
Apart from these, We have breakout level marked in light green and if price breaks this level we can expect targets upto extended levels and beyond marked in blue.
we also have breakdown level marked in light red and if price breaks this level we can expect targets down up to extended levels and below it marked in blue.
In addition I have coded intermediate target levels that appear in light gray between the extended levels or blue lines. Sometimes when the gap between these targets are huge, price cannot reach the targets and reverses at these intermediate targets. You can use them as targets or trailing stoploss based on your plan
DISPLAY HIDDEN LEVELS - These levels are intermediate supports and resistances that can be used whenever the present day indicated range is very wide. Whenever we have an explosive moments in market the range of that day is very huge and so he next day support and resistance band becomes very wide indicating the sideways movement day within that range. And on those days we can switch on the hidden levels and the price respects these levels and most of the days it is inside this range only.
DISPLAY PREVIOUS HIGH / LOW / CLOSE - I have included Daily / Weekly and monthly levels. It is important to know the earlier highs / lows and close since price respects it very must just like support and resistance.
PEMA - This is an important EMA based indicator which potentially indicates curves of support and resistance during retracements or pullbacks. If the curves are breached then the trend is reversed and the price will tend to move to the next pivots.
VALUE AREA - One of the most important feature of this Indicator is this which is derived from the Volume profile concepts. It indicates the fair value area Indicated by orange band and the upper and lower limits indicated by orange lines. Whenever the price is overvalued or undervalued, it is pushed back to its fair value and we can judge the present price position in relation to the value area and then take position in anticipation of the price reaching its fair value area. This must be coupled with price action for favorable results.
IMPORTANT NOTE : This indicator does not guarantee any favorable results nor protect your from any loss. You own the complete risk of your trades. It is suggested that you use this indicator and do back testing for considerable period to understand how it works the the potential win rate it can give.
If you have any doubts or need any clarifications of assistance in understanding, you can message me and i will try to help.
I will soon try to make a Video and explain the use of this indicator for better clarity and understanding.
Happy and Safe trading - Mohan from PIVOT EDGE

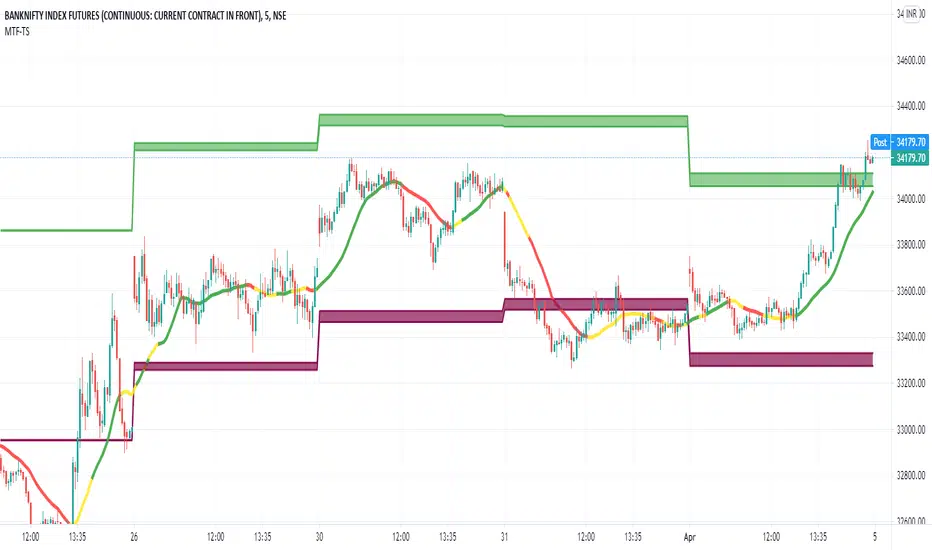
Multi Time Frame - Trade SetupsMuti Time Frame - Trade Setups
How does it work ? Price movements over range of period is used to compute the range moving forward.
As the option for wider time periods are selected more candles are selected for calculation
The Trend Line is the supporting factor to this logic and SMA20 is used as the basis of the trend line.
To Indicate the strength of the trend line , RSI is computed over multiple timeframes and then used to colour the trend line to show its strength
Once the Range is identified it can be considered as the Breakout/Breakdown zones or as the Potential Reversal Zones (PRZ)
How to Deploy / Use
As part of the Indicator there are four Choices that the user can opt for
Show Intraday Trades - This works for Intraday Trades - when the resolution is kept to less than 1 hour ( Say 3 , 5 , 10 , 15 Mins)
Show Short Term Trades - This works well when the resolution is kept to 1 Day - Good for Swing Trades spanning over a few days
Show Long Term Trades - This works well when the resolution is kept to 1 Day or Week - Good for Investments
Show Trend Line - Will show the user the Simple Moving Average 20 based on the resolution selected , The Trend Line Is a repainted based on the hybrid RSI Logic
The Trend Line would show in three colours
Green : T he Setup is in Up Trend- Try to take the trade as closer to the band as possible and when it continues to be in green ( and recommended when it would have just crossed from Red/Yellow to Green )
Red : The Setup is in Down Trend - Try to take the trade as closer to the band as possible and when it continues to be in red ( and recommended when it would have just crossed from Green/Yellow to Red )
Yellow : The Setup in sideways Trend ( a new trade isnt recommend in this band
Visual Checks - It is always recommended to enter/exit the trade it it touches crosses over the Trend Line from one side to the other
When closer to the support resistance bands , wait for a confirmation candle to determine if you are getting resistance breakout / support or breakdown
Stop Loss - That should be done by following ones risk appetite , Ideally the open/close of the previous candle should be the stop loss for the buy/sell
but everyone has their own Risk Management Strategies based on the capital deployed.
Usage/Markets : Index Trading / Equities and on proper analysis you may use it for Option Trading also. - Doesnt work that well with Commodities and Currencies
Disclaimer : There could be scenarios when the breakout/breakdown candle is rejected , especially when it is long one
so it is always recommended to have a confirmation candle that open-closes above the breakout candle / open-closes below the breakdown candle
If you like it and find it useful or if you find a defect or bug , Please let us know in the comments .. that would encouraging !! for us to develop it further
Thank you and have a beautiful and Profitable trading session !
How to get access
Please click on the link / email in the signature or send me a private message to get access
Feedback
Please click on the link/email in the signature or send me a private message for suggestions/feedbacks
DTC_ZoneThis Indicator can be used for finding the supply and demand zone. Supply and demand has been fetched from the past 10 days volatility of the particular stock. And the main thing is the target and stop-loss were arrived based on the Fibonacci retracement.

Supply & Demand Zones - ShortTerm (Expo) "It hasn't been easier to display, in real-time, one of the most important and useful technical analysis, namely supply/demand zones. This algorithm analyzes the market structure in real-time and maps out key supply and demand zones for you. "
Supply/Demand Zones - ShortTerm (Expo) analyze the short-term market structure in real-time and maps out key supply and demand zones. The user gets an instant understanding of the short-term market structure.
The indicator identifies short-term zones where demand overwhelms supply which is driving the price up, or where supply overwhelms demand which is driving the price down. It makes sense to buy at a demand zone and to sell at a supply zone, but keep in mind that fresh zones are more effective than retested ones. They can be used as entry zones for a continuing trend or as reversal zones for a changing trend.
--> The indicator displays up to 5 zones , which one of them (the blue one) can be customized. Labels with price levels can be enabled. Flexible source input- and zone settings.
-->The indicator can be used standalone or as a part of your current trading strategy.
Real-time
No repainting
Works on any market
HOW TO USE
1. Use the indicator to identify key short-term supply and demand zones.
2. Use the indicator to confirm the existence, or a continuation, of a trend or a trend reversal.
3. Use the indicator to identify potential breakouts.
INDICATOR IN ACTION
4-hour chart
I hope you find this indicator useful , and please comment or contact me if you like the script or have any questions/suggestions for future improvements. Thanks!
I will continually work on this indicator , so please share your experience and feedback as it will enable me to make even better improvements. Thanks to everyone that has already contacted me regarding my scripts. Your feedback is valuable for future developments!
ACCESS THE INDICATOR
• Contact me on TradingView or use the links below
-----------------
Disclaimer
Copyright by Zeiierman.
The information contained in my scripts/indicators/ideas does not constitute financial advice or a solicitation to buy or sell any securities of any type. I will not accept liability for any loss or damage, including without limitation any loss of profit, which may arise directly or indirectly from the use of or reliance on such information.
All investments involve risk, and the past performance of a security, industry, sector, market, financial product, trading strategy, or individual’s trading does not guarantee future results or returns. Investors are fully responsible for any investment decisions they make. Such decisions should be based solely on an evaluation of their financial circumstances, investment objectives, risk tolerance, and liquidity needs.
My scripts/indicators/ideas are only for educational purposes!