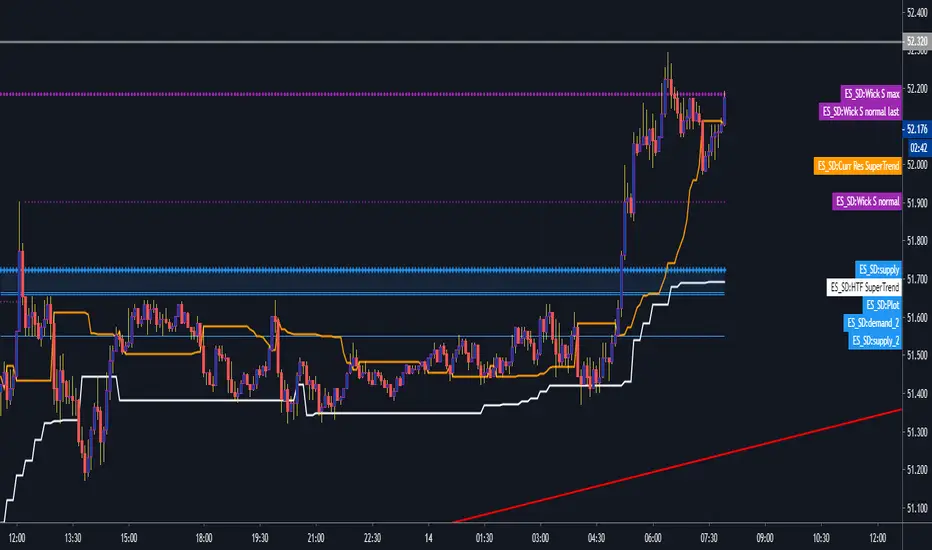
Eric Smith Supply and Demand V3Supply Demand, look back limited for now until Tradingview supports arrays.
Supply_and_demand
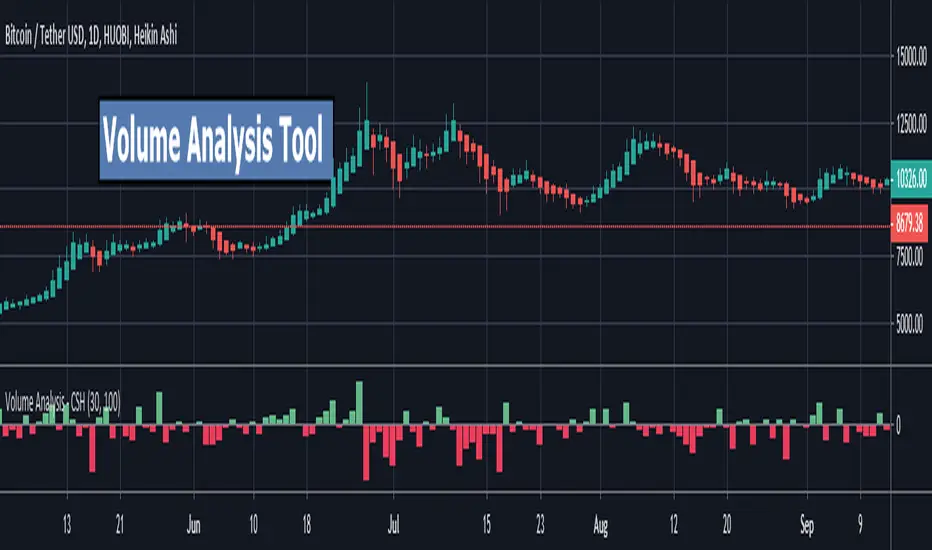
Volume Analysis Tool - CryptoShoots Volume Analysis Tool
Volume Analysis Tool is a technique to simulate tick volume data to get Buying volume and Selling Volume in each bar to any asset .
*** Features
* Delta Volume Mode .
* Detailed Volume mode - Buying and selling for each candle .
* Better understanding to the Accumulation and Distribution using volume analysis easily .
*** Usage
* Turn only one Mode(Delta or Detailed ) ON to let the indicator Shows you its magic .
* Volume Search : by default it's 1 MIN . Note : if you want to change the value understand that the lower the value the better the Accuracy .
//
As a rule of thump use 1 MIN Volume Search for these time frames ( from 5 min to 4 hours ) and 5 min Volume Search for Daily time frame .
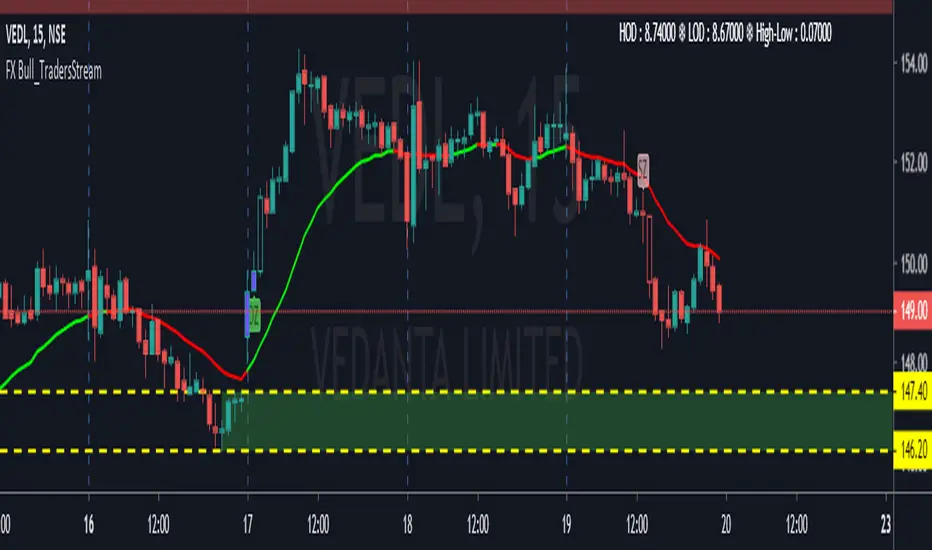
FX Bull_TradersStreamComplete Solution for Trading. In this Indicator
1. Oscillators = In that you will find EMA, SMA & Bollinger Band
2. Length = It's Length of EMA & SMA
3. Demand Zone = Wherever you find "DZ" Label and with that Trend and Location is in your favour than you can go Long from that zone. And another thing you can choose base Quantity Up to 6 Bases.
4. Supply Zone = Wherever you find "SZ" Label and with that Trend and Location is in your favour than you can go Short from that zone. And another thing you can choose base Quantity Up to 6 Bases.
5. Higher Time Frame = Choose this thing so, tool can know what is your Higher Time Frame accordingly this it will judge your ITF & LTF.
6. Higher Distal & Lower Distal = Please enter manually the no.'s of your Upper Distal Line & Lower Distal Line. and when changing chart don't forget to make it "0"
7. Trend @ ITF = Choose your Trend. (Please choose your Trend from your ITF (Intermediate Time Frame)Time frame, to get better results)
9. Risk As per DATR in % = Calculates as per DATR (Daily Average True Range)
10. 1st Symbol & 2nd Symbol = To have other symbol price in your chart.
11. Explosive Candle & Basing Candle = Tick to view Explosive & Boring candle in zone formations & Untick hide the indication.
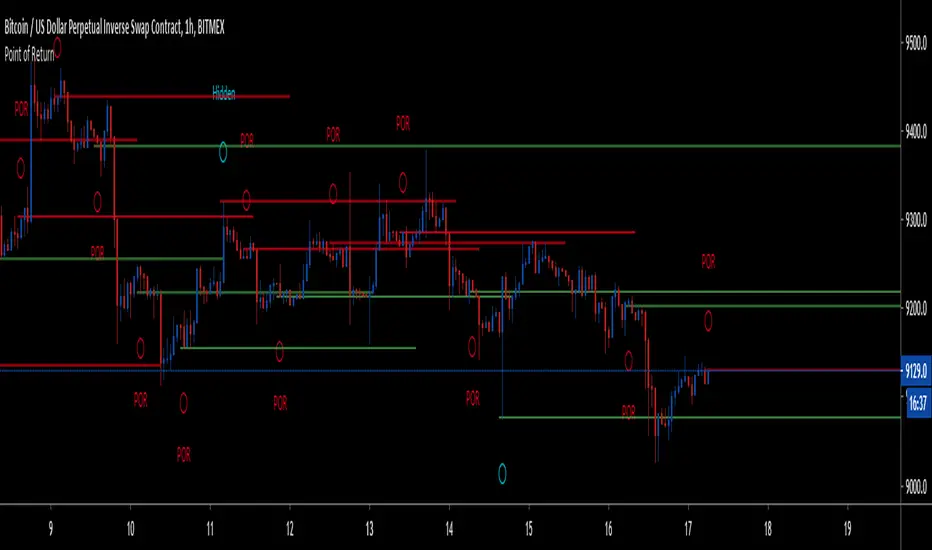
Point of Return - Dynamic Price Reaction RangesThis is one of the many parts of my upcoming strategy, and used by me on daily basis.
This indicator incorporates various price action models and candlestick patterns, and combines them together to form a price point which is highly reactive in nature.
In the background it works on multitude of permutations and combinations to calculate the price point which tell us exactly where price will most likely react in the future, removing rooms for errors while drawing support and resistance .
This can be used on multiple ways:
1. Chop indication - As soon as the indication pops up, it marks a price which is most likely start of a chop zone and break from either direction marks end of the chop zone.
2. Point of Return - As soon as a the price moves away from the chop zone, it will most likely return to the indicated price before moving in the direction of the break, giving us high RR trades.
3. Dynamic Support and Resistance - This also acts as a dynamic support and resistance and apart from your already established S/R you can incorporate these price points as your decision maker or breakers.
PS : This is not to be used as a Buy/Sell signals and is only should act as confirmation of what you already know and to gauge the market sentiments.
There is a hidden easter egg on this page and chart which gives you preview of the upcoming indicator. Have fun finding out.
You can reach me here on my DM for more details.
Below are the few snaps from different timeframes:
1. 4H XBTUSD -
2. 2H XBTUSD -
3. 8H XBTUSD -

TradeHunterVersion 1 of a Supply & Demand indicator I hope to continually improve.
Supply & demand are represented by flags & the triangles are intended to assist trend analysis & provide confluence.

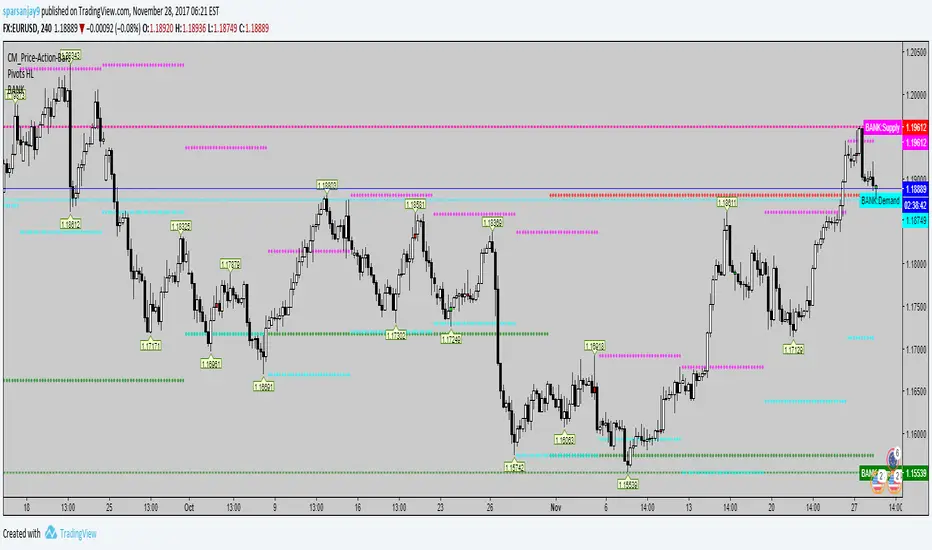
BANK LEVELSHello Traders,
This is another Indicator following to my Reversal Zones indicator !
This script will display the Buying and Selling levels that the Banks are Interested in.
On current day chart, it displays four Price lines ( Monthly Demand & Supply and Weekly Demand & Supply levels)
Previous levels are displayed as dots and those can be referred for analysis by drawing horizontal lines on top of it.
Displayed on all Time frames.
Colours of lines can be customised.
*** PLEASE CHECK OUT THE BELOW SCREEN SHOT TO MAKE BEST USE OF IT ***
Happy trading,
Cheers,
SANJAY RAMANATHAN
FXMM Zones TF:M5Observe the price reaction in the zones of supply/demand from multiple timeframes. Original idea from Forex MoneyMap, Dynamic Fibonacci Grid etc.
NOTE: Only for M5 !

Eric Smith's Supply/Demand - made dynamicAllows 3 time frames, current resolution and two others.
Will take the 3rd TF and bring forward one cycle it's history so it can be seen on the chart without scrolling... clearly all elements can be turned off in style.
