Support Resistance Major/Minor [TradingFinder] Market Structure🔵 Introduction
Support and resistance levels are key concepts in technical analysis, serving as critical points where prices pause or reverse due to the interaction of supply and demand. These foundational elements in price action and classical technical analysis assist traders in understanding market behavior and making better trading decisions.
Support levels are zones where demand is strong enough to prevent further price declines, while resistance levels act as barriers that hinder price increases.
Support and resistance levels are divided into two main types: static and dynamic. Static levels are fixed horizontal lines on charts, formed based on historical price points, and are crucial due to repeated price reactions in these areas.
Dynamic levels, on the other hand, move with market trends and are often identified using tools like moving averages and trendlines. These levels are particularly useful for analyzing dynamic trends and identifying potential reversal points in financial markets.
The importance of support and resistance in technical analysis lies in their ability to pinpoint price reversal or continuation points. Professional traders use these levels to determine optimal entry and exit points and combine them with tools such as Fibonacci retracements or moving averages for precise strategies.
Detailed analysis of price behavior at these levels provides insights into trend strength and the likelihood of price breaks or reversals. By understanding these concepts, technical analysts can forecast future price movements and optimize their trading decisions using tools such as indicators and price action. Support and resistance levels, as a cornerstone of technical analysis, form the foundation for many trading strategies.
🔵 How to Use
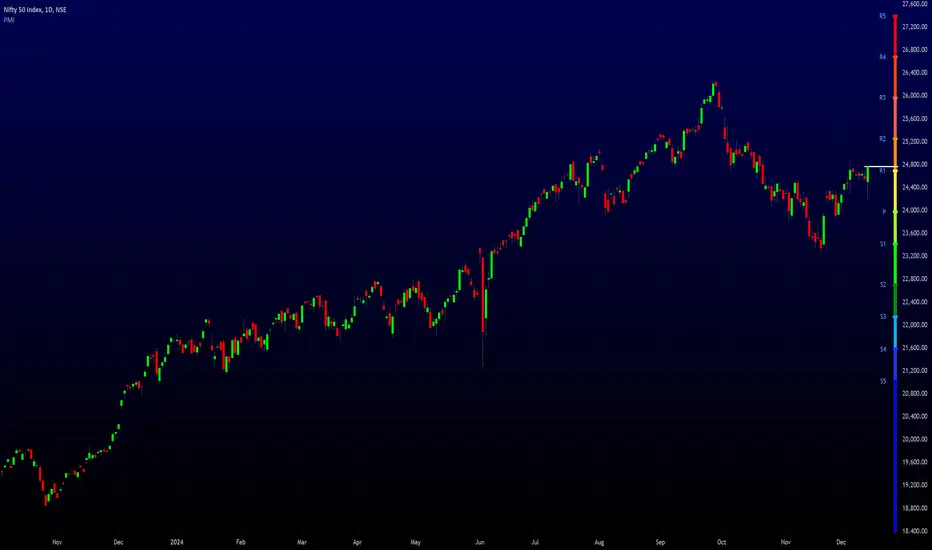
The Static Support and Resistance Indicator is a vital tool for identifying significant price zones in financial markets. It automatically detects major and minor support and resistance levels in both short-term and long-term intervals, enabling traders to analyze price behavior accurately and develop optimal entry and exit strategies.
🟣 Major Long-Term Support and Resistance
Major Long-Term Support : The lowest price points recorded over long-term intervals that prevent further declines.
Major Long-Term Resistance : The highest price points in long-term intervals that limit further price increases.
🟣 Minor Long-Term Support and Resistance
Minor Long-Term Support : Temporary halts in price decline within a downtrend over long-term intervals.
Minor Long-Term Resistance : Short-term zones within long-term intervals where prices react negatively in an uptrend.
🟣 Major Short-Term Support and Resistance
Major Short-Term Support : The lowest price points in short-term intervals that act as barriers against sharp price drops.
Major Short-Term Resistance : The highest points in short-term intervals that prevent further price surges.
🟣 Minor Short-Term Support and Resistance
Minor Short-Term Support : Temporary halts in price decline within short-term downtrends.
Minor Short-Term Resistance : Zones where price reacts quickly and reverses in short-term uptrends.
🔵 Settings
Long Term S&R Pivot Period : Defines the interval for identifying long-term support and resistance levels (default: 21).
Short Term S&R Pivot Period : Defines the interval for identifying short-term support and resistance levels (default: 5).
🟣 Long-Term Lines
Major Line Display : Enable/disable major long-term lines.
Minor Line Display : Enable/disable minor long-term lines.
Major Line Colors : Green for support, red for resistance (long-term major levels).
Minor Line Colors : Light green for support, light red for resistance (long-term minor levels).
Major Line Style : Choose between solid, dotted, or dashed lines for major long-term levels.
Minor Line Style : Choose between solid, dotted, or dashed lines for minor long-term levels.
Major Line Width : Adjust the thickness of major long-term lines.
Minor Line Width : Adjust the thickness of minor long-term lines.
🟣 Short-Term Lines
Major Line Display : Enable/disable major short-term lines.
Minor Line Display : Enable/disable minor short-term lines.
Major Line Colors : Gray-green for support, gray-red for resistance (short-term major levels).
Minor Line Colors : Dark green for support, dark red for resistance (short-term minor levels).
Major Line Style : Choose between solid, dotted, or dashed lines for major short-term levels.
Minor Line Style : Choose between solid, dotted, or dashed lines for minor short-term levels.
Major Line Width : Adjust the thickness of major short-term lines.
Minor Line Width : Adjust the thickness of minor short-term lines.
🔵 Conclusion
Static support and resistance levels are among the most critical tools in technical analysis, helping traders identify key reversal or continuation points.
This indicator simplifies and enhances the analysis process by automatically detecting major and minor levels in both short-term and long-term intervals. It allows traders to customize settings to suit their trading strategies and analyze different market levels effectively.
Using this indicator improves price action analysis, enhances market understanding, and identifies trading opportunities. Applicable to all trading styles, from day trading to long-term investing, it is an essential tool for technical analysis.
Combining this indicator with other tools like trendlines, Fibonacci retracements, and moving averages enables comprehensive analysis and allows traders to navigate financial markets with greater confidence.
支撐和阻力

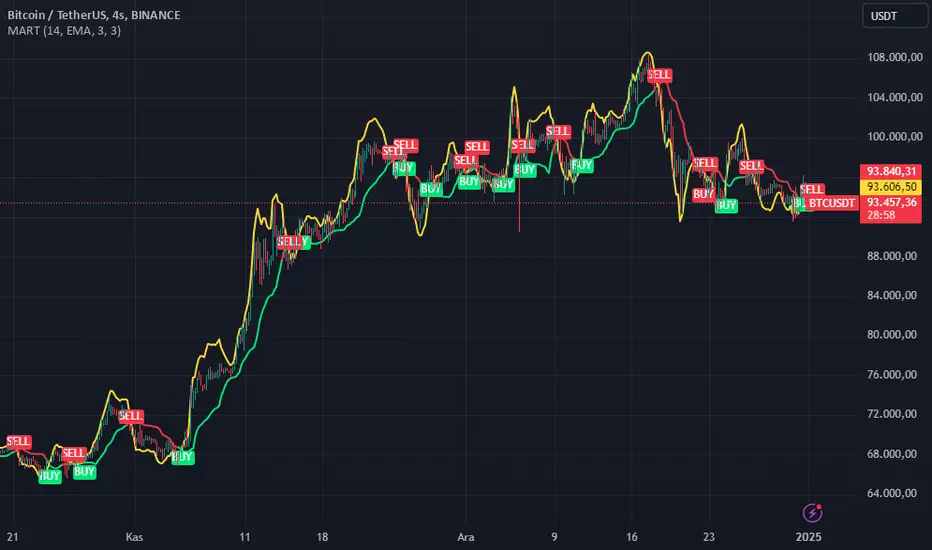
MA Resist TrendThis Pine Script™ code designed to provide insights into price trends and potential buy/sell signals based on a moving average of resistance levels. It features dynamic calculations of a resistance line and a base moving average, enabling traders to visualize trend direction and reversal points effectively.
Key Features:
1. Moving Average Selection:
The indicator supports a wide variety of moving averages, including:
EMA (Exponential Moving Average)
SMA (Simple Moving Average)
HMA (Hull Moving Average)
McGinley Dynamic
RMA (Relative Moving Average)
MD (Mode Average)
WMA (Weighted Moving Average)
VWMA (Volume-Weighted Moving Average)
DEMA (Double Exponential Moving Average)
TEMA (Triple Exponential Moving Average)
This provides flexibility in tailoring the indicator to suit different market conditions and trading styles.
2. Dynamic Resistance Calculation:
MAR: A smoothed moving average of the mid-range between highest price period and lowest price period. This represents the main trend resistance line.
3. Base Line and Resistance Line:
The base line is calculated as the EMA of the closing price.
The resistance line is derived by subtracting the distance between MAR and the base line from the base line. This distance is used to identify potential reversal points.
4. Color Coding:
The MAR line changes color based on its relationship with the current closing price:
Green (lime): Indicates bullish conditions (price above mar).
Red: Indicates bearish conditions (price below mar).
5. Buy and Sell Signals:
A buy signal is triggered when the MAR line crosses below the resistance line.
A sell signal is triggered when the MAR line crosses above the resistance line.
Signals are displayed using labeled shapes on the chart:
"BUY" shape appears below the bar for buy signals.
"SELL" shape appears above the bar for sell signals.
6. Customizable Parameters:
len: Length of the moving average (default: 14).
ma: Type of moving average to use.
lb: Lookback period for high and low prices (default: 3).
smt: Smoothing factor for the mar line (default: 3).
Visualization:
The indicator plots the following on the price chart:
MAR Line: Represents the dynamic resistance line, colored based on market conditions.
Resistance Line: A yellow line indicating the calculated resistance levels.
Buy/Sell Labels: Visual markers indicating potential trade opportunities.
Use Cases:
Trend Identification:
The MAR line provides insights into the current trend direction.
Color changes highlight transitions between bullish and bearish conditions.
Reversal Detection:
Buy and sell signals help identify potential trend reversals.
Dynamic Resistance Levels:
The resistance line offers additional context for understanding price action and possible resistance points.
Notes:
This indicator is particularly useful for trend-following traders who incorporate moving averages into their strategies.
It supports a wide range of moving averages, making it versatile across different asset classes and timeframes.
Traders can experiment with different len, lb, and smt values to fine-tune the indicator's responsiveness.
This script is provided for prediction purposes and does not constitute financial advice. Traders and investors should conduct their research and analysis before making any trading decisions.
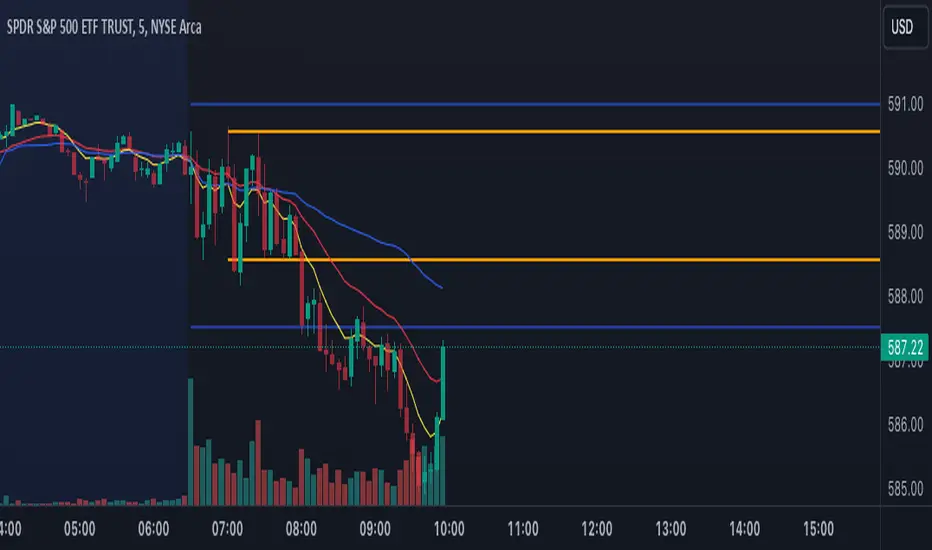
Pre-Market and First 5-Minute LevelsThis will plot the pre-market high an the pre-market low right when market opens after the first five minutes, this will also apply for the first five minute high and five minute low with horizontal rays. Pre-Market levels are blue and 5 minute levels are orange

Premarket and Opening Range (First 30 minutes) LevelsThis indicator is for people who like to utilize the pre-market highs and pre-market Low's as well as the first 30 minutes high and low, or some people like to call the opening range. I hope you find value in this. Note, the levels will only appear after tracking. Premarket levels will happen after pre-market closes. Opening Range levels will show right after the first 30 minutes.
Supports and Resistances Multi Timeframe - VK TradingThe Supports and Resistances Multi Timeframe - VK Trading indicator is designed to help traders identify key support and resistance levels across multiple timeframes. It integrates real-time market data with smooth, customizable visual markers, allowing traders to quickly spot potential entry and exit points. This tool is particularly valuable for trend-following traders who want to see the most critical levels of price action on various timeframes.
Features:
Multi-Timeframe Support: Display support and resistance levels for the current, first, and second timeframes, helping traders identify price points across different market cycles.
Customizable Appearance: Choose from various colors for levels and bands, as well as transparency settings to match your chart's design.
ATR-based Bands: Uses the Average True Range (ATR) to dynamically adjust the width of support and resistance bands, offering more accurate price movement insights.
Pivot Points: Identifies pivot highs and lows, offering precise support and resistance levels based on the price action.
Smoothing Options: Customize the ATR smoothing method with options like RMA, SMA, EMA, and WMA for better alignment with your trading strategy.
Functionalities:
Quick Level Detection: The indicator highlights the most recent high and low levels on the current timeframe, ensuring you’re always aware of nearby price barriers.
Support and Resistance Visualization: Easily visualize the major support and resistance levels on multiple timeframes, improving decision-making and trade management.
Dynamic Band Widths: Customize the ATR multiplier for each timeframe, adapting the support and resistance bands based on the volatility of the market.
Multi-Timeframe Integration: View price action levels from a broader perspective with support and resistance data from the current, first, and second timeframes all in one chart.
Flexible Timeframe Selection: Choose your preferred timeframes for support and resistance levels, from daily, weekly, to monthly, for broader or narrower market views.
How it Helps Traders:
This indicator is ideal for traders who rely on multi-timeframe analysis to make well-informed trading decisions. By visualizing key support and resistance levels across several timeframes, traders can improve the precision of their entries and exits, better manage risk, and enhance their market timing. The tool provides a comprehensive view of price action, allowing traders to spot potential reversals and breakouts, making it easier to execute strategies effectively.
Disclaimer:
This script is an educational and analytical tool. It does not guarantee specific results or eliminate trading risk. Trading in the financial markets involves significant risks; use this script at your own risk.

Nimu Market on DemandNimu Market On Demand is an innovative tool designed to provide a visual representation of market demand levels on a scale of 1 to 100. This scale is displayed at specific intervals , making it easy for users to understand market demand fluctuations in real time.
To enhance analysis, Nimu Market On Demand also incorporates the Relative Strength Index (RSI) with key thresholds at . RSI is a widely-used technical indicator that measures market strength and momentum, offering insights into overbought (excessive buying) or oversold (excessive selling) conditions.
The combination of the Demand graph and RSI enables users to:
Identify the right time to buy when the RSI falls below 30, signaling an oversold condition.
Determine the optimal time to sell when the RSI rises above 70, indicating an overbought condition.
With an integrated visualization, users can effortlessly observe demand patterns and combine them with RSI signals to make smarter and more strategic trading decisions. This tool is designed to help traders and investors maximize opportunities in a dynamic market environment.

Profitability Visualization with Bid-Ask Spread ApproximationOverview
The " Profitability Visualization with Bid-Ask Spread Approximation " indicator is designed to assist traders in assessing potential profit and loss targets in relation to the current market price or a simulated entry price. It provides flexibility by allowing users to choose between two methods for calculating the offset from the current price:
Bid-Ask Spread Approximation: The indicator attempts to estimate the bid-ask spread by using the highest (high) and lowest (low) prices within a given period (typically the current bar or a user-defined timeframe) as proxies for the ask and bid prices, respectively. This method provides a dynamic offset that adapts to market volatility.
Percentage Offset: Alternatively, users can specify a fixed percentage offset from the current price. This method offers a consistent offset regardless of market conditions.
Key Features
Dual Offset Calculation Methods: Choose between a dynamic bid-ask spread approximation or a fixed percentage offset to tailor the indicator to your trading style and market analysis.
Entry Price Consideration: The indicator can simulate an entry price at the beginning of each trading session (or the first bar on the chart if no sessions are defined). This feature enables a more realistic visualization of potential profit and loss levels based on a hypothetical entry point.
Profit and Loss Targets: When the entry price consideration is enabled, the indicator plots profit target (green) and loss target (red) lines. These lines represent the price levels at which a trade entered at the simulated entry price would achieve a profit or incur a loss equivalent to the calculated offset amount.
Offset Visualization: Regardless of whether the entry price is considered, the indicator always displays upper (aqua) and lower (fuchsia) offset lines. These lines represent the calculated offset levels based on the chosen method (bid-ask approximation or percentage offset).
Customization: Users can adjust the percentage offset, toggle the bid-ask approximation and entry price consideration, and customize the appearance of the lines through the indicator's settings.
Inputs
useBidAskApproximation A boolean (checkbox) input that determines whether to use the bid-ask spread approximation (true) or the percentage offset (false). Default is false.
percentageOffset A float input that allows users to specify the percentage offset to be used when useBidAskApproximation is false. The default value is 0.63.
considerEntryPrice A boolean input that enables the consideration of a simulated entry price for calculating and displaying profit and loss targets. Default is true.
Calculations
Bid-Ask Approximation (if enabled): bidApprox = request.security(syminfo.tickerid, timeframe.period, low) Approximates the bid price using the lowest price (low) of the current period. askApprox = request.security(syminfo.tickerid, timeframe.period, high) Approximates the ask price using the highest price (high) of the current period. spreadApprox = askApprox - bidApprox Calculates the approximate spread.
Offset Amount: offsetAmount = useBidAskApproximation ? spreadApprox / 2 : close * (percentageOffset / 100) Determines the offset amount based on the selected method. If useBidAskApproximation is true, the offset is half of the approximated spread; otherwise, it's the current closing price (close) multiplied by the percentageOffset.
Entry Price (if enabled): var entryPrice = 0.0 Initializes a variable to store the entry price. if considerEntryPrice Checks if entry price consideration is enabled. if barstate.isnew Checks if the current bar is the first bar of a new session. entryPrice := close Sets the entryPrice to the closing price of the first bar of the session.
Profit and Loss Targets (if entry price is considered): profitTarget = entryPrice + offsetAmount Calculates the profit target price level. lossTarget = entryPrice - offsetAmount Calculates the loss target price level.
Plotting
Profit Target Line: Plotted in green (color.green) with a dashed line style (plot.style_linebr) and increased linewidth (linewidth=2) when considerEntryPrice is true.
Loss Target Line: Plotted in red (color.red) with a dashed line style (plot.style_linebr) and increased linewidth (linewidth=2) when considerEntryPrice is true.
Upper Offset Line: Always plotted in aqua (color.aqua) to show the offset level above the current price.
Lower Offset Line: Always plotted in fuchsia (color.fuchsia) to show the offset level below the current price.
Limitations
Approximation: The bid-ask spread approximation is based on high and low prices and may not perfectly reflect the actual bid-ask spread of a specific broker, especially during periods of high volatility or low liquidity.
Simplified Entry: The entry price simulation is basic and assumes entry at the beginning of each session. It does not account for specific entry signals or order types.
No Order Execution: This indicator is purely for visualization and does not execute any trades.
Data Discrepancies: The high and low values used for approximation might not always align with real-time bid and ask prices due to differences in data aggregation and timing between TradingView and various brokers.
Disclaimer
This indicator is for educational and informational purposes only and should not be considered financial advice. Trading involves substantial risk, and past performance is not indicative of future results. Always conduct thorough research and consider your own risk tolerance before making any trading decisions. It is recommended to combine this indicator with other technical analysis tools and a well-defined trading strategy.

Order Blocks - VK TradingOrder Blocks - VK Trading
This script in Pine Script identifies and highlights Order Blocks, key tools in institutional trading. Designed for traders of all levels, it provides clear and customizable visualization, helping you anticipate market movements with greater accuracy.
Key Features:
Order Block Visualization: Highlights relevant bullish and bearish zones directly on the chart.
Customizable Settings: Adjust sensitivity, colors, and other parameters to suit your analysis needs.
Dual Block Detection: Uses two independent settings to cover different market perspectives.
Visual Alerts: Automatic line drawing for key levels.
Automatic Clearing: Dynamic clearing of already invalidated blocks.
User Benefits:
Clear Visual Analysis: Identifies key supply and demand points used by institutions.
Improved Trading Decisions: Anticipate entry and exit zones more accurately.
Time Saver: Automates level plotting, allowing you to focus on strategy and execution.
Strategy Adaptability: Compatible with Smart Money, Wyckoff, and Price Action approaches.
Disclaimer:
This script is an educational and analytical tool. It does not guarantee specific results or eliminate trading risk. Trading in the financial markets involves significant risks; use this script at your own risk.

OBV Divergence Indicator [TradingFinder] On-Balance Vol Reversal🔵 Introduction
The On-Balance Volume (OBV) indicator, introduced by Joe Granville in 1963, is a powerful technical analysis tool used to measure buying and selling pressure based on trading volume and price.
By aggregating trading volume—adding it on positive days and subtracting it on negative days—OBV creates a cumulative line that reflects market volume pressure, making it valuable for confirming trends, identifying entry and exit points, and forecasting potential price movements.
Divergences between price and OBV often provide significant signals. A bearish divergence occurs when the price forms higher highs while the OBV line forms lower highs. This discrepancy indicates that upward momentum is weakening, increasing the likelihood of a downward trend.
In contrast, a bullish divergence happens when the price makes lower lows, but the OBV line forms higher lows. This suggests increasing buying pressure and the potential for an upward trend reversal.
For instance, if the price is rising but the OBV trendline is falling, it may signal a bearish divergence, warning of a possible price decline. Conversely, if the price is falling while the OBV line is rising, this could signal a bullish divergence, indicating a possible price recovery. These signals are particularly useful for identifying market turning points.
OBV often acts as a leading indicator, moving ahead of price changes. For example, a rising OBV alongside stable or declining prices can signal an impending upward breakout.
Conversely, a declining OBV with rising prices may indicate that the current uptrend is losing strength. Traders using this strategy often consider entering positions at breakout levels while setting stop losses near recent swing highs or lows to manage risk effectively.
This integration highlights how OBV divergences can provide actionable insights for predicting price movements and managing trades efficiently.
Bullish Divergence :
Bearish Divergence :
🔵 How to Use
The OBV indicator, as a cumulative tool, assists analysts in comparing volume and price changes to identify new trends and key levels for entering or exiting trades. Beyond confirming existing trends, it is particularly effective in analyzing positive and negative divergences between price and volume, providing valuable signals for trading decisions.
🟣 Bullish Divergence
A bullish divergence occurs when the price continues its downward or stable trend, but the OBV line starts rising, forming a higher low compared to its previous low. This suggests increasing volume on up days relative to down days and often signals a reversal to the upside.
For instance, if an asset's price stabilizes near a support level but the OBV line shows an upward trend, this divergence could present an opportunity to enter a long position.
🟣 Bearish Divergence
A bearish divergence occurs when the price forms higher highs, but the OBV line declines, creating lower highs compared to previous peaks. This indicates decreasing volume on up days relative to down days and often acts as a warning for a reversal to the downside.
For example, if an asset’s price approaches a resistance level while OBV starts declining, this divergence may signal the beginning of a downtrend and could indicate a good time to exit long trades or enter short positions.
🔵 Setting
Period : The "Period" setting allows you to define the number of bars or intervals for "Periodic" and "EMA" modes. A shorter period captures more short-term movements, while a longer period smooths out the fluctuations and provides a broader view of market trends.
You can enable or disable labels to highlight key levels or divergences and tables to show numerical details like values and divergence types. These options allow for a customized chart display.
🔵 Table
The following table breaks down the main features of the oscillator. It covers four critical categories: Exist, Consecutive, Divergence Quality, and Change Phase Indicator.
Exist : If divergence is detected, a "+" will appear in this row.
Consecutive: Shows the number of consecutive divergences that have formed in a short period.
Divergence Quality : Evaluates the quality of the divergence based on the number of occurrences. One is labeled "Normal," two are "Good," and three or more are considered "Strong."
Change Phase Indicator : If a phase change is detected between two oscillation peaks, this is marked in the table.
🔵 Conclusion
The OBV (On Balance Volume) indicator is a simple yet effective tool in technical analysis that combines volume and price changes to provide a comprehensive view of market buying and selling pressure. By identifying positive and negative divergences, OBV enables analysts to detect early signs of trend reversals and refine their trading strategies.
Divergences in OBV often precede price changes, making it a leading indicator for predicting market movements. Using OBV alongside other technical tools can enhance decision-making accuracy and help traders identify better entry and exit points. However, it is essential to consider the limitations of OBV, such as the potential for signal errors and the impact of sudden news events.
Ultimately, OBV serves as a complementary tool in technical analysis, aiding in trend identification, signal confirmation, and risk management. A thoughtful application of this indicator, in combination with other analytical tools, can create valuable opportunities for profiting in financial markets.

Bitcoin Pi Cycle TrackerThe Bitcoin Pi Cycle Tracker is based on the widely recognized Pi Cycle Top Indicator, a concept used to identify potential market cycle tops in Bitcoin's price. This implementation combines the 111-day Simple Moving Average (SMA) and the 350-day SMA (multiplied by 2) to detect key crossover points. When the 111-day SMA crosses above the 350-day SMA x2, it signals a potential market peak.
Key Features:
Plots the 111-day SMA (blue) and the 350-day SMA x2 (red) for clear visualization.
Displays visual markers and vertical lines at crossover points to highlight key moments.
Sends alerts for crossovers, helping traders stay ahead of market movements.
This tool is an implementation of the Pi Cycle concept originally popularized by Bitcoin market analysts. Use it to analyze historical price cycles and prepare for significant market events. Please note that while the Pi Cycle Indicator has been historically effective, it should be used alongside other tools for a comprehensive trading strategy.

Multi-Timeframe Liquidity LevelsMulti-Timeframe Liquidity Levels – Overview
The Multi-Timeframe Liquidity Levels indicator automatically displays significant highs and lows from various timeframes (Daily, Weekly, Monthly, and Quarterly) on your current chart. This allows traders to quickly identify potential support and resistance zones without frequently switching between different timeframe charts. Additionally, the script offers extra lines for special reference points (e.g., the “Midnight” midpoint of the current day and the previous day’s open/close) to highlight potential liquidity zones even more clearly.
1. Core Idea and Benefits
Time-Saving: Instead of manually reviewing charts in different timeframes, the indicator fetches relevant high/low levels automatically and shows them on your active timeframe.
Clear Layout: Traders instantly see where the Daily, Weekly, Monthly, and Quarterly highs and lows lie—areas often associated with institutional orders or liquidity hunts.
Customizable: You can tailor the color scheme, line style (Solid, Dashed, Dotted), and line width, ensuring the displayed levels fit your personal charting style.
2. How It Works
Multi-Timeframe High/Low
For each timeframe (Day, Week, Month, Quarter), the indicator references the previous candle’s high and low (high , low ).
Using request.security(...), these values are plotted on the chart you’re currently viewing.
Flexible Display
You can individually enable or disable the Daily, Weekly, Monthly, and Quarterly lines, depending on which levels are most relevant to your trading.
With Line Style (Solid, Dashed, Dotted) and Line Width, you can easily emphasize certain lines you consider more important.
Additional Lines
“Midnight” Line: A theoretical midpoint between today’s high and low, which can be useful for gauging daily pivot areas.
Previous Day’s Open/Close: Many traders track these reference points to anticipate market reactions. You can show or hide these lines as desired.
Automatic Line Removal & Creation
When a particular timeframe (e.g., “Show Monthly Levels”) is disabled, the script automatically removes the existing monthly lines.
Enabling it again recreates those lines without hassle.
3. Usage and Interpretation
Identifying Support and Resistance
Highs and lows from higher timeframes are often key zones for entries, exits, or major market reactions.
A Daily level may be crucial for short-term traders, whereas Monthly or Quarterly levels can indicate long-term liquidity areas.
Spotting Market Shifts
If price decisively moves above a Higher-Timeframe line, it could signal strong momentum.
Conversely, a failed breakout (where price quickly returns under or above a level) might warn of a potential reversal.
Extra Lines as Filters
The “Midnight” Line helps visualize a rough central price for the current day, aiding in intraday directional bias.
Previous Day’s Open/Close: Common reference points for day traders, where swift approaches and rejections can indicate potential entries or partial take-profit zones.
4. Practical Tips
Use Color-Coding Wisely: Assign distinct colors (e.g., Blue for Daily, Green for Weekly, Orange for Monthly, Purple for Quarterly) so you can easily discern which timeframe you’re looking at.
Toggle On/Off As Needed: Day traders might focus on Daily and Weekly, while long-term traders may pay closer attention to Monthly and Quarterly.
Combine with Price Action: Lines alone don’t constitute a trading strategy. Use them alongside candlestick patterns, volume analysis, or other indicators for a more complete market perspective.
5. Important Notes & Recommendations
Not Financial Advice: This indicator simply reflects historical high/low data across multiple timeframes and does not constitute a buy or sell recommendation.
Trader Responsibility: Observe how the market actually behaves around these lines and adapt your risk management accordingly.

[Marmotte] Support & ResistanceDynamic Support/Resistance Indicator
Available on charts of all symbols, not just Bitcoin.
Timeframe
The chart time to base the support/resistance values on.
This value cannot be less than the current chart timeframe.
ex) Current chart timeframe = 15 minutes, option value = 60 (1 hour) O
ex) Current chart timeframe = 4 hours, option = 60 (1 hour) X
Mode
This is how support/resistance values are calculated.
The “Pivot” option takes the PivotHigh and PivotLow for a specific period of time (number of candles).
The “Normal” option is used to get the Highest and Lowest for a specific time period (number of candles).
Lookback Candle
When set to 20 and the “Pivot” option is selected, the highest price of the 20 candles before the specific candle is selected.
If set to 20 and the “Normal” option is selected, the highest price of the 20 candles before the current candle is selected.
Sensitivity
This option only applies when “General” is selected.
Different support/resistance values calculated based on sensitivity
Extract the reference high/low for the “Lookback Candle” in the selected “Timeframe” based on the “Mode”.
Compare the Bar Index (candle order) of the extracted reference high/low and divide the upside/downside (ex: up if the reference low came before the reference high, down if the reference high came before the reference low, etc.).
Now, based on the baseline high/low and up/down, calculate the , and plot them on the chart.
Updates the extracted values based on the “base value” when the reference high/low for the “calculation period (number of candles)” in the selected “chart time” changes.
The indicator is built with simple logic that automatically identifies tops and bottoms, and then calculates and plots the corresponding Fibonacci retracements and extensions.
Therefore, it is not recommended to trade blindly on the support/resistance plotted by the indicator.
The indicator can be used to enhance the ability of support-resistance lines or to reference support-resistance on longer time frames from shorter time frames. For example, you can set up a 4-hour support/resistance on a 15-minute timeframe. This way, you can see the support/resistance of a higher timeframe that looks like a pullback/recovery in the short term, but is more reliable and can be used as a reference for trading.
The recommended time frame is 4 hour.
Please note that this may not work properly on symbols with too small an amount (e.g. it does not work properly on symbols like 0.005$)
-------------------------------------------------
동적 지지/저항선 인디케이터
비트코인뿐 아니라 모든 심볼의 차트에서 사용가능합니다.
차트 시간
지지/저항 값을 계산에 기본이 될 차트 시간입니다.
이 값은 현재 차트 타임프레임보다 작을 수 없습니다.
ex) 현재 차트 타임프레임 = 15분, 옵션값 = 60(1시간) O
ex) 현재 차트 타임프레임 = 4시간, 옵션값 = 60(1시간) X
베이스 값
지지/저항 값을 계산하는 방법입니다.
"피봇고저" 옵션은 특정 기간(캔들 수)의 PivotHigh, PivotLow를 구하여 사용합니다.
"일반고저" 옵션은 특정 기간(캔들 수)의Highest, Lowest를 구하여 사용합니다.
계산 기간
20으로 설정 후 "Pivot" 옵션을 선택한 경우, 특정 캔들 이전 20개의 캔들 중 해당 캔들이 제일 고가가 높을 때 선택
20으로 설정 후 "Normal" 옵션을 선택한 경우, 현재 캔들 이전 20개의 캔들 중 가장 고가 선택
민감도
해당 옵션은 "Normal"를 선택했을때만 적용됩니다.
민감도에 따라 계산되는 지지/저항 값이 다름
선택한 "차트 시간"에서 "계산 기간(캔들 수)" 동안의 기준 고가/저가를 "모드"에 기반하여 추출합니다.
추출된 기준 고가/저가의 Bar Index(캔들 순서)를 비교하여 상승/하락을 나눕니다. (ex. 기준 저가가 기준 고가보다 먼저 나왔다면 상승, 기준 고가가 기준 저가보다 먼저 나왔다면 하락)
이제 기준 고가/저가와 상승/하락을 토대로 , 을 계산하여 차트에 그립니다.
선택한 "차트 시간"에서 "계산 기간(캔들 수)" 동안의 기준 고가/저가를 "모드"에 기반하여 추출한 값이 변경될 때 업데이트 됩니다.
해당 지표는 고점과 저점을 자동으로 식별하여 상승/하락을 파악 후 그에 맞는 피보나치 되돌림 및 확장을 계산하여 그려주는 간단한 로직으로 만들어졌습니다.
그렇기에 해당 지표에서 그려주는 지지/저항을 맹목적으로 믿고 트레이딩에 임하는 것은 권장하지 않습니다.
해당 지표는 지지저항선의 능력을 키우거나 단기 프레임에서 장기 프레임의 지지저항을 참고하는데 사용할 수 있습니다. 예를 들어서 15분 타임프레임에서 4시간 지지/저항을 설정하여 확인할 수 있습니다. 이렇게되면 단기적으로는 하락/상승처럼 보이지만, 비교적 신뢰도가 더 높은 상위 타임프레임의 지지/저항을 확인하여 매매에 참고로 사용할 수 있습니다.
권장 타임 프레임은 1시간 입니다.
너무 금액이 작은 심볼에선 제대로 동작하지 않을 수 있습니다. (ex. 0.005$와 같은 심볼에서는 제대로 작동하지 않음)

Intelligent Support & Resistance Lines (MTF)This script automatically detects and updates key Support & Resistance (S/R) levels using a higher timeframe (MTF) approach. By leveraging volume confirmation, levels are only identified when significant volume (relative to the SMA of volume) appears. Each level is drawn horizontally in real time, and whenever the market breaks above a resistance level (and retests it), the script automatically converts that resistance into support. The opposite occurs if the market breaks below a support level.
Key Features:
Multi-Timeframe (MTF) Data
Select a higher timeframe for more robust S/R calculations.
The script fetches High, Low, Volume, and SMA of Volume from the chosen timeframe.
Automatic Role Reversal
Resistance becomes Support if a breakout retest occurs.
Support becomes Resistance if a breakdown retest occurs.
Dynamic Line Width & Labeling
Each S/R line’s thickness increases with additional touches, making frequently tested levels easier to spot.
Labels automatically display the number of touches (e.g., “R 3” or “S 2”) and can have adjustable text size.
Volume Threshold
Only significant pivots (where volume exceeds a specified multiplier of average volume) are plotted, reducing noise.
Horizontal Offset for Clarity
Lines are drawn with timestamps instead of bar_index, ensuring that old levels remain visible without chart limitations.
Adjustable Maximum Levels
Maintain a clean chart by limiting how many S/R lines remain at once.
How It Works:
Pivot Detection: The script identifies swing highs and lows from the higher timeframe (timeframeSR).
Volume Check: Only pivots with volume ≥ (SMA Volume * volumeThreshold) qualify.
Line Creation & Updates: New lines are drawn at these pivots, labeled “R #” or “S #,” indicating how many times they’ve been touched.
Role Reversal: If price breaks above a resistance and retests it from above, that line is removed from the resistance array and re-created in the support array (and vice versa).
Inputs:
Timeframe for S/R: Choose the higher timeframe for S/R calculations.
Swing Length: Number of bars to consider in a pivot calculation.
Minimum Touches: Minimum required touches before drawing or updating a level.
Volume Threshold (Multiplier): Determines how much volume (relative to SMA) is needed to confirm a pivot.
Maximum Number of Levels: Caps how many S/R lines can be shown at once.
Color for Resistance & Color for Support: Customize your preferred colors for lines and labels.
Label Size: Select from "tiny", "small", "normal", "large", or "huge" to resize the labels.
Disclaimer:
This script is intended for educational purposes and should not be interpreted as financial or investment advice. Always conduct your own research or consult a qualified professional before making trading decisions.

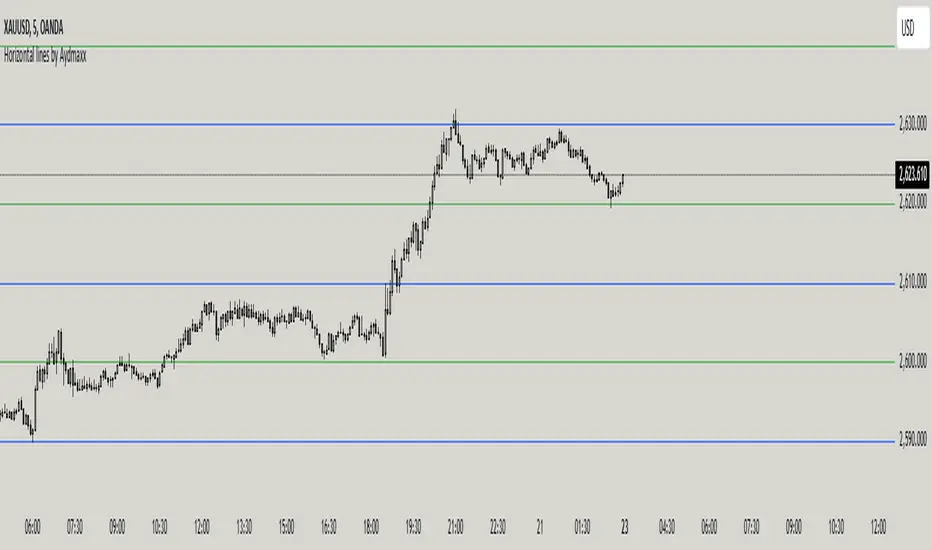
Horizontal lines by AydmaxxIndicator Description: Horizontal Lines by Aydmaxx
This indicator plots customizable horizontal lines on the chart to assist with technical analysis. It allows traders to define a starting price and a step size (gap) between the lines, making it versatile for a variety of strategies, such as identifying support, resistance, or key price levels.
How to Use:
Starting Price (Bottom): Enter the price level where the first (lowest) line should begin. This is your base level.
Example: If you're analyzing a market with prices around 2550, you can set this value to 2550 to align the indicator with your focus.
Gap (Step Size): Specify the interval or step size between consecutive lines.
Example: If you want lines every 10 points, set this value to 10.
Number of Lines: Adjust the total number of lines to display on the chart.
Line Style and Width: Customize the appearance of the lines (solid, dashed, dotted) and their thickness.
Line Colors and Transparency: Choose primary and secondary colors for alternating lines, and adjust the transparency to match your visual preferences.
This indicator is ideal for visualizing price zones and can be tailored to suit any trading style. Adjust the parameters based on your market analysis to highlight key price levels effectively.
Fibonacci Time-Price Zones🟩 Fibonacci Time-Price Zones is a chart visualization tool that combines Fibonacci ratios with time-based and price-based geometry to analyze market behavior. Unlike typical Fibonacci indicators that focus solely on horizontal price levels, this indicator incorporates time into the analysis, providing a more dynamic perspective on price action.
The indicator offers multiple ways to visualize Fibonacci relationships. Drawing segmented circles creates a unique perspective on price action by incorporating time into the analysis. These segmented circles, similar to TradingView's built-in Fibonacci Circles, are derived from Fibonacci time and price levels, allowing traders to identify potential turning points based on the dynamic interaction between price and time.
As another distinct visualization method, the indicator incorporates orthogonal patterns, created by the intersection of horizontal and vertical Fibonacci levels. These intersections form L-shaped connections on the chart, derived from key Fibonacci price and time intervals, highlighting potential areas of support or resistance at specific points in time.
In addition to these geometric approaches, another option is sloped lines, which project Fibonacci levels that account for both time and price along the trendline. These projections derive their angles from the interplay between Fibonacci price levels and Fibonacci time intervals, creating dynamic zones on the chart. The slope of these lines reflects the direction and angle of the trend, providing a visual representation of price alignment with market direction, while maintaining the time-price relationship unique to this indicator
The indicator also includes horizontal Fibonacci levels similar to traditional retracement and extension tools. However, unlike standard tools, traders can display retracement levels, extension levels, or both simultaneously from a single instance of the indicator. These horizontal levels maintain consistency with the chosen visualization method, automatically scaling and adapting whether used with circles, orthogonal patterns, or slope-based analysis.
By combining these distinct methods—circles, orthogonal patterns, sloped projections, and horizontal levels—the indicator provides a comprehensive approach to Fibonacci analysis based on both time and price relationships. Each visualization method offers a unique perspective on market structure while maintaining the core principle of time-price interaction.
⭕ THEORY AND CONCEPT ⭕
While traditional Fibonacci tools excel at identifying potential support and resistance levels through price-based ratios (0.236, 0.382, 0.618), they do not incorporate the dimension of time in market analysis. Extensions and retracements effectively measure price relationships within trends, yet markets move through both price and time dimensions simultaneously.
Fibonacci circles represent an evolution in technical analysis by incorporating time intervals alongside price levels. Based on the mathematical principle that markets often move in circular patterns proportional to Fibonacci ratios, these circles project potential support and resistance zones as partial circles radiating from significant price points. However, traditional circle-based tools can create visual complexity that obscures key market relationships. The integration of time into Fibonacci analysis reveals how price movements often respect both temporal and price-based ratios, suggesting a deeper geometric structure to market behavior.
The Fibonacci Time-Price Zones indicator advances these concepts by providing multiple geometric approaches to visualize time-price relationships. Each shape option—circles, orthogonal patterns, slopes, and horizontal levels—represents a different mathematical perspective on how Fibonacci ratios manifest across both dimensions. This multi-faceted approach allows traders to observe how price responds to Fibonacci-based zones that account for both time and price movements, potentially revealing market structure that purely price-based tools might miss.
Shape Options
The indicator employs four distinct geometric approaches to analyze Fibonacci relationships across time and price dimensions:
Circular : Represents the cyclical nature of market movements through partial circles, where each radius is scaled by Fibonacci ratios incorporating both time and price components. This geometry suggests market movements may follow proportional circular paths from significant pivot points, reflecting the harmonic relationship between time and price.
Orthogonal : Constructs L-shaped patterns that separate the time and price components of Fibonacci relationships. The horizontal component represents price levels, while the vertical component measures time intervals, allowing analysis of how these dimensions interact independently at key market points.
Sloped : Projects Fibonacci levels along the prevailing trend, incorporating both time and price in the angle of projection. This approach suggests that support and resistance levels may maintain their relationship to price while adjusting to the temporal flow of the market.
Horizontal : Provides traditional static Fibonacci levels that serve as a reference point for comparing price-only analysis with the dynamic time-price relationships shown in the other three shapes. This baseline approach allows traders to evaluate how the incorporation of time dimension enhances or modifies traditional Fibonacci analysis.
By combining these geometric approaches, the Fibonacci Time-Price Zones indicator creates a comprehensive analytical framework that bridges traditional and advanced Fibonacci analysis. The horizontal levels serve as familiar reference points, while the dynamic elements—circular, orthogonal, and sloped projections—reveal how price action responds to temporal relationships. This multi-dimensional approach enables traders to study market structure through various geometric lenses, providing deeper insights into time-price symmetry within technical analysis. Whether applied to retracements, extensions, or trend analysis, the indicator offers a structured methodology for understanding how markets move through both price and time dimensions.
🛠️ CONFIGURATION AND SETTINGS 🛠️
The Fibonacci Time-Price Zones indicator offers a range of configurable settings to tailor its functionality and visual representation to your specific analysis needs. These options allow you to customize zone visibility, structures, horizontal lines, and other features.
Important Note: The indicator's calculations are anchored to user-defined start and end points on the chart. When switching between charts with significantly different price scales (e.g., from Bitcoin at $100,000 to Silver at $30), adjustment of these anchor points is required to ensure correct positioning of the Fibonacci elements.
Fibonacci Levels
The indicator allows users to customize Fibonacci levels for both retracement and extension analysis. Each level can be individually configured with the following options:
Visibility : Toggle the visibility of each level to focus on specific areas of interest.
Level Value : Set the Fibonacci ratio for the level, such as 0.618 or 1.000, to align with your analysis needs.
Color : Customize the color of each level for better visual clarity.
Line Thickness : Adjust the line thickness to emphasize critical levels or maintain a cleaner chart.
Setup
Zone Type : Select which Fibonacci zones to display:
- Retracement : Shows potential pull back levels within the trend
- Extension : Projects levels beyond the trend for potential continuation targets
- Both : Displays both retracement and extension zones simultaneously
Shape : Choose from four visualization methods:
- Circular : Time-price based semicircles centered on point B
- Orthogonal : L-shaped patterns combining time and price levels
- Sloped : Trend-aligned projections of Fibonacci levels
- Horizontal : Traditional horizontal Fibonacci levels
Visual Settings
Fill % : Adjusts the fill intensity of zones:
0% : No fill between levels
100% : Maximum fill between levels
Lines :
Trendline : The base A-B trend with customizable color
Extension : B-C projection line
Retracement : B-D pullback line
Labels :
Points : Show/hide A, B, C, D markers
Levels : Show/hide Fibonacci percentages
Time-Price Points
Set the time and price for the points that define the Fibonacci zones and horizontal levels. These points are defined upon loading the chart. These points can be configured directly in the settings or adjusted interactively on the live chart.
A and B Points : These user-defined time and price points determine the basis for calculating the semicircles and Fibonacci levels. While the settings panel displays their exact values for fine-tuning, the easiest way to modify these points is by dragging them directly on the chart for quick adjustments.
Interactive Adjustments : Any changes made to the points on the chart will automatically synchronize with the settings panel, ensuring consistency and precision.
🖼️ CHART EXAMPLES 🖼️
Fibonacci Time-Price Zones using the 'Circular' Shape option. Note the price interaction at the 0.786 level, which acts as a support zone. Additional points of interest include resistance near the 0.618 level and consolidation around the 0.5 level, highlighting the utility of both horizontal and semicircular Fibonacci projections in identifying key price areas.
Fibonacci Time-Price Zones using the 'Sloped' Shape option. The chart displays price retracing along the sloped Fibonacci levels, with blue arrows highlighting potential support zones at 0.618 and 0.786, and a red arrow indicating potential resistance at the 1.0 level. This visual representation aligns with the prevailing downtrend, suggesting potential selling pressure at the 1.0 Fibonacci level.
Fibonacci Time-Price Zones using the 'Orthogonal' Shape option. The chart demonstrates price action interacting with vertical zones created by the orthogonal lines at the 0.618, 0.786, and 1.0 Fibonacci levels. Blue arrows highlight potential support areas, while red arrows indicate potential resistance areas, revealing how the orthogonal lines can identify distinct points of price interaction.
Fibonacci Time-Price Zones using the 'Circular' Shape option. The chart displays price action in relation to segmented circles emanating from the starting point (point A). The circles represent different Fibonacci ratios (0.382, 0.5, 0.618, 0.786) and their intersections with the price axis create potential zones of support and resistance. This approach offers a visually distinct way to analyze potential turning points based on both price and time.
Fibonacci Time-Price Zones using the 'Sloped' Shape option. The sloped Fibonacci levels (0.786, 0.618, 0.5) create zones of potential support and resistance, with price finding clear interaction within these areas. The ellipses highlight this price action, particularly the support between 0.786 and 0.618, which aligns closely with the trend.
Fibonacci Time-Price Zones using the 'Circular' Shape option. The price action appears to be ‘hugging’ the 0.5 Fibonacci level, suggesting potential resistance. This demonstrates how the circular zones can identify potential turning points and areas of consolidation which might not be seen with linear analysis.
Fibonacci Time-Price Zones using the 'Sloped' Shape option with Point D marker enabled. The chart demonstrates clear price action closely following along the sloped Retracement line until the orthogonal intersection at the 0.618 levels where the trend is broken and price dips throughout the 0.618 to 0.786 horizontal zone. Price jumps back to the retracement slope at the start of the 0.786 horizontal zone and continues to the 1.0 horizontal zone. The aqua-colored retracement line is enabled to further emphasize this retracement slope .
Geometric validation using TradingView's built-in Fibonacci Circle tool (overlaid). The alignment at the 0.5 and 1.0 levels demonstrates the indicator's consistent approximation of Fibonacci Circles.
Comparison of Fibonacci Time-Price Zones (Shape: Horizontal) with TradingView's Built-in Retracement and Extension Tools (overlaid): This example demonstrates how the Horizontal structure aligns with TradingView’s retracement and extension levels, allowing users to integrate multiple tools seamlessly. The Fibonacci circle connects retracement and extension zones, highlighting the potential relationship between past retracements and future extensions.
📐 GEOMETRIC FOUNDATIONS 📐
This indicator integrates circular and straight representations of Fibonacci levels, specifically the Circular , Orthogonal , Sloped , and Horizontal shape options. The geometric principles behind these shapes differ significantly, requiring distinct scaling methods for accurate representation. The Circular shape employs logarithmic scaling with radial expansion, where the distance from a central point determines the level's position, creating partial circles that align with TradingView's built-in Fibonacci Circle tool. The other three shapes utilize geometric progression scaling for linear extension from a starting point, resulting in straight lines that align with TradingView's built-in Fibonacci retracement and extension tools. Due to these distinct geometric foundations and scaling methods, perfectly aligning both the partial circles and straight lines simultaneously is mathematically constrained, though any differences are typically visually imperceptible.
The Circular shape's partial circles are calculated and scaled to align with TradingView's built-in Fibonacci Circles. These circles are plotted from the second swing point onward. This approach ensures consistent and accurate visualization across all market types, including those with gaps or closed sessions, which unlike 24/7 markets, do not have a direct one-to-one correspondence between bar indices and time. To maintain accurate geometric proportions across varying chart scales, the indicator calculates an aspect ratio by normalizing the proportional difference between vertical (price) and horizontal (time) distances of the swing points. This normalization factor ensures geometric shapes maintain their mathematical properties regardless of price scale magnitude or time period span, while maintaining the correct proportions of the geometric constructions at any chart zoom level.
The indicator automatically applies the appropriate scaling factor based on the selected shape option, optimizing either circular proportions and proper radius calculations for each Fibonacci level, or straight-line relationships between Fibonacci levels. These distinct scaling approaches maintain mathematical integrity while preserving the essential characteristics of each geometric representation, ensuring optimal visualization accuracy whether using circular or linear shapes.
⚠️ DISCLAIMER ⚠️
The Fibonacci Time-Price Zones indicator is a visual analysis tool designed to illustrate Fibonacci relationships through geometric constructions incorporating both curved and straight lines, providing a structured framework for identifying potential areas of price interaction. It is not intended as a predictive or standalone trading signal indicator.
The indicator calculates levels and projections using user-defined anchor points and Fibonacci ratios. While it aims to align with TradingView’s Fibonacci extension, retracement, and circle tools by employing mathematical and geometric formulas, no guarantee is made that its calculations are identical to TradingView's proprietary methods.
Like all technical and visual indicators, these visual representations may visually align with key price zones in hindsight, reflecting observed price dynamics. However, these visualizations are not standalone signals for trading decisions and should be interpreted as part of a broader analytical approach.
This indicator is intended for educational and analytical purposes, complementing other tools and methods of market analysis. Users are encouraged to integrate it into a comprehensive trading strategy, customizing its settings to suit their specific needs and market conditions.
🧠 BEYOND THE CODE 🧠
The Fibonacci Time-Price Zones indicator is designed to encourage both education and community engagement. By integrating time-sensitive geometry with Fibonacci-based frameworks, it bridges traditional grid-based analysis with dynamic time-price relationships. The inclusion of semicircles, horizontal levels, orthogonal structures, and sloped trends provides users with versatile tools to explore the interaction between price movements and temporal intervals while maintaining clarity and adaptability.
As an open-source tool, the indicator invites exploration, experimentation, and customization. Whether used as a standalone resource or alongside other technical strategies, it serves as a practical and educational framework for understanding market structure and Fibonacci relationships in greater depth.
Your feedback and contributions are essential to refining and enhancing the Fibonacci Time-Price Zones indicator. We look forward to the creative applications, adaptations, and insights this tool inspires within the trading community.

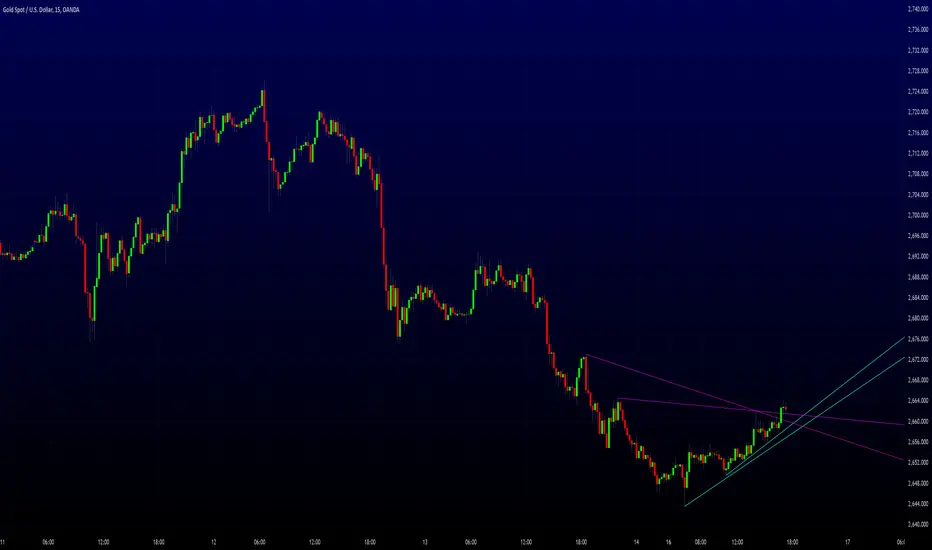
Auto Trend Line (ATL) IndicatorAuto Trend Line (ATL) Indicator
Description:
The Auto Trend Line indicator is an useful tool designed to automatically identify and draw key support and resistance levels on your chart. These levels are calculated based on historical price action, providing traders with a visual guide to potential market turning points. The indicator is highly customizable, allowing users to adjust parameters for history bars, factor values, and range values, ensuring adaptability to various trading strategies and timeframes.
Key Features:
• Automatic Support and Resistance Detection: Uses advanced algorithms to identify significant price levels.
• Customizable Line Styles and Colors: Personalize the appearance of support and resistance lines for clarity.
• Dynamic Updates: Adjusts lines in real-time based on price action.
• Extended Visibility: Draws lines that extend into the future, offering potential zones of interest for upcoming price movements.
Inputs:
• History Bars Count: Controls the range of historical data used in calculations.
• Factor and Range Values: Fine-tune the sensitivity of trend line detection.
• Line Styles and Colors: Choose between solid, dotted, or dashed lines for support and resistance, with customizable colors.
Use Case:
This indicator is ideal for traders who rely on support and resistance levels for decision-making in various markets, including stocks, forex, and cryptocurrencies. By automating the detection of these critical levels, the Auto Trend Line indicator saves time and eliminates subjective bias, empowering traders to focus on their strategies.
Explore the Auto Trend Line indicator to enhance your trading insights!
Developed by iSTAGs
Pivot MeterThe "Pivot Meter" is a indicator designed to plot pivot levels (support and resistance) directly on the chart. It offers two types of pivot calculations STANDARD and FIBONACCI, allowing traders to choose their preferred method. Here's an overview of its features and functionalities:
________________________________________
Key Features
1. Pivot Types:
o STANDARD: Traditional calculation based on the previous period's high, low, and close.
o FIBONACCI: Uses Fibonacci ratios to calculate support and resistance levels.
2. Dynamic Time Frame Adjustment:
o The indicator adjusts its calculations based on the chart's timeframe, aligning pivot calculations with appropriate periods.
3. Pivot Levels:
o Resistance Levels (R1 to R5): Five resistance levels calculated based on the selected pivot type.
o Support Levels (S1 to S5): Five support levels corresponding to the pivot type.
o Central Pivot (P): The base pivot level for reference.
4. Visualization:
o All pivot levels are plotted as coloured horizontal bands on the chart for easy identification.
o Colours range from warm tones (red for higher resistance levels) to cool tones (blue for lower support levels).
o Thickness and styling make these levels visually prominent.
5. Real-Time Price Line:
o A dynamically updating line marks the current price, with customizable colour and width for visibility.
6. Labels for Levels:
o Labels are placed next to each pivot level for identification (e.g., R1, S1, Pivot).
o Labels dynamically adjust their position with the chart’s bar progression.
________________________________________
Purpose
This indicator helps traders identify potential reversal points, support and resistance levels, and critical price zones. It is especially useful for:
• Day Traders: Quickly assess key levels for short-term trades.
• Swing Traders: Spot significant support/resistance zones over longer periods.
• Trend Followers: Use pivot levels to confirm breakouts or bounces.
________________________________________
Customization Options
• Pivot Type Selection: Choose between STANDARD and FIBONACCI.
• Price Line Colour: Customize the colour of the current price line for better integration with your chart setup.
________________________________________
Technical Details
• Security Function: Data from higher timeframes is accessed using request.security, ensuring accurate and multi-timeframe pivot calculations.
• Dynamic Labelling: Labels update their positions with every new bar to remain synchronized with the latest data.
________________________________________
Usage
Traders can add this indicator to their TradingView charts to monitor critical levels and strategize entries, exits, and stop-loss placements based on the proximity to these pivots. The dual pivot calculation methods make it versatile for diverse trading styles.
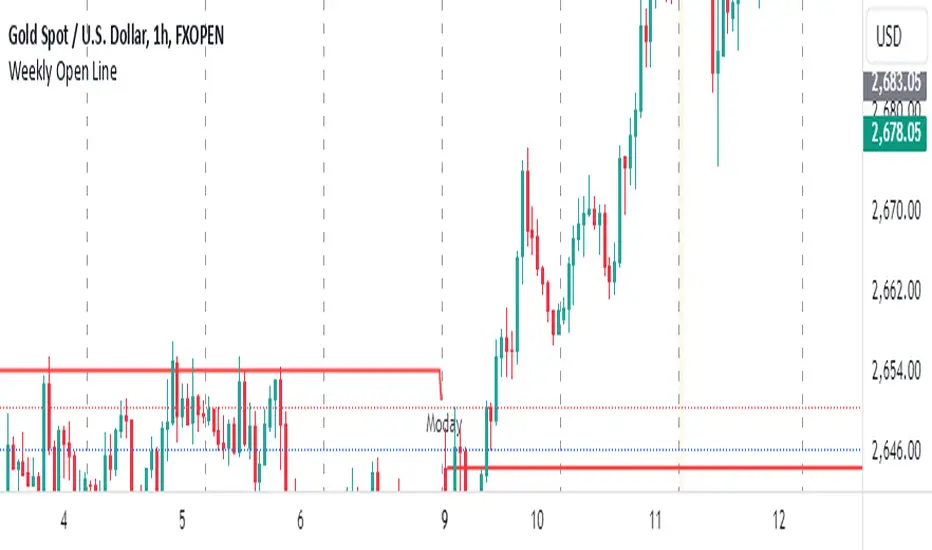
Weekly Open LineThis indicator displays the weekly open price on the chart. It automatically updates every Monday to reflect the opening price of the current week. A dashed line is drawn to indicate the weekly open, and a label stating "Monday" is shown on each Monday for easy identification.
Features:
Automatically calculates the weekly open on Mondays.
Displays a dashed line at the weekly open price.
Labels the weekly open with the text "Monday" for visibility.
Indikator ini menampilkan harga open mingguan di grafik. Indikator ini secara otomatis diperbarui setiap hari Senin untuk mencerminkan harga pembukaan minggu berjalan. Garis putus-putus digambar untuk menunjukkan open mingguan, dan sebuah label yang menyatakan "Moday" ditampilkan setiap hari Senin untuk memudahkan identifikasi.
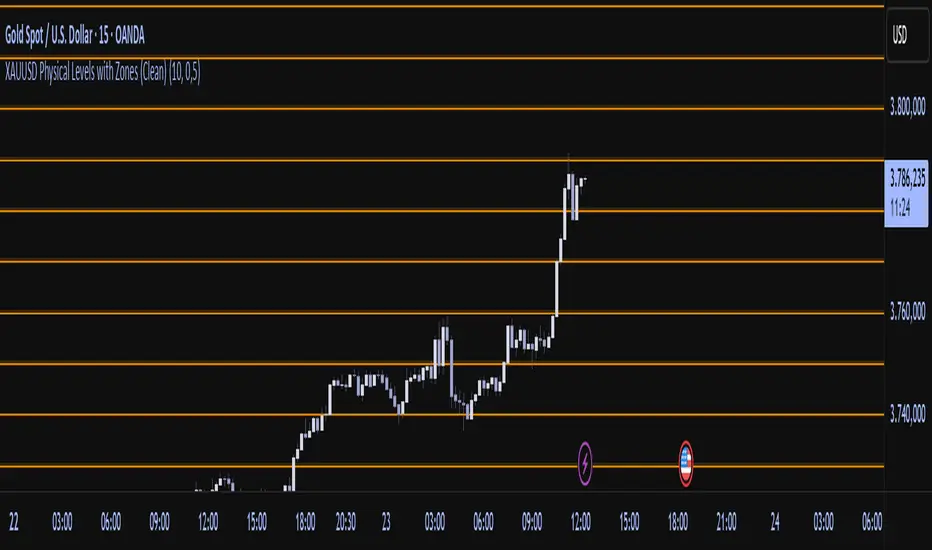
Physical Levels (XAUUSD, 5$ Pricesteps)Functionality:
This indicator draws horizontal lines in the XAUUSD market at a fixed spacing of USD 5. The lines are both above and below the current market price. The number of lines is limited to optimize performance.
Use:
The indicator is particularly useful for traders who want to analyze psychological price levels, support and resistance areas, or significant price zones in the gold market. It helps to better visualize price movements and their proximity to round numbers.
How it works:
The indicator calculates a starting price based on the current price of XAUUSD, rounded to the nearest multiple of USD 5.
Starting from this starting price, evenly distributed lines are drawn up and down.
The lines are black throughout and are updated dynamically according to the current chart.
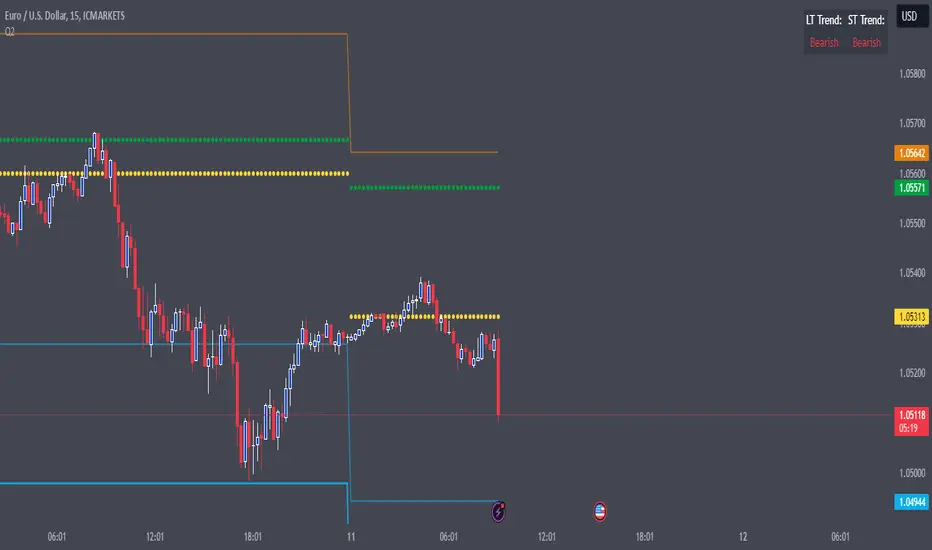
Resistance & SupportThis indicator combines multiple analytical methods to calculate potential support and resistance levels for the upcoming trading day, leveraging historical price data. The calculations are based on three key areas:
Pivot Points: These are calculated using the previous day's high, low, and close values to provide central price levels, along with first and second-level support and resistance (S1, S2, R1, R2). These levels are commonly used in technical analysis and can serve as reference points for market entries and exits.
3-Day Price Average (3DBP): This value provides a short-term trend signal by averaging the high, low, and close prices over the past three days. The indicator helps identify whether the market has been trading at higher or lower levels recently, which can signal bullish or bearish trends.
Trend Detection: The script also includes a short-term and long-term trend analysis:
Short-Term Trend: The prior day’s 3DBP is compared to the previous day’s 3DBP to gauge the market's short-term direction.
Long-Term Trend: The prior close is compared to the open from 50 days ago, offering an indication of the overall market trend.
These components work together to provide actionable insights on potential entry points. For example:
In a bullish market, support levels may act as potential entry points for long trades when the price retraces.
In a bearish market, resistance levels may act as potential entry points for short trades upon price rejection.
The Trend Table at the top right of the chart displays the short-term and long-term trend information for quick reference. It shows whether the trends are bullish or bearish based on the calculations above.
While originally optimized for the EUR/USD currency pair, this indicator can be applied to other forex pairs. However, results may vary depending on the instrument, and further testing is recommended for non-EUR/USD pairs.
Usage Notes:
Pivot points can often act as both support and resistance. While they provide useful reference levels, in volatile markets, these levels may not always hold. Tight stop-losses are recommended if trading near these levels.
The 3DBP offers insight into past market behavior, and although it’s not guaranteed to act as support or resistance, it can help identify zones of interest in the short term.
This indicator is designed to provide a structured approach to price action analysis, incorporating widely-recognized methods like pivot points and trend detection, while adding unique elements like the 3DBP to enhance its utility.
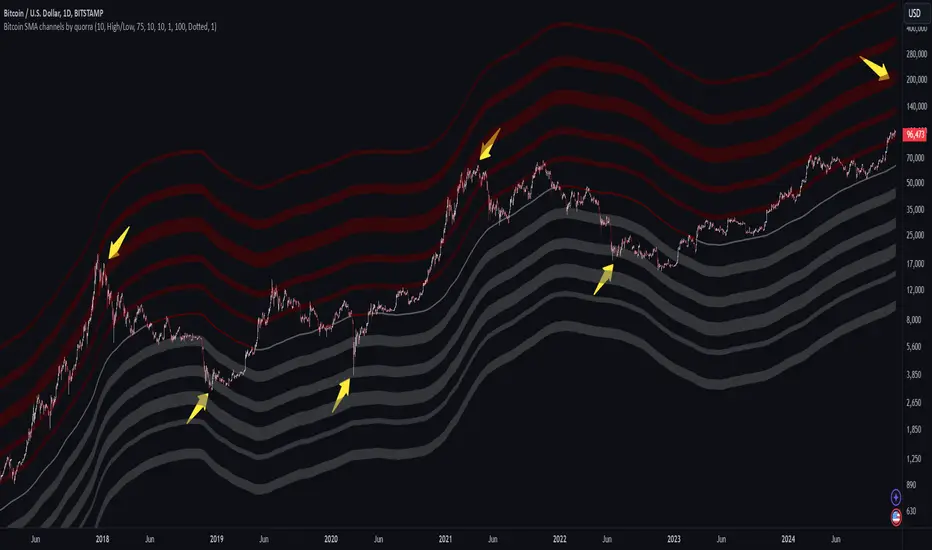
Bitcoin SMA channels - quorraThis indicator is specifically designed to identify potential Bitcoin bottom zones based on historical data and market trends. By analyzing price cycles and key support levels, it helps traders and investors make informed decisions. This tool is tailored for optimal use on higher timeframes like the daily chart. (Don't forget to ensure your chart is set to logarithmic)
1. Simple Moving Average (SMA) Calculation and Gradient Coloring
The script begins by calculating the 350-period SMA (sma350), which serves as the foundation for identifying the market's overall trend. To make the SMA visually intuitive, a gradient color function is implemented. This function changes the SMA's color based on whether the current price (close) is above or below the SMA.
If the price is above the SMA, the line appears in gray.
If the price is below the SMA, the line takes on a darker red shade.
This gradient coloring helps traders quickly gauge market sentiment and momentum, as the SMA effectively acts as a dynamic trend line.
2. Fibonacci-Based Multipliers for SMA Levels
The indicator computes several levels based on Fibonacci multipliers of the 350-period SMA. These levels provide additional layers of insight into potential support and resistance zones. The multipliers range from small values like 0.144 (indicating closer proximity to the SMA) to larger values like 9 (representing distant extensions).
These Fibonacci levels are plotted using hidden lines, ensuring that the chart remains uncluttered while still allowing for strategic visualization through filled zones. For instance:
Levels like SMA x 0.144 to SMA x 0.355 are closer to the SMA and are categorized as potential buy zones.
Levels like SMA x 2 to SMA x 9 extend further and are considered sell zones.
3. Filling Areas to Visualize Zones
To enhance the visual representation, the script uses fill() functions to color the regions between specific Fibonacci levels:
Buy Zones: These areas are filled with a semi-transparent gray color (#5a5a5a) to indicate levels where prices are likely to bounce upward.
Sell Zones: Conversely, these areas are filled with a semi-transparent red color (#5f0000), signaling regions where prices may encounter resistance and reverse downward.
This layered approach helps traders identify actionable price ranges without overwhelming them with excessive visual elements.
4. Pivot Points and Their Visualization
The script includes a pivot point system for identifying local highs and lows. Depending on the selected source (High/Low or Close/Open), it calculates pivot highs and lows over a specified period (prd).
Pivot highs (ph) are marked above bars using downward-facing labels.
Pivot lows (pl) are marked below bars using upward-facing labels.
The pivot points are adjustable via user inputs, allowing traders to fine-tune the detection of significant price swings.
5. Support and Resistance Channel Analysis
A key feature of this indicator is its ability to identify and display support and resistance (S/R) levels. The script calculates the maximum allowable width of an S/R channel as a percentage of the price range over a 300-bar window. It then groups pivot points within these channels to derive high and low boundaries.
Resistance Levels: Represented by the upper bounds of channels and highlighted with a red color.
Support Levels: Represented by the lower bounds of channels and highlighted with a gray color.
These levels are dynamically adjusted based on user-defined parameters such as channel width, maximum S/R levels, and strength.
6. Advanced Input Customization
The indicator provides several user-configurable inputs to adapt it to different trading strategies:
Pivot Period (prd): Determines the sensitivity of pivot point calculations.
Channel Width: Controls the percentage width of S/R zones.
Maximum S/R Levels: Sets the maximum number of S/R zones displayed.
Line Style and Color Settings: Allows customization of the visual appearance of lines and labels.
7. Strength Filtering for S/R Levels
To ensure the reliability of identified S/R levels, the script incorporates a filtering mechanism based on strength. Strength is determined by the number of pivot points that fall within a channel. Levels with insufficient strength are excluded, ensuring that only significant S/R zones are displayed.
8. Practical Applications
This indicator can be applied in various trading strategies:
Trend Identification: The SMA and its gradient coloring provide a clear indication of the market's prevailing trend.
Support/Resistance Trading: The Fibonacci levels and S/R zones help traders identify potential entry and exit points.
Risk Management: By visualizing key levels, the indicator assists traders in setting stop-loss and take-profit levels effectively.
This script combines multiple technical analysis techniques into a single, visually intuitive tool. It is particularly useful for Bitcoin traders seeking to enhance their decision-making process by leveraging both trend and level-based analysis.
Although this indicator is specifically designed for Bitcoin, it can also be applied to stocks or altcoins. It works best on longer timeframes, such as the daily chart. When the price reaches specific support levels, it may be wise to activate a DCA bot or confirm the bottom using other indicators. This approach helps enhance decision-making and ensures a more strategic entry or exit from positions.
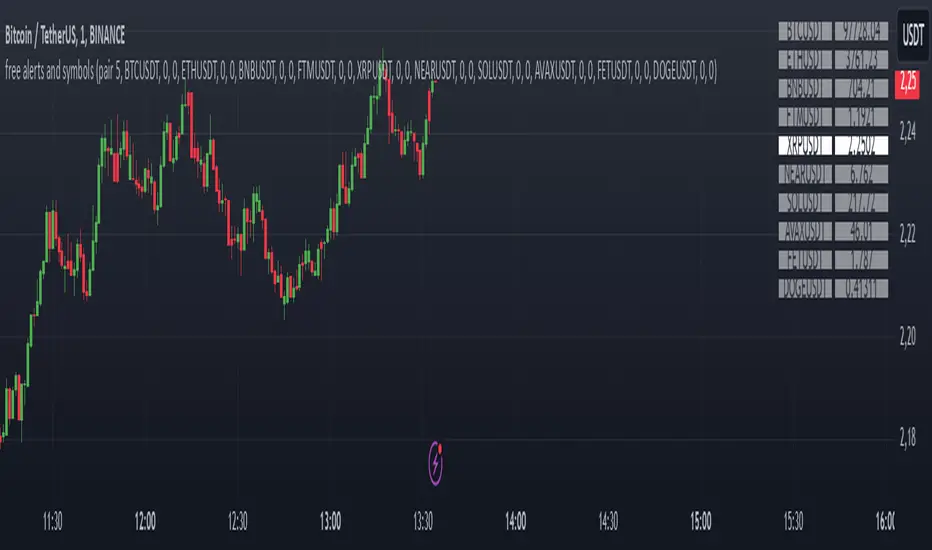
Alerts and symbolswhat is "Alerts and symbols"?
It is an indicator that allows you to watch more trading pairs and add alarms to them.
what it does?
It allows you to set a total of 20 different intersection alarms, 2 in each pair, for 10 different trading pairs at the same time.
It draws the candlestick chart of a pair you choose among 10 trading pairs and the alarm lines you created for this trading pair on the chart.
It also allows you to see the prices of 10 different trading pairs at the same time, thanks to the table it creates.
how to use it?
First, select the alarm pairs you want to use, for example, BTCUSDT pair is the default value for "pair 1". You can choose 10 different trading pairs as you wish. Just below each trading pair, there are two different sections titled "line 1" and "line 2" so that you can set an alarm. Type here the price levels at which you want to be alerted in case of a price crossover.
You can use the "candle source" section to examine the candlestick charts of trading pairs. The indicator draws the candle chart of the trading pair selected in the "candle source" section.
Check the "show alert lines on chart" box to see the levels you have set an alarm for.
When everything is ready, first click on the three dots next to the indicator's name and then on the clock icon. then create an alarm and that's it.
Dynamic Fibonacci Retracement 3d / TradingArt3dDynamic Fibonacci Retracement - TradingArt3d.
The Dynamic Fibonacci Retracement is an advanced indicator based on the classic Fibonacci concept, adapted to the dynamic movements of the market. Unlike traditional retracements that remain static, this indicator adjusts Fibonacci levels based on the most relevant moving averages for each market condition, providing more accurate support and resistance levels.
Key Features:
• Fibonacci Moving Averages: Choose Fibonacci moving averages ranging from 1 to 4181.
• Dynamic Recursiveness: Automatically adjusts moving averages through a dynamic algorithm to identify the most representative support and resistance levels on the chart.
• Full Customization: Modify the colors, thickness, and resolution of moving average lines to suit your preferences.
• Mamut Wave Viewer: Intuitive RSI-based visualization to support decision-making in your analysis.
• Visualization Optimization: Options to enhance visualization, including enabling or disabling even or odd recursive moving averages.
Usage Tips:
• Use multiple instances of the indicator to overlay different moving average configurations, obtaining a more precise representation of Fibonacci levels.
• Experiment with different combinations of colors and resolutions to tailor the visualization to your analytical needs.
Archiving Your Analysis:
To preserve your technical analysis and keep a record of your configurations, follow these steps to archive them in TradingView:
1. Adjust the chart and indicator settings as desired.
2. Set your browser zoom to 25% to achieve the best possible resolution and maximize CPU efficiency.
3. Click the "capture image" icon at the top of the screen, or use the keyboard shortcut Alt + Ctrl + S (on PC) or Option + Command + S (on Mac).
4. Save the analysis image in your TradingArt Library for future reference or to share with others.
This functionality allows you to maintain a visual record of your analyses and track your strategies more effectively over time.
Support and Questions:
If you have any questions about using the indicator, feel free to leave a comment in the Comments section of this post or contact me through my TradingView profile. I’ll be happy to help resolve any issues and provide further details about its functionality
