SupertrendIndicatorSupertrend (13,2.5) & Supertrend (18,3) are best for intraday.
Loving the signals.
Trading


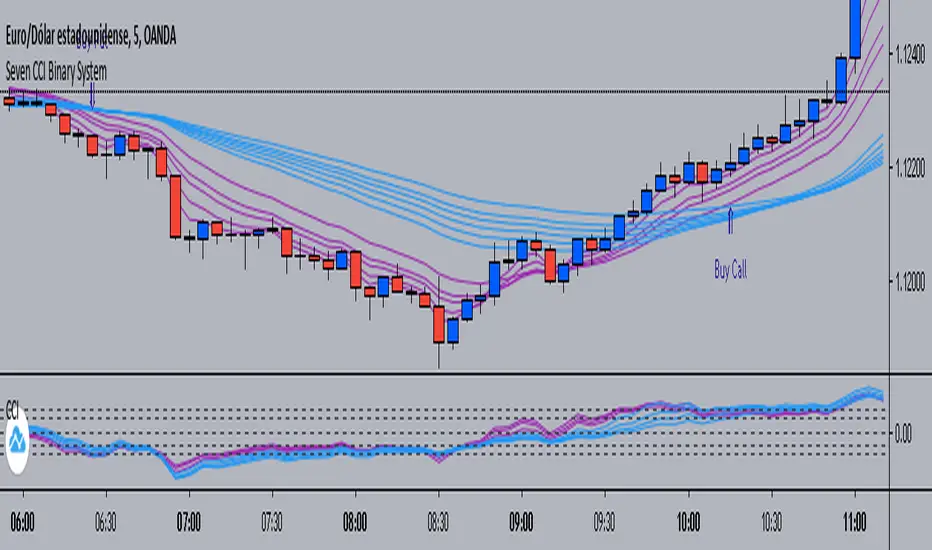
Seven CCI Binary System by Hashtag_binarySeven CCI binary system is trend-momentum strategy based on CCI and exponential moving averages. This trading system is also good for scalping and intraday trading.
Rules for Binary Options:
- Time Frame 5 min or 15 min.
- Expiry time 4-5 candles.
- Trades only in trend.
Buy Call:
- EMA's lines color magenta above EMA's lines color blue;
- CCI lines color magenta are above CCI lines color blue and zero level.
- When thes conditions are agree buy call at opening of the next bar.
Buy Put:
- EMA's lines color magenta below EMA's lines color blue;
- CCI lines color magenta are below CCI lines color blue and zero level.
- When thes conditions are agree buy put at opening of the next bar.
Scalping:
-Time Frame 5 min, 15min.
- Currency Pairs: EUR/USD, GBP/USD, AUD/USD, USD/CHF, USD/JPY.
- The rules for buy and sell are the same.
- When the price is within the bundle of the moving averages do not trade.
Exit position
- Make Profit on the pivot points levels or with fast profit target.
- Initial stop loss on the previous swing price.
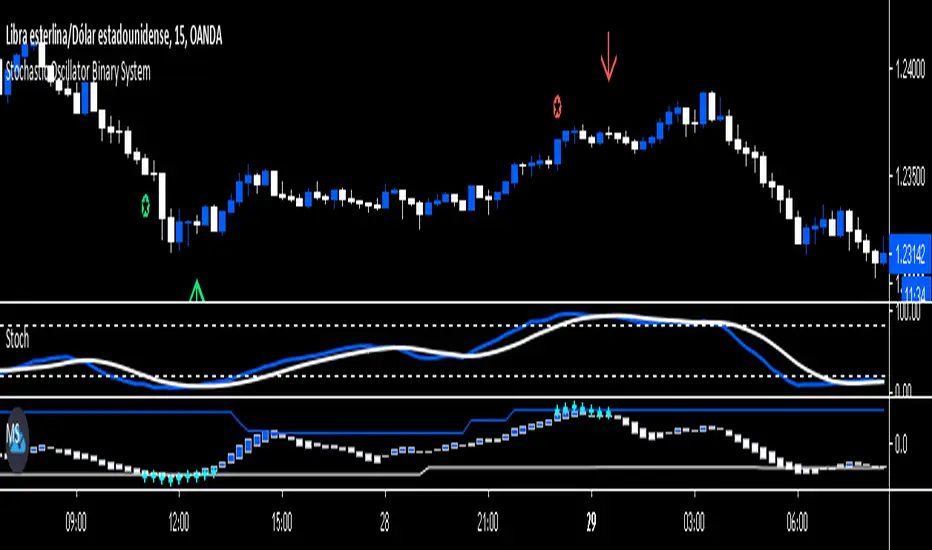
Stochastic Oscillator Binary System by Hashtag_binaryRules
- Time Frame 1 min.
- Expires Time 3 min or 15 min (the best option).
- Markets: Forex (only volatile currency pair), Futures.
- Sessions: London and New York.
Call
- Heiken Ashi Dodger blue;
-Stochastic Oscillator cross upward from oversold Zone (conservative trade, aggressive trade: Stochastic Oscillator cross upward ).
-Matrix three square dodger blue.
Put
- Heiken Ashi white;
- Stochastic Oscillator cross downward from overbougth Zone (conservative trade, aggressive trade: Stochastic Oscillator cross downward ).
- Matrix three square withe.
This Binary System is also good for trade scalping. The same rule for entry with conservative trade:
Exit position options
- For Buy close position when the stochastic line touches 80 levels,
- For Sell close positions when stochastic line touches 20 levels.
- Initial Stop loss on the previous swing.

Tradespot Trade PanelCryptocurrency based TA panel.
Features
- In depth trend analysis
- Momentum analysis
- Alt coin risk management
- Technical sentiment at a glance
- Much more coming as we iterate and update this panel over time

Market Sniper - Trading/Scalping SuiteWelcome to Market Sniper.
Market sniper is meant to be a suite for trading/scalping alongside my indicators script, RSI, Stochastic and Horizontals.
It is based on over 15 Indicators/Oscillators so there is no need for convoluted charts and constantly changing charts/indicators for a better understanding of the market.
Warnings:
I can't stress this enough! This isn't a magic pill that will transform your illiterate grandmother into an expert trader! This is a very powerful tool whose function is to complement your trading/save time (and yes, with practice be your main trading tool).
This algorithm requires setting up and training to be used correctly, please do not expect to load it up and immediately be scalping the 1s charts.
This algorithm is heavy and might require constant refreshes of the browser on slower computers.
Labels overlap at the moment, working on this part at the moment. So, always zoom in before doing a trade / change the "+- signals in settings"
Candlestick patterns need tweaking, I personally have it off and use my own judgement atm.
What it includes:
Trend reversal / continuation (Macd, Stochastics, money flow , CCI , momentum, DIOSC (automatic trendlines ), SuperTrend, Moving averages, etc, etc.)
RSI divergence drive / drive counter (base code from Libertus, check his profile as he has very helpful scripts)
Bull Market expansions for longterm take profit and increasing position
Candlestick patterns
Trend reversal / Continuation
Green = Bullish reversal
Red = Bearish trend reversal
Orange = Trend continuation / strengthening
Trend Continuation/Strengthening
A warning here, trend strengthening also means that many times the indicators are overextended or close to it
------
The numbers reflect the amount of indicators that are signaling a reversal over the specified period on the settings.
For higher timeframes this setting should be on a lower value and the opposite for lower timeframes.
This works on every market and every timeframe(according to months of my own paper and real trading). Remember that each market/asset/commodity has different soft spots so tweaking, backtesting and present accuracy review should be of maximum priority.
Bull Market expansion phase
Warning:
The indicator purposely does not show any signals during bear markets. It is my opinion bear markets complexity render this tool close to useless.
It was designed to be used in higher timeframes, tough it SEEMS to have a good track record / be useful in lower timeframes.
it will ALWAYS give a fake signal at the end of a bull market because of the very nature of the code.
It is based of EMAs, RSI and Stochastic
Candlestick Patterns
Bullish candlestick patterns:
Hammer
Inverted Hammer
Dragonfly
Gravestone
Bearish candlestick pattern:
Shooting Star
Hanging Man
Gravestone
Dragonfly
RSI divergence drive
- Credit to Libertus for the base code of this section
The green triangle means there are at least 2 drives of valid divergence, yellow for 3 and red for 4+.
The script shows triangles when confirmation candle closes.
You need to know how divergence works to use this section. investopedia can easily get you there.
For cryptos I use 2-4h+ timeframes, for traditional markets I use 15min+ for forex I use it basically in every timeframe.
For questions/suggestions and access PM me in the platform itself and don't forget -> FEEDBACK IS IMPORTANT
Thank you all

DMT Ladder AutobotDMT Ladder Autobot Study it's unique super trend indicators that measure the volatility from the current price action with ATR recognitions and custom setting
in this version, we can find that DMT Autbot also Ladders long entry and short entry in 4 different steps you can set your calculations depending on your requirements and pair volatility calculations
to recover your entry DMT will turn loosing trading into winning trades with the right risk management.
1 long signals
4 ladder Long add signals
1 short signals
4 ladder short add signals
1 dynamic stop calculated from your average entry price
1 dynamic take profit calculated from your average entry price
Please pm me for access or larger explanations about the script or for full pdf tutorial
thx for your support
@Shenlong

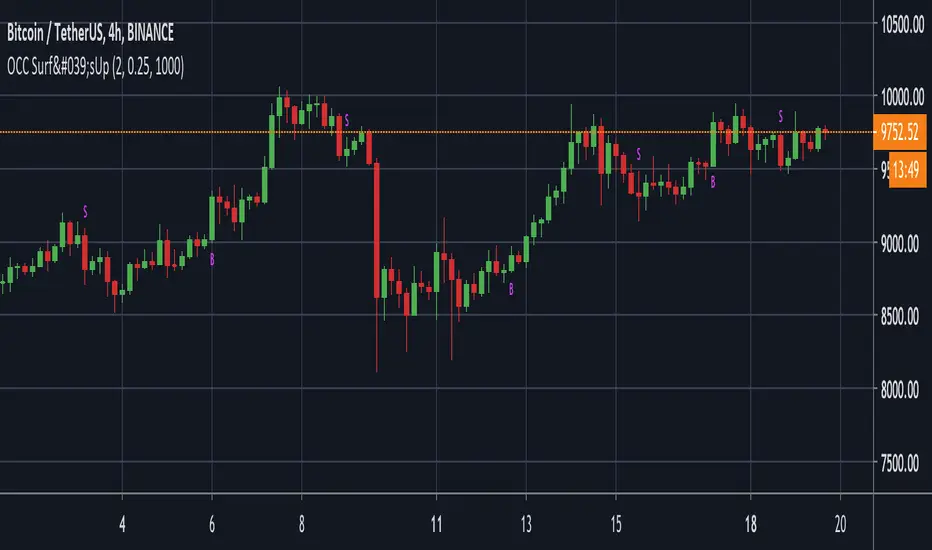
Surf's Up Alerts 1.0Optimal Markets - USDT/ BTC -USD/ BTC all major exchanges
Optimal Chart - 4H
Average trades - 1-2/week
YTD Profit (0 leverage) = 62%
This script was designed to give new traders confidence and some guidance when entering into the crypto trading industry.
When added to the USD/ BTC 4H (optimal) charts of any high volume exchange, three new alert conditions will appear under the Surf's Up indicator alerts. Turn on the "Buy Signal" and "Sell Signal" to be alerted of potential large price increases. This script analyzes multiple data pieces to determine points in which the price has the highest probability of moving up, along with a sell alert that will alert the user of either: the point at which the trend is dying and to take profit OR that the trend is not happening, and to cut your losses. "Secure Profit" can be set to alert you of given profit target, at which time you can set a stop loss just above break even, essentially making a risk-free trade! This is OPTIONAL as it could cause you to a leave a large winning trade too early as well :)
Buy and Sell conditions have been programmed to know when the user is already in a trade, so multiple alerts will not fire, allowing full integration of auto trading as well.
Surf's Up is a back-tested strategy turned study in order to give high potential trade alerts. This way, anyone can easily add the script to the BTC/USD 4H chart, and simply turn on/off any of the 3 alerts: Buy, Sell, or Secure Profit.
You can get more information along with access to this script/alert system by clicking the link in the signature, or sending us a PM here on Tradingview.
Happy Trading!
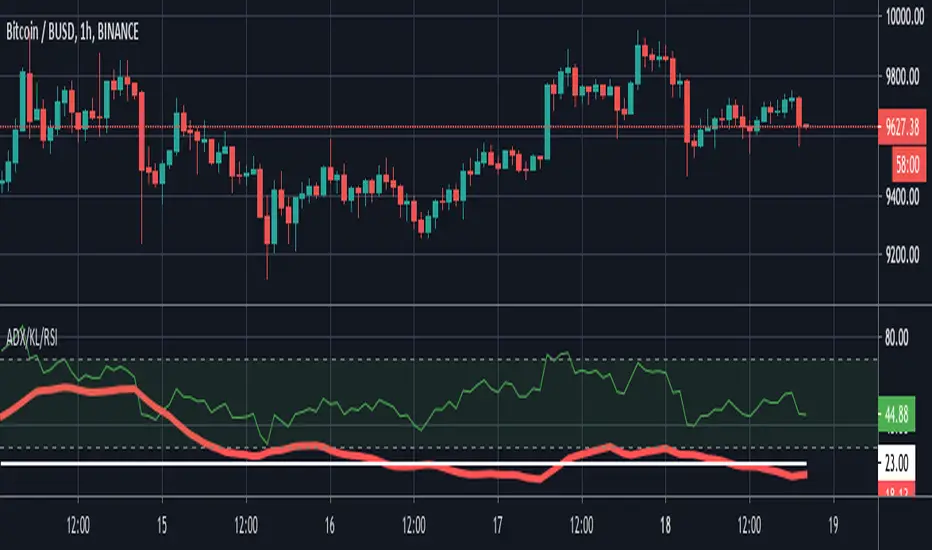
ADX + Keylevel + RSIThis script is a combination of the Average Directional Movement Index (ADX) help to determine the trend strength with a key level and Relative Strength Index is an oscillator that measures the speed and change of price movements.
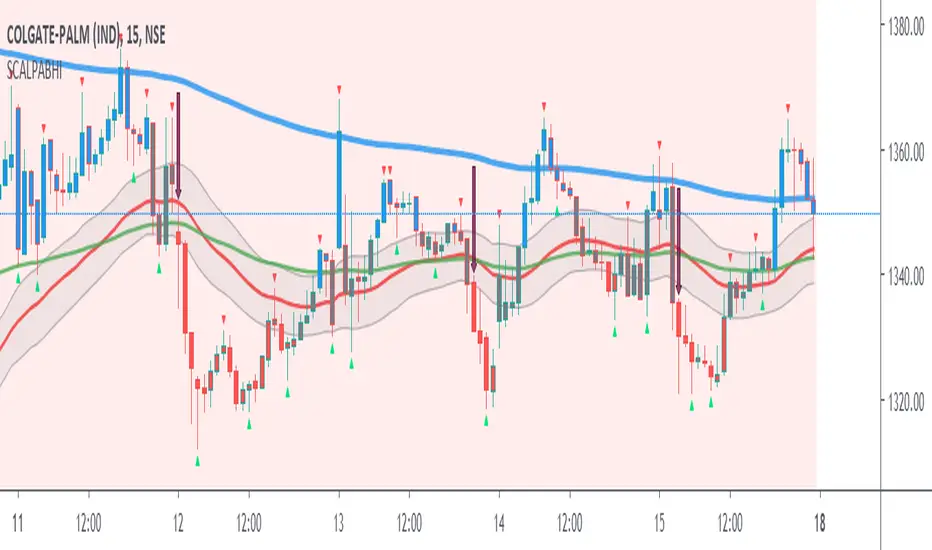
Scalping PullBack by AbhiSetup and hints:
When price is above the PAC(blue bars) we are only looking to buy as price comes back to the PAC, when price is below the PAC(red bars), we are only looking to sell when price comes back to the PAC
What we’re looking for when price comes back into the PAC we draw mini Trendlines (TL) utilising the Fractals and HH/LL points to guide your TL drawing.
Now look for the trend to pull back and break the drawn mini TL. That's is where we can place the scalp trade.
So we are looking for continuation signals in terms of a strong, momentum driven pullbacks of the PAC EMA(34).
The other EMAs are there to check for other Pullbacks when PAC EMA (34) is broken.
Other than the "SweetSpot Gold RN" indicator, you should not need any other indicator to scalp for pullbacks.
If you want to trade shallower Pullbacks for quicker scalps, try reducing the PAC and EMA combination lengths for example:
- 21 PAC and 55, 144, 377 for fast, medium, slow EMAs
- 13 PAC and 34, 89, 233 for fast, medium, slow EMAs
Each alert should be evaluated on it's own merits, the alerts are designed to highlight possible scalping trades from Pullback recoveries around the PAC.
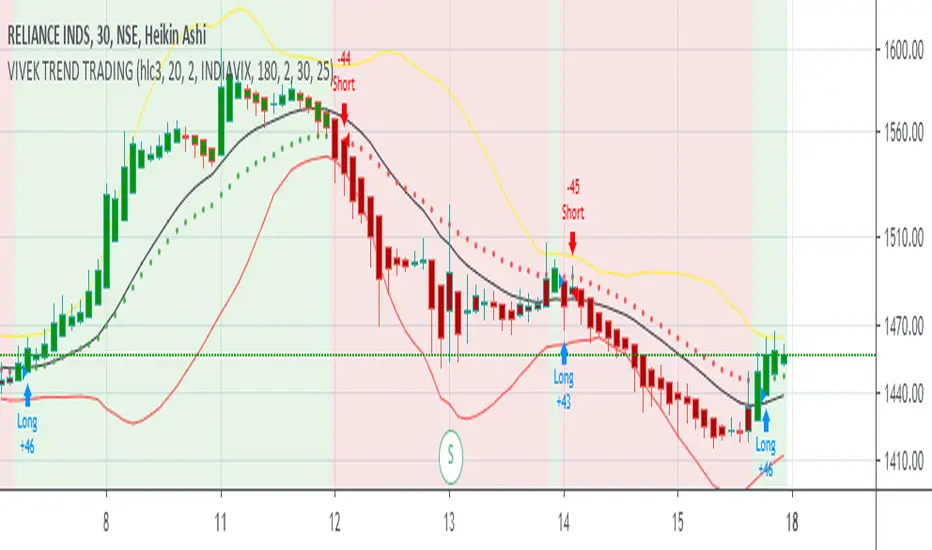
[VBOSE]Astra Trend Trading (Nifty,Crude,Reliance)Astra Trend Trading Strategy is based on unique combination of WMA based Bollinger bands and INDIA VIX based Adaptive Moving Averages combination for trading NIFTY 50 Stocks, Global Indices, Commodity Futures and CFDs.
It Shows Bull/Bear Background (Green color or Red Color showing VIX and Bollinger based Trend Strength in that time period) customized with bollinger parameters.
Barcolors with WHITE Colour shows Trendless movements (Threshold <25)
Green Barcolor:BULL Powerful
RED Barcolor:BEAR Dominant
WHITE:TRENDLESS/SIDEWAYS
Highly Volatile Nifty Stocks like Reliance , HDFCBANK , BANKNIFTY Futures , NIFTY Futures , Crude Oil can be traded.
CRUDEOIL Traders can Change VIX to OVX
Intraday Scalpers use 3,5 and 15 min Time frame on heikenashi charts
Warning:Script changes bar colours and background colours
Default Order Settings:20% of Equity and 0.2% Commission
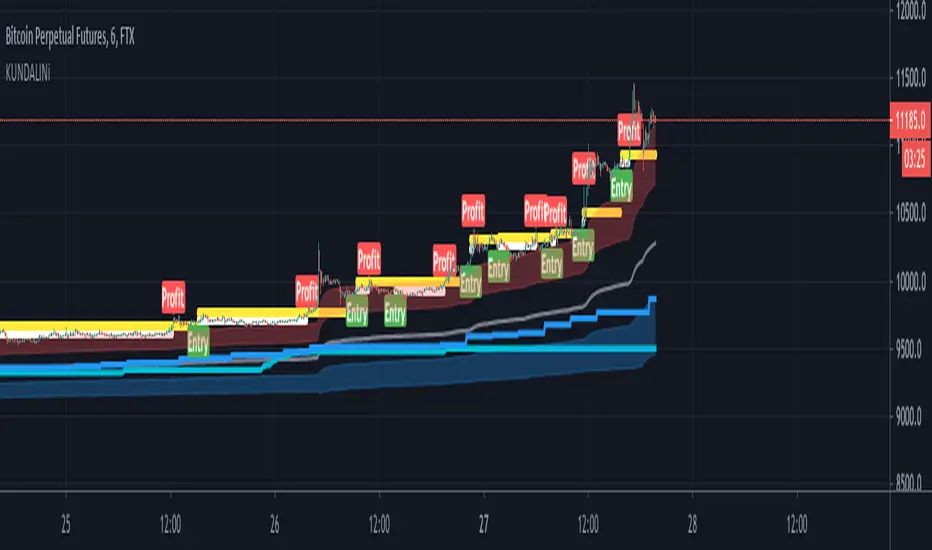
KUNDALINiThis is the STudy Version of The Kundalini is a technical indicator. Based on algorithm calculations, this indicator extrapolates the previous price for the next bar. Plus addition Multi time frame ATR volatility Reading environment for higher conditions
Here is how Dominator is calculated:
1. The study estimates the price projected for the next bar. The estimated price is based on the algorithm method.
2. The study extrapolates this value to find a projected price change for the next bar.
The resulting extrapolated value is shown as a histogram on a lower subgraph. By default, sections of the histogram where the extrapolated value is increasing are shown in green; sections corresponding to the decreasing value are shown in red.
Note: Value projection is purely mathematical as all calculations are based on algorithm averaging of previous values.
additional volatility models clouds on blue and red for bearish and bullish markets
Overlay True
The strategy includes 3 different adjustable levels for the ladder , plus automatic adjustable stop loss and takes profit calculated from your average entry price after each ladder adds.
Adjustable BAcktest Window.
1 long signals
3 ladder long add signals
1 short signals
3 ladder short add signals
1 dynamic stop calculated from your average entry price
1 dynamic take profit calculated from your average entry price
Please Private Msg me if you like more info about the script Full pdf available or if you need access to it
thx for your time and support
Dominator Ladder STUDYThis is the Study version of The Dominator is a technical indicator. Based on algorithm calculations, this indicator extrapolates the previous price for the next bar.
Here is how Dominator is calculated:
1. The study estimates the price projected for the next bar. The estimated price is based on the algorithm method.
2. The study extrapolates this value to find a projected price change for the next bar.
The resulting extrapolated value is shown as a histogram on a lower subgraph. By default, sections of the histogram where the extrapolated value is increasing are shown in green; sections corresponding to the decreasing value are shown in red.
Note: Value projection is purely mathematical as all calculations are based on algorithm averaging of previous values.
Overlay True
The Study includes 4 different adjustable levels for the ladder, plus automatic adjustable stop loss and takes profit calculated from your average entry price after each ladder adds.
Adjustable BAcktest Window.
1 long signals
4 ladder Long add signals
1 short signals
4 ladder short add signals
1 dynamic stop calculated from your average entry price
1 dynamic take profit calculated from your average entry price
Please pm me for access or larger explanations about the script or for full pdf tutorial
thx for your support

TD Ameritrade regular + extended US trading hours highlightTD Ameritrade regular + extended US trading hours highlight

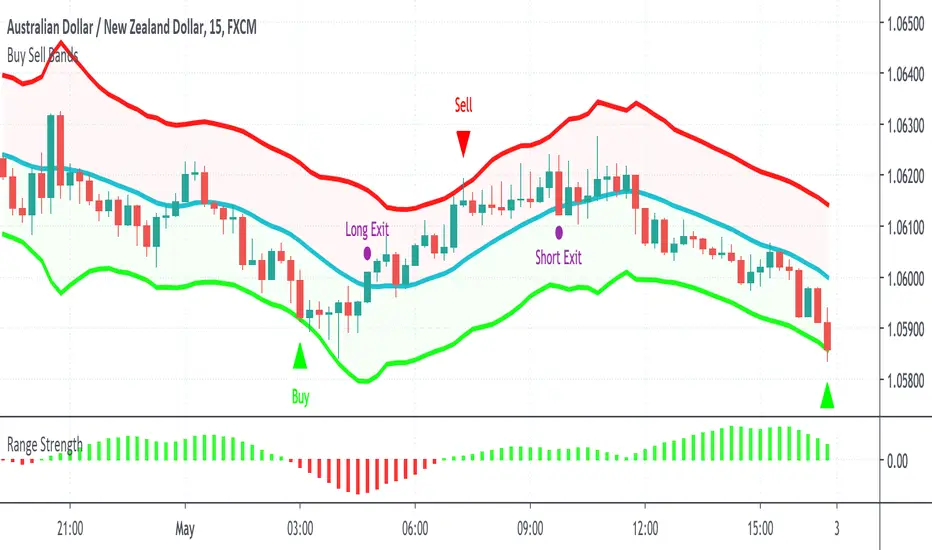
Range StrengthRange Strength is a super simple indicator designed for the mean reversion (range trading) strategy, it shows you how strong the market is ranging or trending. When the indicator is positive (green color) the market is a range mode, when the indicator is negative (red color) it is in a trending mode.
It's best used together with our Buy Sell Bands indicator to identify entry and exit signals within the range, ideally only taking trades when the Range Strength indicator is showing positive (green) readings.
How Is It Different From Other Indicators?
- Designed specifically for the mean reversion (range trading) strategy
- Shows one simple reading and graphical representation of range strength
- Identify the best times to take mean reversion trades versus trend trades
- Works well in conjunction with the Buy Sell Bands indicator to validate entry & exit signals
- Can be applied to all markets and timeframes
How To Use The Indicator?
1) Visit our website URL shown below this description and signup
2) We will then grant your TradingView username permission to use our indicators
3) Go to your Indicators window, then the Invite-Only section and add our indicators to your chart
4) Our indicators will then show on every chart you now look at
5) You can set up alerts to be notified in real time of trading signals from our indicators
6) Read our user manual for all the best tips on how to use our indicators as part of a range trading strategy
7) Feel free to reach out to us for personal one-on-one help with getting setup
What Markets and Conditions Does It Work Best On?
All markets cycle between trending and ranging modes, and the key to successfully using our indicators is identifying when the market is in or about to go into a range trading mode, and as such it can be applied to all markets and timeframes.
Some markets and timeframes trade within ranges more predictably than others, for example Forex, Cryptocurrencies, and Futures on the 15 minute timeframe during the US night session can work well due to the lack of price sensitive news creating lasting trends. With Stocks & ETFs on the 5 minute timeframe during the midday session on large cap blue chip stocks with no recent news releases can show strong range trading environments to use our indicators in.
In addition to single markets, you can also use our indicators on pair charts, for example Coca Cola(KO) versus Pepsi(PEP), you can do this by entering KO/PEP inside your TradingView chart quote box and it will bring up a pair chart. Our indicators will show buy and sell signals right on the pair chart just like any other single instrument chart. You can get very creative with what type of pairs you can come up with.
Our indicators are primarily designed for day trading and swing trading, however they can also be used for position trading and investing by identifying technically oversold and overbought range levels that are based on current and past volatility around a dynamic average price, for this we recommend using a weekly chart to identify longer trading opportunities.
As always indicators should be used as part of a trading strategy to assist in making decisions, you can't just blindly follow every signal they produce, you should always seek to compliment technical trading signals with additional analysis to reduce your risk and increase your odds of making a winning trade.
Examples Of Use On Various Markets and Timeframes
GBP vs CHF Forex Pair 15 Minute Chart
Tesla Stock 1 Minute Chart
Bitcoin vs USD Crypto Pair 15 Minute Chart
Micro E-Mini SP500 Futures 1 Minute Chart
Mastercard vs Visa Stock Daily Pair Chart
To gain access to the Range Strength and Buy Sell Bands Indicators visit our website shown below.
Happy Range Trading :)

Buy Sell BandsBuy Sell Bands is a super simple indicator based on the mean reversion (range trading) strategy that shows you exactly where to buy, sell and close trades on every chart, market and timeframe.
It's best used together with our Range Strength indicator to identify when the market is in a range mode, this is the best time to take the entry signals from the Buy Sell Bands.
How Is It Different From Other Indicators?
- Designed specifically for the mean reversion (range trading) strategy
- Upper and lower bands are based on current and past volatility
- Aren't as sensitive to "squeezes" after periods of contracted volatility
- Works well in conjunction with the Range Strength Indicator to confirm entry signals
- Helps identify good "pair trading" opportunities
- Can be applied to all markets and timeframes
How To Use The Indicator?
1) Visit our website URL shown below this description and signup
2) We will then grant your TradingView username permission to use our indicators
3) Go to your Indicators window, then the Invite-Only section and add our indicators to your chart
4) Our indicators will then show on every chart you now look at
5) You can set up alerts to be notified in real time of trading signals from our indicators
6) Read our user manual for all the best tips on how to use our indicators as part of a range trading strategy
7) Feel free to reach out to us for personal one-on-one help with getting setup
What Markets and Conditions Does It Work Best On?
All markets cycle between trending and ranging modes, and the key to successfully using these indicators is identifying when the market is in or about to go into a range trading mode, and as such it can be applied to all markets and timeframes.
Some markets and timeframes trade within ranges more predictably than others, for example Forex, Cryptocurrencies, and Futures on the 15 minute timeframe during the US night session can work well due to the lack of price sensitive news creating lasting trends. With Stocks & ETFs on the 5 minute timeframe during the midday session on large cap blue chip stocks with no recent news releases can show strong range trading environments to use our indicators in.
In addition to single markets, you can also use our indicators on pair charts, for example Coca Cola(KO) versus Pepsi(PEP), you can do this by entering KO/PEP inside your TradingView chart quote box and it will bring up a pair chart. Our indicators will show buy and sell signals right on the pair chart just like any other single instrument chart. You can get very creative with what type of pairs you can come up with.
Our indicators are primarily designed for day trading and swing trading, however they can also be used for position trading and investing by identifying technically oversold and overbought range levels that are based on current and past volatility around a dynamic average price, for this we recommend using a weekly chart to identify longer trading opportunities.
As always indicators should be used as part of a trading strategy to assist in making decisions, instead of just blindly following every signal they produce you should always seek to compliment technical trading signals with additional analysis to reduce your risk and increase your odds of making a winning trade.
Examples Of Use On Various Markets and Timeframes
GBP vs CHF Forex Pair 15 Minute Chart
Tesla Stock 1 Minute Chart
Bitcoin vs USD Crypto Pair 15 Minute Chart
Micro E-Mini SP500 Futures 1 Minute Chart
Mastercard vs Visa Stock Daily Pair Chart
To gain access to the Buy Sell Bands and Range Strength Indicators visit our website shown below.
Happy Range Trading :)
KundaliniThe Kundalini is a technical indicator. Based on algorithm calculations, this indicator extrapolates the previous price for the next bar. Plus addition Multi time frame ATR volatility Reading environment for higher conditions
Here is how Dominator is calculated:
1. The study estimates the price projected for the next bar. The estimated price is based on the algorithm method.
2. The study extrapolates this value to find a projected price change for the next bar.
The resulting extrapolated value is shown as a histogram on a lower subgraph. By default, sections of the histogram where the extrapolated value is increasing are shown in green; sections corresponding to the decreasing value are shown in red.
Note: Value projection is purely mathematical as all calculations are based on algorithm averaging of previous values.
Overlay True
The strategy includes 3 different adjustable levels for the ladder , plus automatic adjustable stop loss and takes profit calculated from your average entry price after each ladder adds.
Adjustable BAcktest Window.
1 long signals
3 ladder long add signals
1 short signals
3 ladder short add signals
1 dynamic stop calculated from your average entry price
1 dynamic take profit calculated from your average entry price
Please Private Msg me if you like more info about the script Full pdf available or if you need access to it
thx for your time and support
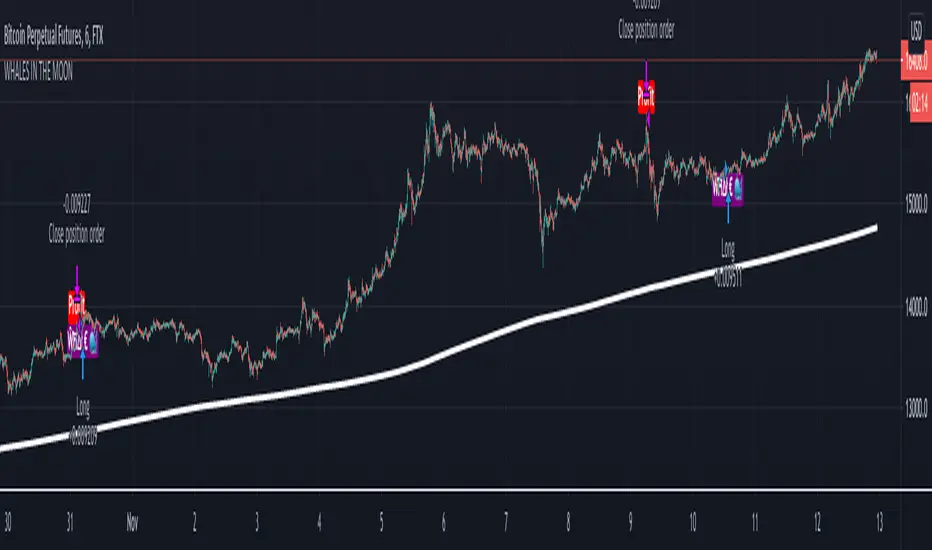
The MATRIX: Ultimate Crypto Position StrategyHi all,
We are cryptocurrency miners and 'hodlers’ since 2013, with unwavering confidence in the technology behind it. We’d always thought that it would be a life-changing êvent. And we were right. We went from “broke” to making shit loads of money and all the way back to bitter nothing. If you are lucky, you probably haven’t experienced what if feels to be high on cash and then fall very deep low, but let me reassure you, it is a nasty feeling.
Then we wondered, what the hell did we do wrong? Or better say, what didn’t we do right! The answer was dead simple: We had no experience in trading, we were overwhelmed by emotions and we didn't use any trading strategy. Hence, we were doomed to fail from the beginning.
In order to build an all-in-one profitable trading strategy, we had to start from zero. The one thing we learned is that your goal for financial gain cannot be achieved without discipline and consistency. Our prime focus was to absorb as much info as possible regarding trading and coding by doing an extensive self-study, which consequentially took us to the next level.
One of the secrets to being successful from a trading perspective is to have an indefatigable and undying thirst for information and knowledge. As Bruce Lee once said: “Learning is never cumulative; it is a movement of knowing which has no beginning nor end”. So, we adapted what was useful, rejected what was useless, and added our own preferences based on our mindset. We were totally committed to be the best. Our goal was never to lose money again! Of course, this is an illusion, as no single strategy is correct all of the time.
Therefore, the final trading strategy was based on the following key elements:
• The avoidance of risk is more important than absolute profit. Do not anticipate and do not move without market confirmation. Being a little late in your trade is your indication if you are right or wrong.
• Offering simplicity and practicality, for those that do not have the time to trade 24/7.
• Believe in analysis and not in forecasting. Trading is a skill for those who are smart and gambling for those who are not.
In conclusion, we are absolutely thrilled to finally release this trading strategy after one year of extensive back testing and optimization. The script was supposed to be for personal use only, but because Tradingview has helped us a lot in this process, we want to share it with all of you and give something back to this amazing community. If you learned something new today and found value, please give us a like to show your support! We’d really appreciate it.
***The script is invite-only, message us to get script access***
-------------------------------------------------------------------------------------------------
The MATRIX: Ultimate Crypto Position Strategy should be used as follows:
• The trading strategy was designed and optimized for trading cryptocurrencies only ; furthermore it works best on established high market cap cryptocurrencies that have a clear trend such as:
BTCUSD
ETHUSD
LTCUSD
XRMUSD
EOSUSD
ADAUSD
DASHUSD
ETCUSD
• The trading strategy is based on swing/position methodology. The script must therefore be used on daily timeframe candles only (1D) .
• Use USD trading pairs only (e.g. use ETHUSD instead of the ETHBTC) since the individual trend is captured more effectively and therefore gives better results.
-------------------------------------------------------------------------------------------------
The MATRIX:Ultimate Crypto Position Strategy is based on the following indicators:
• Ichimoku Cloud ; acts as the leading indicator.
• Volume ; without strong volume , a market move is not valid.
• MACD and Vortex ; both being used as confirmation indicators.
• Choppiness index ; avoids trading in choppy markets.
• Bullish/ Bearish Regular Divergences in combination with RSI to spot tops and bottoms.
• Simple and Exponential Moving Averages ; prêvents trading against the trend.
The trading strategy is easy to use, trend based and without repainting, meaning once a signal has been made it is permanent and that no future data is used in the decision making. It detects the trend and filters out market noise based on more than 10 technical indicators. ONLY when all indicators align with each other the algorithm prints a BUY or SELL signal. The trading strategy provides high probability trading signals and minimizes risk! This script aims to capture the profit from longer term trending moves and by doing so filters out non-substantial trends and avoids the associated risks with these trades.
-------------------------------------------------------------------------------------------------
The MATRIX: Ultimate Crypto Position Strategy has the following features:
• Automatically generated Buy / Sell alerts in the form of a label.
• NO Repaint once candle is closed.
• SAFEGUARD ; custom built-in security prevẹnts trading when the price is out of equilibrium.
• Customizable Display for the Ichimoku cloud indicator display.
-------------------------------------------------------------------------------------------------
Below are the backtest results. Keep in mind that this strategy is quite conservative resulting in few long positions. These results are therefore no guarantee for the future.
Back test results: (only Long trades, signal to signal, order size: 100% of equity, commision fee 0.1%, period: start of chart)
Exchange-----Asset---------Timeframe---Percent Profitable----Profit Factor-----Total Trades----Max Drawdown---Average bars in trade-----Net Profit
Coinbase-----BTC/USD---------1D----------------100----------------N/A------------------10---------------0.00---------------------54-------------------6183.6
Coinbase-----ETH/USD---------1D----------------100----------------N/A------------------7----------------0.00---------------------46-------------------11673.0
Coinbase-----LTC/USD---------1D-----------------100---------------N/A-------------------7----------------0.00---------------------46------------------4727.0
Bínance------EOS/USD---------1D-----------------100---------------N/A-------------------3----------------0.00---------------------34------------------42.8
Bínance------ADA/USD---------1D-----------------100---------------N/A-------------------2----------------0.00---------------------40------------------118.4
Coinbase-----XTZ/USD---------1D-----------------100---------------N/A-------------------1----------------0.00---------------------36------------------34.4
Bínance------BNB/USD---------1D-----------------66.7--------------10.8-------------------6---------------24.22--------------------38------------------1488.8
Bínance------ETC/USD---------1D-----------------100---------------N/A-------------------2----------------0.00---------------------33------------------94.9
Bínance------XMR/USD---------1D-----------------100---------------N/A-------------------3----------------0.00---------------------43------------------74.2
Bínance------ICX/USD----------1D-----------------100---------------N/A-------------------2----------------0.00---------------------29------------------215.3
-------------------------------------------------------------------------------------------------
Reminder: Use this trading strategy at your own risk and trade responsibly. We are not responsible for any financial loss using this strategy.
***The script is invite-only, message us to get script access***

Failed ReversalThis is built on False Reversal or say Profit Booking logic where price is moving in an direction and suddenly reverses but then fails to sustain on that reversal and comes back to original trend.This is a Trend Following system and the entry exits are based on price action using 2 candles wherein close of second candle defines Entry and low of previous is SL.This also has an Stop loss Filter so that user's can avoid the trades having big candles as per their risk appetite .

eha Moving Averages StrategyMoving Average based strategies are very popular ones among both long-term investors and short-term traders as they can be tailored to any time frame. One of the main moving average strategies are crossovers. The very simple type is a price crossover , which is when the price crosses above or below a moving average to signal a potential change in trend.
Another strategy is to apply two moving averages to a chart: one longer (or slow) and one shorter (or fast). When the shorter-term MA crosses above the longer-term MA, it's a buy signal, as it indicates that the trend is shifting up (also known as “ Golden Cross ”). Meanwhile, when the shorter-term MA crosses below the longer-term MA, it's a sell signal, as it indicates that the trend is shifting down (which is also known as “ Dead/Death Cross ”).
This is a study to find a suitable trading strategy for 4-6 hour time frames. As you can see the performance is currently very poor. It has just generated almost 90 trades in a very long period from January 2017 to the time of publishing the study for the first time.
Moving averages work quite well in strong trending conditions but poorly in choppy or ranging conditions. Adjusting the time frame can correct this problem temporarily, although, at some point, these issues are likely to occur regardless of the time frame chosen for the moving average(s).
I am working on this basic strategy to make its performance better and I will update the post in the future. So keep in touch by following the post.
Why have I republished my study?
It sounds like TradingView stores and indexes scripts based on the title of the post rather than the actual title of the scripts and if one chose general terms as the title of the post, the TradingView script search engine may be unable to find it. So I decided to repost the strategy with a more searchable and unique prefix of " eha ".
Please provide me with your precious feedback.

Crypto Tipster Pro+ (Optimized for LTCUSD)===========
Crypto Tipster Pro+ Optimized for LTCUSD
===========
This script is a carbon-copy of our Crypto Tipster Pro Strategy , but also includes our Custom & Fully Optimized Settings for turbo-charging your Litecoin (LTCUSD) trading.
-----------
We keep all our Crypto Tipster Pro+ (Optimized) strategies regularly updated and maintained. The purpose of these Add-On's to our Crypto Tipster Pro Strategy is to keep each trading plan relevant, up-to-date and most of all profitable within ever-changing markets.
We will always keep our main Crypto Tipster Strategy active, as we find the default settings are the best "all-rounder" set-up and work with many crypto pairs over many different time frames, try it for yourself! This Set-Up for Litecoin enables you to hone in on one certain trading pair on the 'D' chart and maximize your overall trading experience.
-----------
Visit the link below for Full & Immediate Access!
Good Luck and Happy Trading!

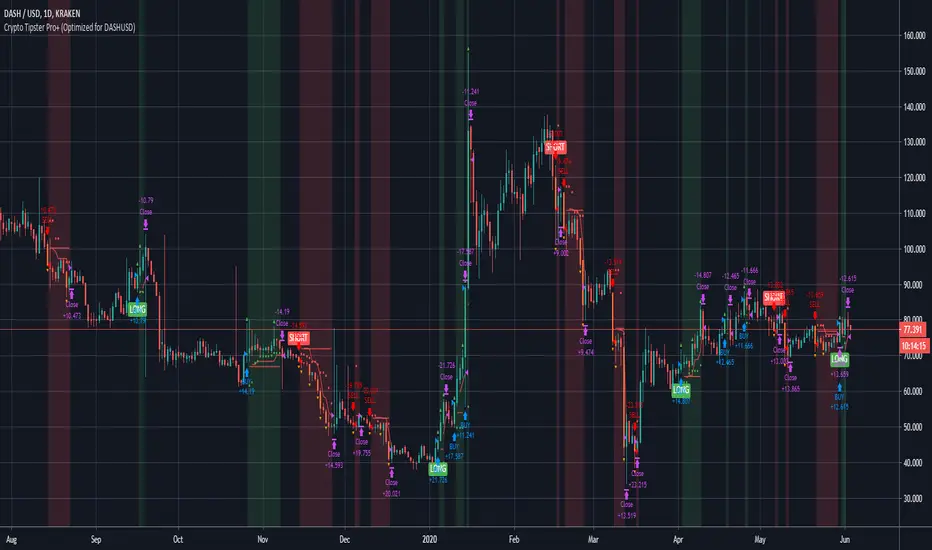
Crypto Tipster Pro+ (Optimized for DASHUSD)===========
Crypto Tipster Pro+ Optimized for DASHUSD
===========
This script is a carbon-copy of our Crypto Tipster Pro Strategy , but also includes our Custom & Fully Optimized Settings for turbo-charging your DASH (DASHUSD) trading.
-----------
We keep all our Crypto Tipster Pro+ (Optimized) strategies regularly updated and maintained. The purpose of these Add-On's to our Crypto Tipster Pro Strategy is to keep each trading plan relevant, up-to-date and most of all profitable within ever-changing markets.
We will always keep our main Crypto Tipster Strategy active, as we find the default settings are the best "all-rounder" set-up and work with many crypto pairs over many different time frames, try it for yourself! This Set-Up for DASH enables you to hone in on one certain trading pair on the 'D' chart and maximize your overall trading experience.
-----------
Visit the link below for Full & Immediate Access!
Good Luck and Happy Trading!