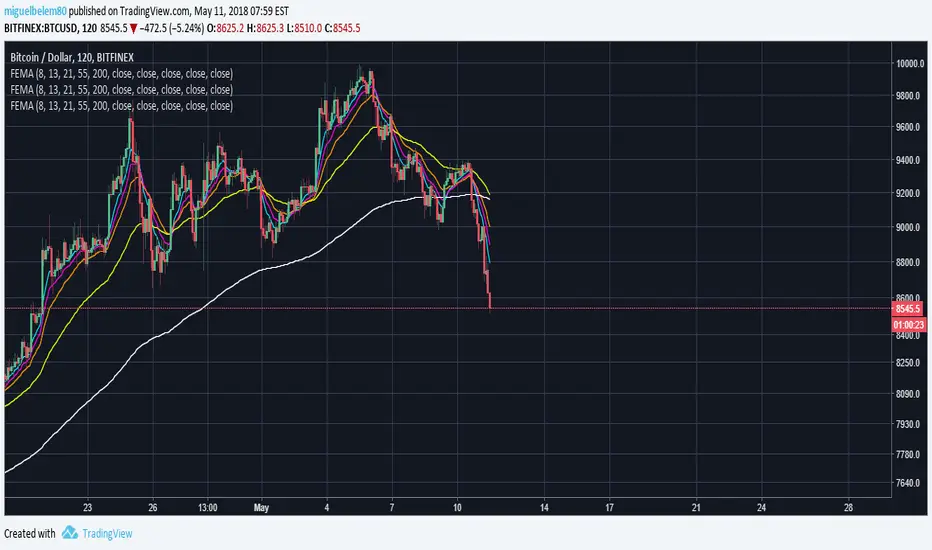
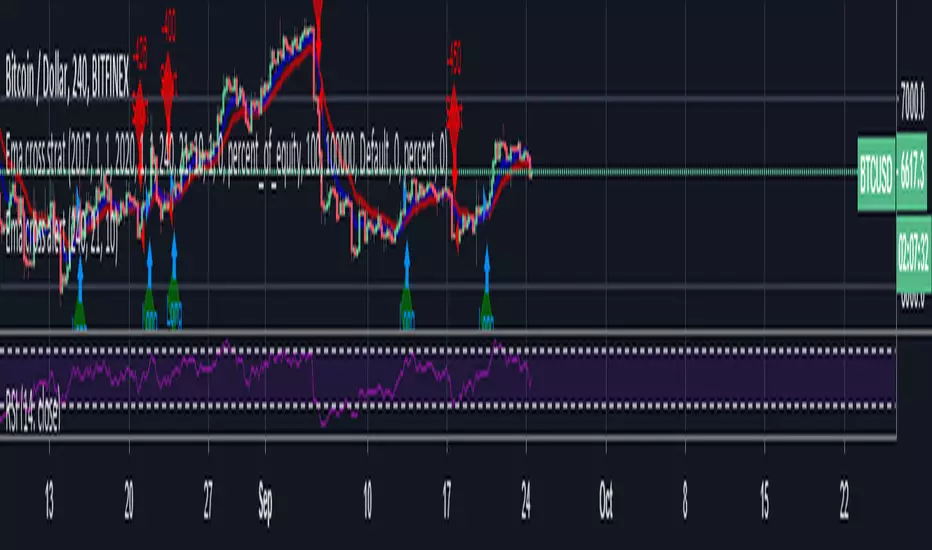
Ema cross strat / Turtle Trading This is just a simple EMA cross strategy which is meant to be similar to Turtle Trading Strategy.
It uses in default 4 Hour 21 / 10 EMA to long or short. This is not perfect but in the long run it will profit. Works best in bull market.
LINK TO ALERT :
Trading
Megalodon Pro+ Short Term IsolatorMEGALODON PRO+ Short Term Isolator
Megalodon Pro+ is designed for shorter term investors.
Megalodon Pro+ is really simple to use.
Megalodon Pro+ combines 16 different back-tested indicators , that each have more than 66% win rate.
Megalodon Pro+ lets you turn on or off any setups that have been used for a better analysis.
Megalodon Pro+ works with any kind of market state, and any kind of asset.
Megalodon Pro+ can be used to set alarms as soon as a candle closes with a green or red bar.
Megalodon Pro+ has more features than any other indicator in the market, these features can also be turned off in the settings:
Looks for 6 different shorter time frame setups automatically and prints them out.
Shows Mosasaur isolator and can also show Price, Volume and Momentum isolators.
Prints green or red bar s for shorter term signals .
--------------------------------------
MEGALODON PRO+ Short Term Isolator is designed for shorter term investors!
All you have to do is:
1- Apply it on any asset with 240 minutes and 60 minutes time frame and combine it with 1 Day MEGALODON PRO+ Long Term Isolator.
2- Look for green bar confirmation on all isolators.
3- Define your stop losses.
4- Define your target before you enter.
5-Repeat.
--------------------------------------
iPyra◬
Enlighten others

Megalodon Pro+ Long Term IsolatorMEGALODON PRO+ Long Term Isolator
Megalodon Pro+ is designed for longer term and shorter term investors.
Megalodon Pro+ is really simple to use.
Megalodon Pro+ combines 16 different back-tested indicators , that each have more than 66% win rate .
Megalodon Pro+ lets you turn on or off any setups that has been used for a better analysis.
Megalodon Pro+ works with any kind of market state, and any kind of asset.
Megalodon Pro+ can be used to set alarms as soon as a candle closes with a green or red bar.
Megalodon Pro+ has more features than any other indicator in the market, these features can also be turned off in the settings :
Looks for 12 different investing setups automatically and prints them out.
Shows 2 different viewing options: Setups View that shows how many bear or bull setups are currently formed, Isolator View that shows Megalodon Price,Volume and Momentum isolators.
Prints green or red bars for longer term signals.
--------------------------------------
MEGALODON PRO+ Long Term Isolator is designed for longer term and shorter term investors!
All you have to do is:
1- Apply it on any asset with 1Day time frame and combine it with 240minutes and 60 minutes Megalodon Pro+ Short Term Isolator.
2- Look for green bar confirmation on all isolators.
3- Define your stop losses.
4- Define your target before you enter.
5-Repeat
--------------------------------------
iPyra◬
Enlighten others

Megalodon ProMEGALODON PRO
Megalodon Pro is designed for longer term investors.
Megalodon Pro is really simple to use.
Megalodon Pro combines 16 different back-tested indicators , that each have more than 66% win rate .
Megalodon Pro works with any kind of market state, and any kind of asset.
Megalodon Pro can be used to set alarms as soon as a candle closes with a green or red arrow.
Megalodon Pro has more features than any other indicator in the market, these features can also be turned off in the settings :
Looks for 12 different investing setups automatically and prints them out.
Finds and prints longer term and shorter term Fibonacci Retracement levels.
Prints Long Fibonacci levels or Short Fibonacci levels.
Finds and prints a custom Fibonacci level that you might want.
Shows overlapping Fibonacci levels for longer term and shorter term.
Overlays Bollinger Bands.
--------------------------------------
Megalodon Pro is designed for longer term investors!
All you have to do is:
1- Apply it on any asset with 1Day time frame .
2- Look for green arrow close.
3- Define your stop loss if you prefer to have it.
4- Define your target before you enter.
5-Repeat
--------------------------------------
iPyra◬
Enlighten others


BitcoinNinjas 'Ninja Signals' Buy/Sell Alert Trading Script v3.0Bitcoin Ninjas 'Ninja Signals' Buy/Sell Alerts & Backtesting TradingView Script v3.0
(for Cryptocurrencies, Forex, GunBot, ProfitTrailer, automatic trading software, and more)
This is version 3 of our popular Ninja Signals trading script, which is similar to version 2, but with a new hard-coded calibration (resolution) setting that automatically matches candle size (period) to ensure that no repainting occurs regardless of the number or type of indicators and filters traders apply when configuring the script.
'Ninja Signals' v3.0 (SCRIPT)
'Ninja Signals' v3.0 (STRATEGY)
'Ninja Signals' v2.0 (SCRIPT)
'Ninja Signals' v2.0 (STRATEGY)
'Ninja Signals' v1.0 (SCRIPT)
'Ninja Signals' v1.0 (STRATEGY)
-Allows users to easily set automated buy and sell alerts on TradingView for use with automatic and manual trading of cryptocurrencies, Forex securities, and more (alerts are compatible with automatic trading software such as GunBot, ProfitTrailer, and more).
-Synthesizes many powerful indicators [e.g. Relative Strength Index (RSI), stochastic RSI, Money Flow Index (MFI), Moving Average Convergence Divergence (MACD), etc.) into one super script to generate very precise buy and sell signals in almost any market condition.
-Buy arrows (blue) and sell arrows (red) can be changed or hidden for ease of viewing.
-No lag EMA trendline featuring trend-reversal color-coding (white uptrend, black downtrend).
-Adjustable ‘calibration’ setting allows users to customize the script to work for any currency or security available through TradingView, on any exchange, simply by adjusting a number.
-Complete with backtesting strategy version of script which allows users to test various buy and sell strategies based on the alerts the script generates (see info and screenshots below).
-Backtesting strategy incorporates a user-defined adjustable date range, so users can estimate the script’s performance over specific periods of time, such as the last day, week, or month.
-Backtesting strategy utilizes a minimum protective gain setting to help you never sell for a loss. Simply adjust your minimum profit (%) per trade, and the test results will update.
-Backtesting strategy allows for pyramid buying to test various average down / double up buying strategies. Simply adjust the number of pyramid buys and the quantity of each buy.
- Free 7-day trial available for TradingView users who join our free BitcoinNinjas community.
-Free 24/7 support via BitcoinNinjas Telegram GunBot support group with script purchase.
-Fully compatible with GunBot automatic trading software (TradingView plugin is required).
-Special discount available for traders who purchase GunBot automatic trading software and the GunBot TradingView plugin from BitcoinNinjas, allowing for fully automatic trading.
-Contact us via Email or Telegram for more information, to request additional / custom screenshots, or to start your free trial.
DISCLAIMER: By using our BitcoinNinjas ‘Ninja Signals’ planning script, you agree to the BitcoinNinjas 'Terms of Use', as presented on our website (www.BitcoinNinjas.org) and as stated here. No sharing, copying, reselling, modifying, or any other forms of use are authorized for our documents, script / strategy, and the information published with them. This informational planning script / strategy is strictly for individual use and educational purposes only. This is not financial or investment advice. Investments are always made at your own risk and are based on your personal judgement. Bitcoin Ninjas is not responsible for any losses you may incur. Please invest wisely.

BitcoinNinjas Ninja Signals Buy/Sell Alert Trading Strategy v3.0Bitcoin Ninjas 'Ninja Signals' Buy/Sell Alerts & Backtesting TradingView Script v3.0
(for Cryptocurrencies, Forex, GunBot, ProfitTrailer, automatic trading software, and more)
This is version 3 of our popular Ninja Signals trading script, which is similar to version 2, but with a new hard-coded calibration (resolution) setting that automatically matches candle size (period) to ensure that no repainting occurs regardless of the number or type of indicators and filters traders apply when configuring the script.
'Ninja Signals' v3.0 (SCRIPT)
'Ninja Signals' v3.0 (STRATEGY)
'Ninja Signals' v2.0 (SCRIPT)
'Ninja Signals' v2.0 (STRATEGY)
'Ninja Signals' v1.0 (SCRIPT)
'Ninja Signals' v1.0 (STRATEGY)
-Allows users to easily set automated buy and sell alerts on TradingView for use with automatic and manual trading of cryptocurrencies, Forex securities, and more (alerts are compatible with automatic trading software such as GunBot, ProfitTrailer, and more).
-Synthesizes many powerful indicators [e.g. Relative Strength Index (RSI), stochastic RSI, Money Flow Index (MFI), Moving Average Convergence Divergence (MACD), etc.) into one super script to generate very precise buy and sell signals in almost any market condition.
-Buy arrows (blue) and sell arrows (red) can be changed or hidden for ease of viewing.
-No lag EMA trendline featuring trend-reversal color-coding (white uptrend, black downtrend).
-Adjustable ‘calibration’ setting allows users to customize the script to work for any currency or security available through TradingView, on any exchange, simply by adjusting a number.
-Complete with backtesting strategy version of script which allows users to test various buy and sell strategies based on the alerts the script generates (see info and screenshots below).
-Backtesting strategy incorporates a user-defined adjustable date range, so users can estimate the script’s performance over specific periods of time, such as the last day, week, or month.
-Backtesting strategy utilizes a minimum protective gain setting to help you never sell for a loss. Simply adjust your minimum profit (%) per trade, and the test results will update.
-Backtesting strategy allows for pyramid buying to test various average down / double up buying strategies. Simply adjust the number of pyramid buys and the quantity of each buy.
- Free 7-day trial available for TradingView users who join our free BitcoinNinjas community.
-Free 24/7 support via BitcoinNinjas Telegram GunBot support group with script purchase.
-Fully compatible with GunBot automatic trading software (TradingView plugin is required).
-Special discount available for traders who purchase GunBot automatic trading software and the GunBot TradingView plugin from BitcoinNinjas, allowing for fully automatic trading.
-Contact us via Email or Telegram for more information, to request additional / custom screenshots, or to start your free trial.
DISCLAIMER: By using our BitcoinNinjas ‘Ninja Signals’ planning script, you agree to the BitcoinNinjas 'Terms of Use', as presented on our website (www.BitcoinNinjas.org) and as stated here. No sharing, copying, reselling, modifying, or any other forms of use are authorized for our documents, script / strategy, and the information published with them. This informational planning script / strategy is strictly for individual use and educational purposes only. This is not financial or investment advice. Investments are always made at your own risk and are based on your personal judgement. Bitcoin Ninjas is not responsible for any losses you may incur. Please invest wisely.
Crypto Reversal Scalper STARTER KIT AlertsThis is alerts for automated trading for:
This is a starter kit for people to try out.
Since many people were confused to how to properly config the original script, I decided to create this script.
This script uses the original script but is compiled to have presets.
Simple to use, EASY AS 1,2,3
1. Choose PAIR
2. Sync chart with chosen pair (Symbol and Timeframe)
3. DONE!
4. (Optional) Adjust Stoploss and Takeprofit
This will be FREE for people to consider giving it a try.
To automate the trades, you will need to have the alerts for the script.
If you want to automate the trades, PM me.

Trunico3 -- @TrueCrypto28New version of Trunico.
Looking really nice for calling Shorts and longs.
We will releasing this scripts soon through @TrueCrypto28 Twitter.
Regards.

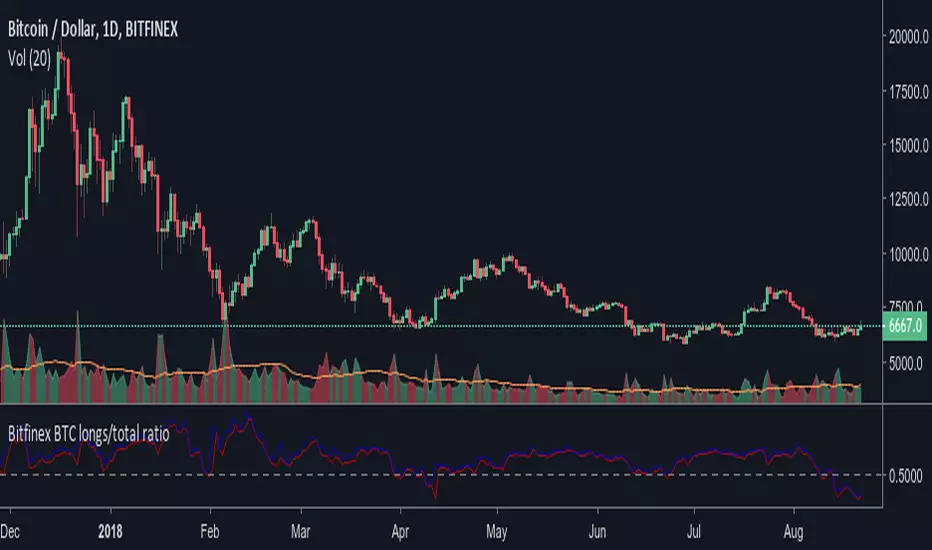
Bitfinex BTC longs/total ratioRatio of bitfinex longs versus the total btc in positions. Maybe a good indicator of market sentiment. It allows you to see too where were people taking profit or closing positions. Remember that ratio going up doesn't necesarily mean more longs positions are being added. It could mean shorts are closing position massively. The conversely is also true.
The rate above 0.5 doesn't necesarily bullish, though, and the indicator is "timeframe" agnostic. So take into account that there could be tons of longs positions that were opened since back before summer 2017, It seems to be too of positions opened at prices below 4.000$. That's why the average seems to be around 0.6.
The blue lines indicates current ratio (or on close for past bars). The red line is the max ratio (higher shorts versus lowest longs).

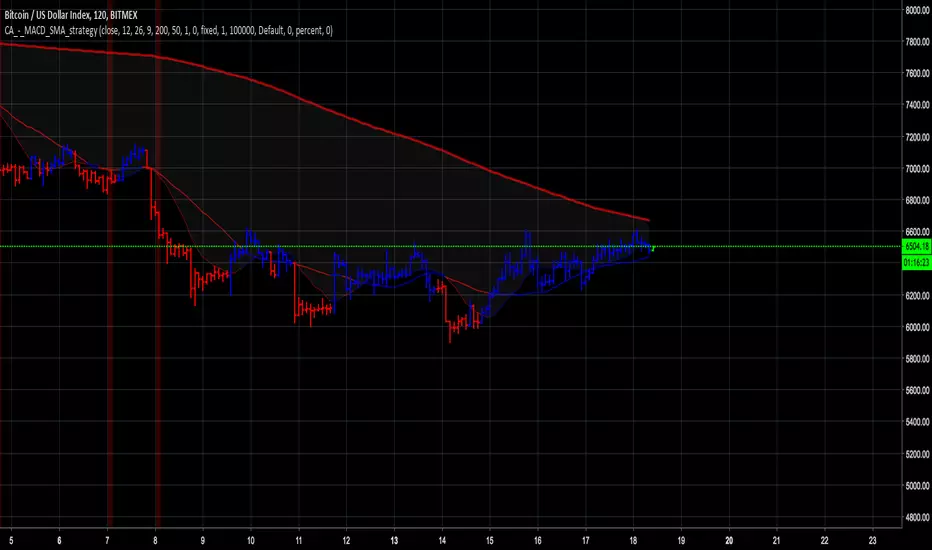
MACD + SMA 200 StrategyHere is a combination of the classic MACD (moving average convergence divergence indicator) with the classic slow moving average SMA with period 200 together as a strategy.
This strategy goes long if the MACD histogram and the MACD momentum are both above zero and the fast MACD moving average is above the slow MACD moving average. As additional long filter the recent price has to be above the SMA 200. If the inverse logic is true, the strategy goes short. For the worst case there is a max intraday equity loss of 50% filter.
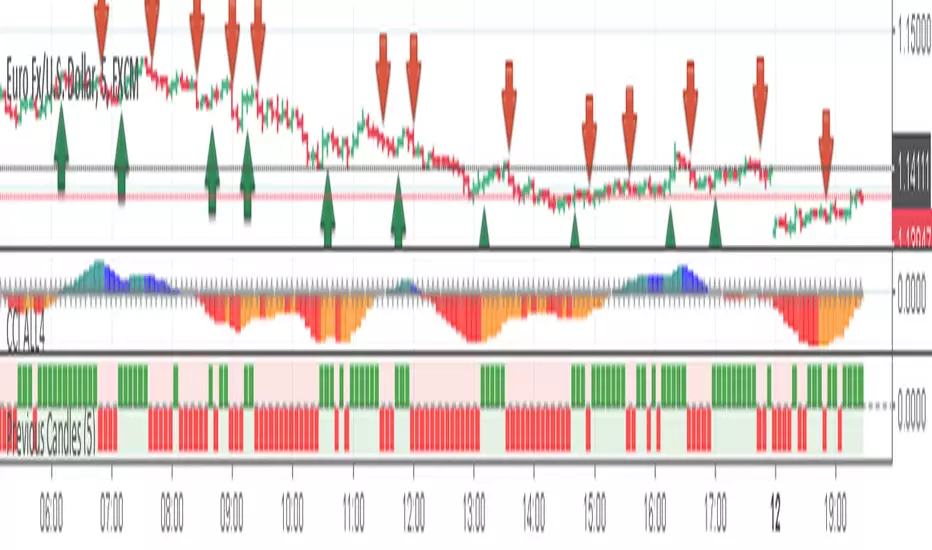
Previous CandlesThis is an indicator based on the average of the maximum and minimum of the past candle, and there is another strategy that makes the filter, it is very good for binary options, if you combine our indicator CCI and All4 it gets even better!
Currency: Any pair.
TimeFrame: 5m
Execute order: You can enter 1 minute or 5 minutes.
In the graph below the ICC, you can see the green and red squares, it works as follows.
Before giving any input you have to enter the change of a color.
Example: It was red and now it's green, so you could give the entry, but you must have at least 3 squares of red before, if only 1 squared has appeared, the hit percentage will be low!
The CCI indicator is for confirmation.
Any doubt I am available!
Note: This indicator does not make magic nor is it a holy grall, it is only an indicator to aid in binary operations!
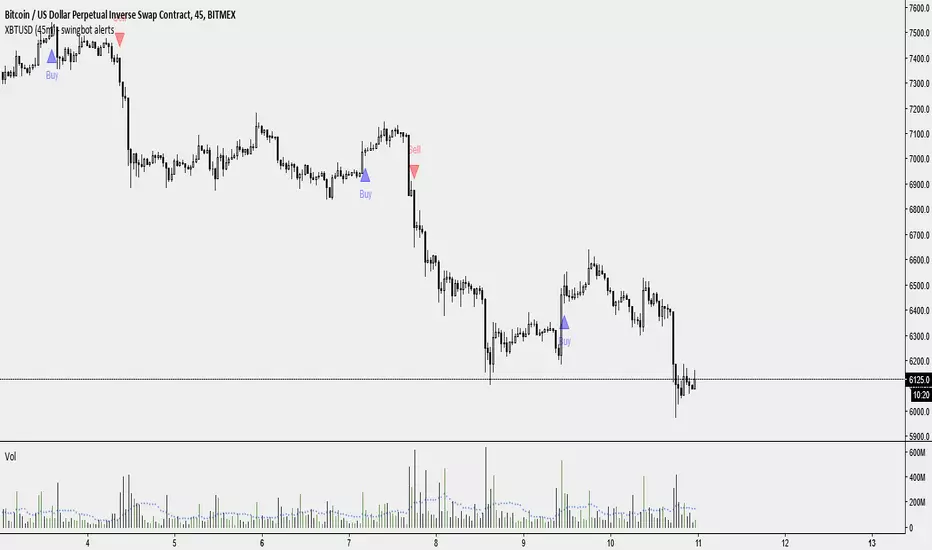
XBTUSD (45m) - swingbot alertsTo accompany my swingbot script to allow alerts - for automated trading via autoview
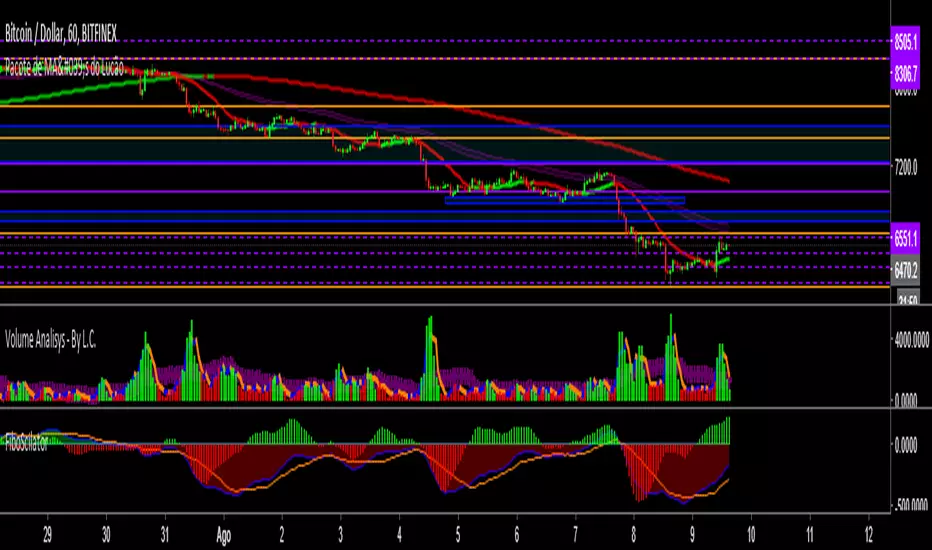
FiboScilator - Simple trade systemOscillator based on M.A.s with the Fibonacci sequence.
MAIN MODE (more secure)
Blue Line above Zero = Purchase Mode
Blue Line below Zero = Mode of Sale
SECONDARY MODE (Aggressive)
Blue Line above Orange Line = Purchase Mode
Blue Line below Orange Line = Way of Selling
The Historiogram accompanies the Secondary Mode.
This indicator is only a study, not a financial council. Make your trading decisions on your own.
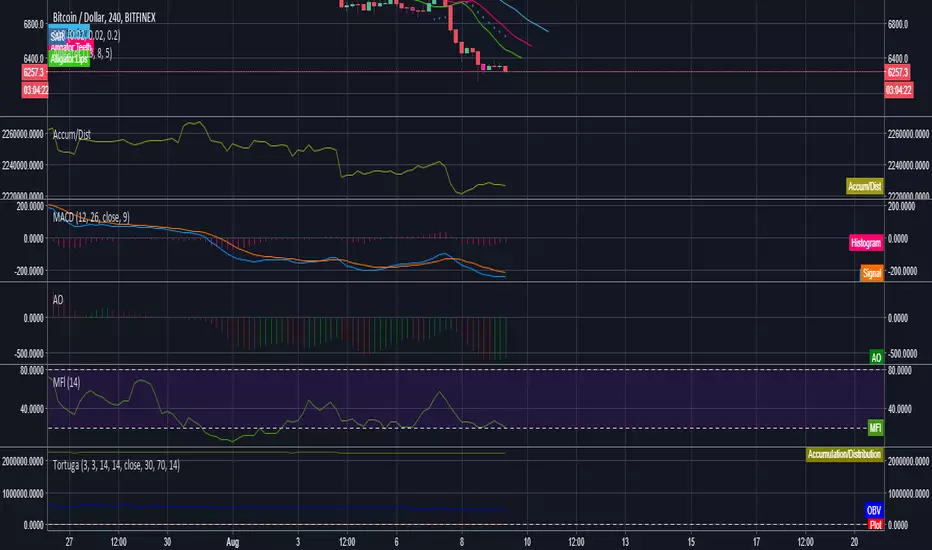
Tortuga IndicatorAfter long hours of figuring out what the fuck makes my indicator tick - the Tortuga indicator is finally finished. This indicator entails multiple conditions from indicators: AO, MACD, STOCH RSI, MFI, AD, and OBV. The help identify the most optimal Long or Short positions. The indicator also has been coded to identify Bullish and Bearish divergences on timeframes that have been tested to have a significant effect on prices. The indicator has been backtested to have a 75% win rate with long and short positions on timeframes: 15m, 30m, 45m, 1hr, 2hr, 3hr, and 4hr.
Indicator Guidelines/Legend:
Signals:
Blue Candle: Long Signal
Yellow Candle: Short Signal
Divergences:
Fuchsia Candle: 5 length Bull Divergence
Purple Candle: 10 length Bull Divergence
White Candle: 5 length Bear Divergence
Silver Candle: 10 length Bear Divergence
Gray Candle: 20 length Bear Divergence
The Divergence candles are merely suggestions and hints for potential price movements. While they have been shown to be effective position signals, they have not been backtested - stick with the Blue and Yellow candles.
This indicator is for sale with a monthly fee, DM for details. The price will increase upon updates and successful forward testing.
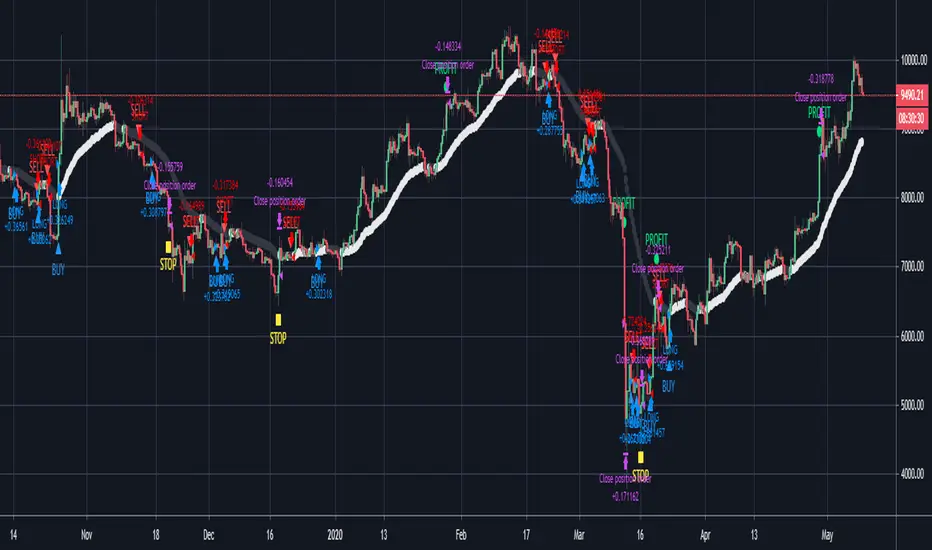
14/28 Day SMA Divergence and RSI - No RepaintIf you are interested in purchasing my algorithmic trading bot that receives Tradingview indicator alerts via email and then executes them in Bittrex, please visit my product page here: ilikestocks.com Additionally, I would love to create video/blog guides on creating Tradingview scripts or strategies. If you are a knowledgeable in finance or other related fields and would like to be featured on my page, please contact me at tanner@ilikestocks.com.
No crossovers were used in this script, and this is likely the reason for the no repaint(Correct me if wrong).
This strategy script uses a 14-day SMA signal line, a 28-day SMA and RSI. The strategy works by determining whether the (14-day SMA is above the 28-day SMA and the RSI levels are overbought(below 30)) or RSI is very overbought(below 13 or so). Once either of these conditions have been met, a long position is opened.
The initial long position must be partially closed by the take profit first and then the final close is executed if the 14-day signal SMA is below the 28-day SMA; you may also exclusively use take profit to close positions.
The green plotted spikes are the initial long position conditions. The orange plotted spikes are take profit signals once a long position is opened. The red plotted spikes are plotted when the SMA 14-day is below the 28-day SMA.
Please do leave constructive criticism or comments below because it helps me better create scripts!

FTA 2.3This is the latest Version of FTA 2. It gets a separate script space to not disturb the 2.2 Users with the changes:
Revamped sells into one system again. It uses MFI and RSI from different periods to find better selling points. This has been a partial weakness of FTA 2.2 especially in downtrend.
Included Trailing-Stop with a third alert for people who like it
Included Take-Profit: Sell your given percentage above the last buy if you like (Not recommended with low percentages in crypto market*)
Finally added "sell" label above sell symbols
*Advanced Users may find Trailing-Stop in combination with a low-margin Take-Profit useful though. It can recreate Risk/Reward trading

Modified Fisher Strategy Alerts BitcoinAlerts for strategy using Fisher transform with modification and implemented into Bitcoin trading perspective

Modified Fisher Strategy BitcoinStrategy using Fisher transform with modification and implemented into Bitcoin trading perspective