tlc with False BreakoutThe strategy aims to identify a trend line channel with the potential for a false breakout. Here's an explanation of the strategy:
The script starts by defining the input parameters. The lookback parameter determines the number of previous bars to consider for detecting the trend lines, and the threshold parameter controls the sensitivity of the trend line detection.
The script then initializes variables to store the trend lines, tap count, and the false breakout signal.
Inside the loop, the script iterates over the specified number of bars (lookback) to identify the trend lines. It checks if the current high is greater than the previous and next highs to identify an upper trend line and sets it using the line.new function. Similarly, it checks if the current low is smaller than the previous and next lows to identify a lower trend line and sets it.
The script also keeps track of the price levels of the upper and lower trend lines using the variables upperTrendLinePrice and lowerTrendLinePrice. These price levels are obtained using the line.get_y1 function.
After the fourth tap (when tapCount is equal to 4), the script checks if the current close price is above the upper trend line or below the lower trend line. If this condition is met, it sets the falseBreakout variable to true, indicating a potential false breakout.
Finally, the script plots a shape marker (plotshape) when a false breakout occurs. This is represented by an orange label displayed below the bar.
At the end of the script, the line.delete function is used to remove the old trend lines when the script reaches the last bar (barstate.islast).
By using this strategy, you can visually identify trend line channels where the upper and lower lines touch higher highs or lower highs and higher lows or lower lows. Additionally, it provides a false breakout signal when the price breaks above the upper trend line or below the lower trend line on the fifth tap.
突破趨勢線
[TT] Entry ProIndicators doesnt make money, it is the concept behind the indicator that makes money. Please read and understand before contact. This is not for beginners or people who are looking for Buy Sell signals. Purely for those who can understand the concept of confluence.
This indicator will help you identify the Entry candle with confluence of SMC or Pivots or any other analysis that you use.
Rules to follow :-
1. Identify Support Resistance (Smart Money Concept), Pivots, Trendlines (Choice is Yours)
2. Once Identified S&R Look for Bearish Candle at resistance or Bullish signal at Support, mark the areas
NSE:NIFTY
3. At Support as shown above in examples if the pink candle or the confirmation candle doesnt close break the support but closes above the support area, we do not consider it as break down. Some time breakdown happens and then at retest we get the bearish signal, that will be a good entry.
4. Like wise at resistance if you cant see a bullish signal breaking the resistance area, we do not consider break out. Same as above sometimes we get a signal after breakout and while retesting. Bullish SIgnal At support example is given below
NSE:BANKNIFTY
5. Enter in to a trade right when you get the signal use less lot size when you do and once you see price coming in to the range of the colored candle keep accumulating more at OHLC areas, first at high of colored candle and then close and then HL2 areas likewise, this helps to reduce your SL.
Note:
Areas to remember and not to get confused. At Important levels (Support or Resistance) once you get a relavent signal while retesting that signal you get a counter signal do not get confused by that and exit the trade. once you enter a trade you have to remain there as long as your SL is not hit. Remember that You have to use this retest candles to enter in to a trade, but not to get scared.
How to Use this in Swing or Long term trading? Futures or Stocks !!!
Look at the setup below Use weekly Chart to analyze for investment. In the below chart you can see there is a breakout of Swing high with candle and then a retest happened Twice but that area is intact. The best strategy to consider confluence is SMC. Thats what my perfect Setup is. You can use Orderblock to see if that orderblock is valid or not. Below you can see NSE:BANKNIFTY
Few more Stocks for Example. NSE:AXISBANK
BITSTAMP:BTCUSD
OANDA:EURUSD
Strictly Not assuring any 100% results. You need to least be confident on one concept of trading to aquire results.

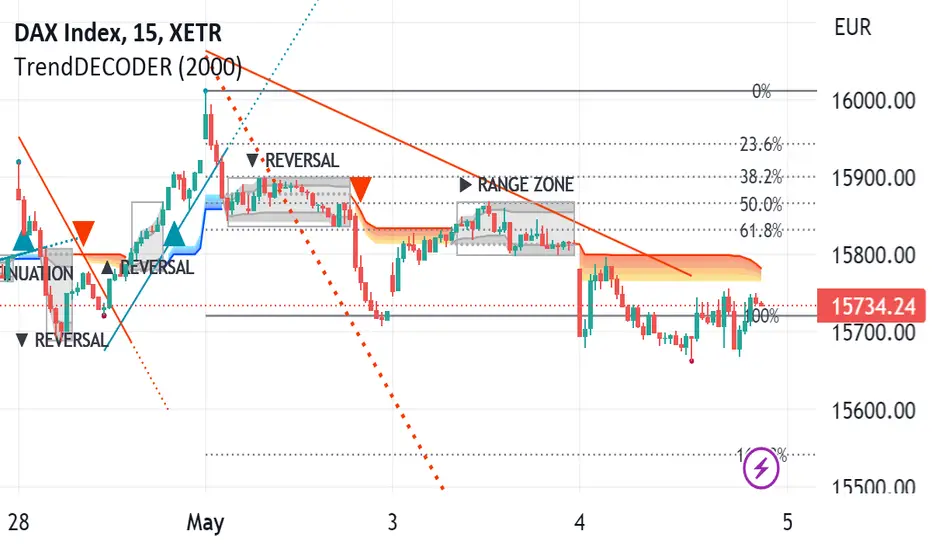
TrendDECODER by MetaSignalsProTrendDECODER
The fastest indicator to detect trends and price ranges
-------------------------------------------------------------------
✔️ Identify ranges and the next probable direction
✔️ Get the earliest signals and the strength of Trends
✔️ Get clear exits signals before reversal
✔️ Spot the Fibo levels the price will test
-------------------------------------------------------------------
📌 What is it about ?
--------------------------
TrendDECODER is a concentrate of multiple innovations to make Trend following simple and easy.
Please see in the 🛠️ Calculation & Precisions section at the end of this page to know more how they work.
👉 With the GreyBox - identify when the market gets out of the Trend with a new sequence of transition. Check if the market is in Range, Continuation or Reversal (Up or Down) and wait for the closing of the box to get the Trend signal.
👉 With the DecoderSignals & Blue/Orange Clouds - once the GreyBox has delivered its message, get the new direction of the Trend and see the probable zones of pull backs during the current direction.
👉 With the Projective TrendLine - see before it happens the direction and the possible angle of the Trend with its probable range.
👉 With the RealTime TrendLine vs the Projective TrendLine - adjust immediately if the market accelerates North or South.
👉 With the RealTime TrendLine Crossing - detect at the earliest the moment the Trend gets out of track, to get out of the train.
👉 With the FiboLevels - spot immediately which price levels the market will test.
📌 For which asset?
-----------------------
TrendDECODER is universal : it works fine on all assets and all time-frames;
☝️ always work on a multi-timeframe environment to minimize risk;
📌Why we made these innovations?
---------------------------------------------
Because the trend indicators that we know, lag a lot and do not clearly identify ranges!
We need much more powerful tools than Supertrend or a couple of moving averages crossings to get this done.
📌 How to trade with TrendDECODER?
----------------------------------------------
🔹 Strategy #1: Trend Following : DecoderSignals & Blue/Orange Clouds
----------------------------------------------------------------------------------------
The GreyBOX has given the next probable movement and the Signal of a Trend in on.
The RealTime TrendLine guides us on the pace of this movement and the Blue/ Orange/Cloud figures the support/resistance of this movement.
It will be wise not to jump immediately in the Trend as the signal appears as the price will very probably make a pullback in direction of the cloud first.
🔹 Strategy #1: Checklist
📍 Set a Multi Time Frame environment
📍 Main Time Frame and the Upper Time Frame are moving in the same direction (Up or Down)
📍 Main Time Frame: appearance of the « TrendUp Signal » or the « TrendDown Signal »
📍 Entry:
☝️ buying « at Market » immediately on a « Trend Signal » is quite risky as many times the price will pull back near the Clouds
👉 a good option is to buy 1/2 the position at market on signal
👉 and 1/2 after the first pull back
📍 First Stop Loss: place your SL under the lower border of the GreyBox for an expected TrendUp or the higher border for an expected TrendDown
📍 BreakEven: when the price reaches your Risk/Reward ratio of 1 = Distance StopLoss vs Entry = Distance Current Price vs Entry
📍 Trailing Stop: just under the lowest border of the Blue Cloud (TrendUp) or the highest border of the Orange Cloud (TrendDown)
📍 TakeProfits: in a TrendUP, place your take profits just under the FibosLevels in order not to get exited (and above in a TrendDOWN)
📍 Exits:
👉 Early option : Crossing of the RealTime TrendLine
👉 Late option : Crossing of the Blue/Orange cloud
🔹 Strategy #2: Early Trend following : RealTime TrendLine Crossing
-------------------------------------------------------------------------------------
With this simple tool, get a very early signal of a probable inversion of the current Trend, way before the Decoder Signal is shown, once confirmed by the GreyBOX.
🔹 Strategy #2: Checklist
📍 Set a Multi Time Frame environment
📍 Main Time Frame and the Upper Time Frame are moving in the same direction (Up or Down)
📍 Entry (Main Time Frame): wait for the Close crossing over the ReaTime TrendLine in an expected TrendUp (under for a TrendDown )
📍 First Stop Loss (Main Time Frame):
👉 place your SL under the lower low of the GreyBOX (for an expected TrendUp) or the higher high (for an expected TrendDown)
📍 BreakEven: move your SL to Entry price when the price reaches your Risk/Reward ratio of 1 = Distance StopLoss vs Entry = Distance Current Price vs Entry
📍 Trailing Stop: just under the lowest border of the Blue Cloud (TrendUp) or the highest border of the Orange Cloud (TrendDown)
📍 TakeProfits: in a TrendUP, place your take profits just under the FibosLevels in order not to get exited (and above in a TrendDOWN)
📍 Exits:
👉 Early option : Crossing of the RealTime TrendLine
👉 Late option : Crossing of the Blue/Orange cloud
🎛️ Configuration
---------------------
Well, basically you do not have to do anything !
But you can make TrendDECODER perfectly yours with a few switches in the configuration panel to make appear or disappear each one of the elements composing TrendDECODER.
🛠️ Calculation & Precisions
------------------------------------
🔹 Blue/Orange Clouds
The Blue/Orange Clouds are a proprietary synthesis of Price Action and Volume Exchange in real time.
🔹 Projective TrendLine
As soon as a new high or a new low has been reached during the last move, TrendDECODER traces a possible angle of the future movement based on the pace of the last one in the same direction.
The distance between the Projective TrendLine and the Last Lowest (resp. Highest) gives you a possible bottom (resp. top) of the price range.
🔹 RealTime TrendLine
As soon as the Decoder GreyBox has delivered its information i.e Range/Continuation/ReversalUp/ReversalDown and that a New High (resp. New Low) has been reached, the RealTime TrendLine starts to show the pace and the angle of the new movement based on a linear regression adanced concept.
The angles of the Projective and the RealTime TrendLine can be identical, telling you that the market moves smoothly in a global consensus. It can be a smart Trailing Stop Loss.
Or these angles can be very different and it will call your maximum attention. You might want to switch to a superior timeframe to get the bigger picture.
🔹 FiboLevels
Once a new Trend is signaled, the levels of Fibonnaci are automatically placed.
They are calculated on the last Highest and Lowest of the former movement.
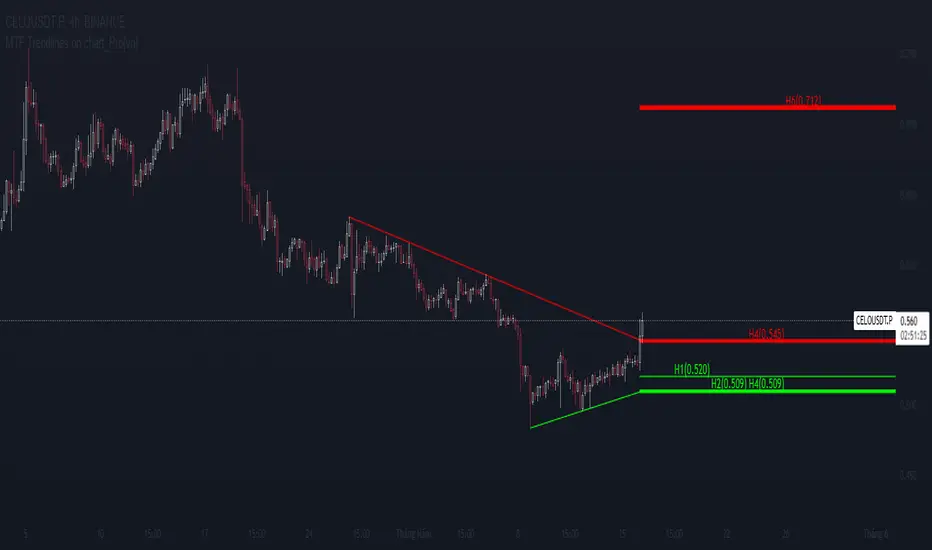
MTF Trendlines on chart_Pro[vn]Hello Traders .
👉This is an indicator of the trendlines in the analysis series with my trendlines.
- It statistics the upper and lower trend lines of the current Time Frame.
- Pine Script strategy draws pivot points and trendlines on the chart.
- This strategy allows the user to specify the interval to calculate the pivot points and the number of pivot points used to generate the trend lines.
- In the process of trading with the trendline, I see different timeframes showing each trendline differently, many times the trendline in the 15m frame has been broken but I don't know where the price is going, and it takes a lot of time to find support points, resistance to entry or take profit, So I came up with the idea of drawing different timeframes on the same chart in a specified timeframe, and I found it shortened the time to find support and resistance points in trading without having to switch back and forth between timeframes.
- For example, when the H1 trendline breaks downwards, we can determine a high probability that the price will be supported by the trendlines below it. for us to find entry points or exit orders effectively. Or when the price breaks the H1 trendline to go up, the chart shows us the trend lines above that broken H1 line so that we have a more effective entry or take profit point because it is a resistance zone....
- It can shows 7 pairs of trendlines during different times in the chart.
- each timeframe will display two trendlines, one up, and one down.When the price crosses a trendline, only one valid trendline is displayed, while the line crossed is not displayed.
- The upper trendline (down trend) is a red horizontal line, with the timeframe name and the value of its trendline, for example 4H(1.234) means timeframe = H4, the current value of the trendline is 1.234.
- The trendline below (up trend) is the blue horizontal line that also represents the same value as the line above.
- In the Settings section, up to 6 different timeframes can be selected to display those trendlines on the chart.
- Small timeframes such as m1, m3, m5 or D1 I leave the default (cannot be changed) in the 'Length' setting = 50, timeframe is H6, H8, H12 'Length' = 30, the rest of the time can be changed, the default is 20 ...
- Some cases I have applied with this indicator to look for entry points and take profit ...
Xin chào Trader Việt nam.
- Đây là chỉ báo về các đường xu hướng trendline trong chuỗi phân tích với đường xu hướng của tôi. Chỉ báo này là muti trendlines trên biểu đồ , nó hiển thị được tối da 7 cặp đường xu hướng trong các thời gian khác nhau trên 1 biểu đồ.Dựa vào đó các trader có cái nhìn trực quan nhất không phải thay đổi qua lại các thời gian để tìm các đường trendlines, và có thể tìm được những cú hồi hoặc phá ngưỡng để vào lệnh hoặc chốt lời .
- Thực ra trong quá trình giao dịch với đường xu hướng, tôi thấy các khung thời gian khác nhau thì hiển thị mỗi đường xu hướng khác nhau, nhiều khi đường xu hướng trong khung 15m đã bị phá nhưng không biết giá đi đến đâu, và mất rất nhiều thời gian để tìm các điểm hỗ trợ, kháng cự để vào lệnh hoặc chốt lời, nên tôi nảy ra ý tưởng vẽ ra các khung thời gian khác nhau trên cùng 1 biểu đồ trong một khung thời gian được chỉ định, và tôi thấy rút ngắn được thời gian để tìm các điểm hõ trợ , kháng cự trong giao dịch mà không cần phải chuyển qua lại giữa các khung thời gian .
- Chẳng hạn ,khi đường xu hướng H1 bị phá vỡ xuống dưới thì ta có thể xác định được khả năng cao giá sẽ được hỗ trợ bởi những đường xu hướng bên dưới nó. để ta tìm điểm vào lệnh hoặc thoát lệnh cho hiệu quả.Hoặc khi giá phá vỡ đường xu hướng H1 để đi lên , thì trên biểu đồ đã hiện cho ta các đường trendline bên trên đường H1 bị phá vỡ đó để ta có điểm vào hoặc chốt lời hiệu quả hơn vì đó là vùng kháng cự....
- Đường xu hướng bên trên(down trend) là đường kẻ ngang màu đỏ ,có kèm tên timeframe và giá trị của đường xu hướng của nó,ví dụ 4H(1.234) nghĩa là timeframe=4H, giá trị hiện tại đường trendline là 1.234.
- Đường xu hướng bên dưới (up trend) là đường ngang màu xanh cũng thể hiện giá trị như đường bên trên.
- Các timeframe nhỏ như 1m, 3m, 5m hoặc 1D tôi để mặc định (không thay đổi được) trong setting mục 'Length' = 50, timeframe là 6H,8H,12H 'Length' = 30, các thời gian còn lại có thể thay đổi được ,mặc định là 20
- Để điều chỉnh có thể vào setting để thiết lập các thời gian theo nhu cầu.
Trend Reversal System with SR levelsHello All,
This is the Trend Reversal System with Support/Resistance levels script. long time ago I published it as closed source but now I upgraded it and and published as open-source with a different name. I hope it would be useful for you all while trading/analyzing.
The script has some parts in it: Setup, Count, SR levels, Risk levels & Targets . Now lets check them:
Setup Part: it has two part, Buy or Sell Setup. one of them can be active only. Buy setup: if current close checks if current is lower/equal than the close of the 5. bar. if yes then the script increases number of buy setup. and if it reaches 9 then the script checks if current low is lower/equal than the lows of last 3. and 4. bars, or if the low of the last bar is lower/equal than the lows of last 3. and 4. bars. if yes then the script increases the buy setup by 1. if these conditions met then it puts the label 'S' , same for Sell setup. S labels on both setup are potential reversals.
Count Part: If buy or sell setup reaches the 9 then Count part starts from 1. lets see buy count: If current close is lower/equal than the low of the 3. bar and buy count is lower than 12 or low of the bar 13 is less than or equal to the close of bar 8 then buy count increase or it's completed. if it's completed then the script puts C label, and it's potential reversal. of course there are some conditions that can cancel the count buy/sell or recycle/restart.
By using Setup and Count levels the script can show Support/Resistance Levels, Risk levels & Targets. SR levels are potential reversal levels.
Lets see some example screenshots:
Support/Resistance levels:
Potential Reversal levels and how setup/counts are shown:
Count part can recycle and the script shows it as 'R' , ( you can see the conditions for Recycle in the script ):
Count can be cancelled and and it's shown as 'x'
If the scripts find 9 on Setup or 13 on Count then it checks if it's a good level to buy/sell and if it decides it's good level then it shows TRSSetup Buy/Sell or TRSCount Buy/Sell and also shows the target. in following example the script checks and decide it's a good level to take long position. it can be aggressive or conservative, Conservative is recommended.
Enjoy!

Steel Step Assistant: Trend Visualizer + Market Flow 1.0This is a market flow signal indicator. Flow with the market and you will find yourself in good hands.
This indicator simply gives you a signal of the RIGHT time to follow a market trend/direction. The indicator is designed with Steel Step strategy rules for determining directions.
It calculates and provides the most market direction signals within a particular period of time.
It also gives a relatively accurate signal of trend reversals. Being an indicator, it is prone to a certain extent of inaccuracy. It is programmed to provide an accurate market direction/flow to the best of its abilities.
Always remember that the Steel Step strategy does not rely on indicators to trade.
The trend visualizer is an ordinary table that shows you trends in different time frames.
This indicator can be used on all charts and markets; crypto, commodities, forex, stock, indices, etc.
It is suitable for intra-day traders.
One way of using this is to enhance your information gathering on trends in order to understand the market structure or direction better.
This indicator helps educate users on the market structure. Users can quickly break down the market into layers, analyze the layers and connect them all to understand the market as a whole. After users understand the market, users need to decide and choose a specific trend they want to trade. The basic idea is to flow with the market.
This indicator can be combined with EW theory to understand the market structure easily.
When I understand the whole market structure, it boosts my trading performance to the maximum.
According to the Steel Step strategy, this indicator is designed to show the trend "one layer" above "the current TF layer". This method has been tested to enhance accuracy. This may sound confusing to some of you. You can find educational materials about the layer logic from my Steel Step strategy.
Find the instructions on how to view signals below.
***SIGNAL GUIDE***
To view signals/set signal alerts:
- To view 15min signals, use 3min chart
- To view 1H signals, use 15min chart
A second version to include more time frame layers and trends will be published soon. Look forward to it!
Please comment below or message me if you have any questions. Enjoy!
*Nobody should use this indicator as a confirmation signal for entry/exit for your trades. Please message me on how to use this indicator correctly. This indicator was designed to be used in conjunction with my Steel Step strategy, hence the name.

Pivot Trendlines with Breaks [HG]🧾 Pivot Trendlines and Breaks
A script meant to debut and provide an example usage of the Simple Trendlines library using Pine Script's built-in pivot system.
In under 50 lines of code, with inputs, plots, styling, and alerts included we're able to create trendlines with a breakout system.
▶️ How it works
Calculating pivot points helps traders identify moments at which the market's attitude can shift from bullish to bearish. In the background, the script tracks pivot events for trendlines and uses a system that prevents any leakage between the trendlines before they are drawn.
⚫️ Settings
Pivot Length
Color Adjustments
⚫️ Alerts

Rainbow Collection - VioletMoving averages come in all shapes and types. The most basic type is the simple moving average which is simply the sum divided by the quantity. Therefore, the simple moving average is the sum of the values divided by their number.
In technical analysis, you generally use moving averages to understand the underlying trend and to find trading signals. In the case of the Violet indicator, we are using a Hull moving average which is a special variation based on different weights to minimize lag.
The Violet indicator is therefore used as follows:
* A bullish signal is generated whenever the close price surpasses the 20-period Hull moving average while the previous close prices from periods were all below their respective Hull moving average of the period.
*A bearish signal is generated whenever the close price breaks the 20-period Hull moving average while the previous close prices from periods were all above their respective Hull moving average of the period.
The aim of the Violet indicator is to capture reversals as early as possible through a combination of lagged conditions based on the Fibonacci sequence.

Steel Step Assistant: Trend VisualizerSpecial thanks to Turicumo and Psychil for helping me write the code, both from my group.
Disclaimer: Nobody should use this indicator as a confirmation signal for entry/exit for your trades. Please message me on how to use this indicator correctly. This indicator was designed to be used in conjunction with my Steel Step strategy, hence the name.
This indicator simply gives a quick outlook of the market.
This indicator is an ordinary table that shows you the trends.
The default settings produce directions that are very similar to what I use for my strategy. You can change the settings as desired.
This indicator can be used on all charts and markets; crypto, commodities, forex, stock, indices, etc.
It is suitable for intra-day traders, as well as HTF traders.
One way of using this is to enhance your information gathering on trends in order to understand the market structure or direction better.
This indicator educates users on the market structure. Users can quickly break down the market into layers, analyze the layers and connect them all to understand the market as a whole. After users understand the market, users need to decide and choose a specific trend they want to trade. The basic idea is to flow with the market.
This indicator can be combined with EW theory to understand the market structure easily.
When I understand the whole market structure, it boosts my trading performance to the maximum.
Please comment below or message me if you have any questions. Enjoy!

RS Stage AnalysisThis script trying to detect different lifecycle of stock / Stages.
There is mainly 4 stages of stocks.
1) stage 1 - Accumulation = color = aqua
2) stage 2 - Advancing = color = green
3) stage 3 - Distribution = color = yellow
4) stage 4 - Declining = color = red
At some point the condition i wrote wont detect any stage.

RSI Trendlines with BreakoutsA pivot-based breakout indicator that attempts to provide traders with a visual aid for finding breakouts on the RSI. Similar to how we use trendlines on our charts, using them on the Relative Strength Index can also give us a sense of direction in the markets.
This script uses its own pivot-based system that checks for real-time swing levels and triggers a new pivot event after every dip and nth bars. The breakout alerts that are given were not designed to be taken as signals since their purpose is to provide an extra bit of confluence. Because of this, I added no other conditions that try to make the alerts "perfect", but instead, print every breakout that is detected. Despite stating this, I did happen to add a condition that checks the difference in RSI and the breakout value, but that's as far as it'll go.
There are alerts built-in to the script, along with adjustable repainting options.
🔳 Settings
Lookback Range: Lookback period to trigger a new pivot point when conditions are met.
RSI Difference: The difference between the current RSI value and the breakout value. How much higher in value should the current RSI be compared to the breakout value in order to detect a breakout?
RSI Settings
Styling Options
🔳 Repaint Options
On: Allows repainting
Off - Bar Confirmation: Prevents repainting and generates alerts when the bar closes. (1 candle later)
🔳 How it Works
Before a trendline is drawn, the script retrieves the slope between the previous pivot point and the current. Then it adds or subtracts the slope x amount of times (based on the lookback range) from the current pivot value until the current x-axis is reached. By doing this we can get a trendline that will detect a breakout accurately.
The result
When using the RSI Difference condition, the script will print breakouts whenever the condition is true, because of this dotted lines were added to track where the alert was triggered.
🔳 Alerts

Faytterro Market Structerethis indicator creates the market structure with a little delay but perfectly. each zigzag is always drawn from highest to lowest. It also signals when the market structure is broken. signals fade over time.
The table above shows the percentage distance of the price from the last high and the last low.
zigzags are painted green when making higher peaks, while lower peaks are considered downtrends and are painted red. In fact, the indicator is quite simple to understand and use.
"length" is used to change the frequency of the signal.
"go to past" is used to see historical data.
Please review the examples:

MTF Trendlines_Pro[vn]-This is an indicator for trendline traders
-it statistics the upper and lower trend lines of the Multi Time Frame.
-Pine Script strategy draws pivot points and trendlines on the chart.
-This strategy allows the user to specify the interval to calculate the pivot points and the number of pivot points used to generate the trend lines.
-I use the "Trendlines_Pro " indicator to interpret the indicator "MTF trendlines_Pro " indicator for everyone to understand
-time frames are selected in settings like 1m,3m,15m,1h,2h,4h,6h,12h,1D.1W.1Month..
-If the price is in a wedge pattern, it is represented by the upper and lower parameters, the upper parameter is the resistance point of the upper trendline,the lower parameter is the support point of the below trendline
-when the price distance is <=1% from the trendline, the upper or lower parameter is colored blue (above) or red (below).
-when only the parameter is accompanied by the ⇗ or ⇘. symbol, it tells us that the price has not broken the corresponding trend line
-when showing green heart and % break .indicates that the price has broken the downtrend line to become an uptrend.
On the contrary, the red heart % breaks, it signals us to break the uptrend line to become a downtrend
-when showing parameters 12(1)|18(2)|20(3) and green heart, then :(3) shows that the price has broken out before 20 candles, (2) shows that there are 18 candles to close above The breakout point, (1) represents the last 12 candles that closed above the breakout point and as if a nice uptrend has occurred because 98% of the candles have closed above the breakout point....the opposite of The red heart is the price that broke below the trendline below.
-"MTF trendlines_Pro "indicator is integrated for both the trendline of the price line and the RSI. You can change it in the settings as shown below.
----------------------------------------------------------------------------
vietnamese
-Đây là chỉ báo dành cho các trader thuộc trường phái phân tích đường xu hướng
-nó thống kê các đường xu hướng trên và dưới của Multi Time Frame.
-Chiến lược Pine Script vẽ các điểm trục và đường xu hướng trên biểu đồ.
-Chiến lược này cho phép người dùng chỉ định khoảng thời gian tính toán các điểm xoay và số điểm xoay được sử dụng để tạo các đường xu hướng .
-tôi có dùng chỉ báo trendline_pro dùng để diễn giải chỉ báo MTF trendlines_pro cho mọi người dễ hiểu
-các khung thời gian được lựa chọn trong cài đặt như 1m,3m,15m,1h,2h,4h,6h,12h,....
-Nếu giá đang trong mô hình cái nêm thì được thể hiện bằng tham số trên và tham số dưới, tham số trên là điểm kháng cự của đường xu hướng bên trên,tham số dưới là điểm hỗ trợ của đường xu hướng bên dưới
-khi giá cách đường xu hướng <=1% thì tham số trên hoặc dưới được tô màu xanh (trên) hoặc đỏ(dưới)
-khi chỉ có tham số kèm theo biểu tượng ⇗ or ⇘.thì cho ta biết là giá chưa phá vỡ được đường xu hướng tương ứng
-khi hiện trái tim xanh và % phá vỡ .báo hiệu cho ta biết giá đã phá vỡ đường xu hướng giảm trở thành xu hướng tăng.
ngược lại trái tim đỏ % phá vỡ thì báo hiệu cho ta phá vỡ đường xu hướng tăng trở thành xu hướng giảm
-khi hiện thông số 12(1)|18(2)|20(3) và trái tim xanh thì :(3) thể hiện giá đã phá vỡ trước đó 20 nến,(2) thể hiện có 18 cây nến đóng cửa trên điểm phá vỡ,(1) thể hiện có 12 nến gần nhất đóng cửa trên điểm phá vỡ và như vạy xu hướng tăng đẹp đã xảy ra vì chiếm đến 98% nến đã đóng cửa trên điểm phá vỡ....ngược lại với trái tim đỏ là giá đã đột phá xuống dưới đường xu hướng bên dưới
-chỉ báo MTF trendlines_pro được tích hợp chung cho cả trendline của đường giá và RSI .các bạn có thể thay đổi trong phần cài đặt như hình bên dưới.
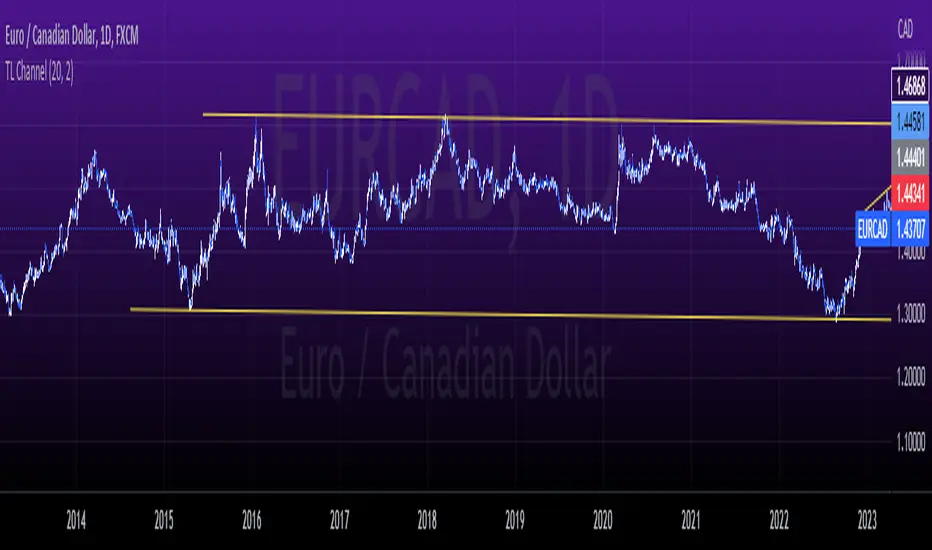
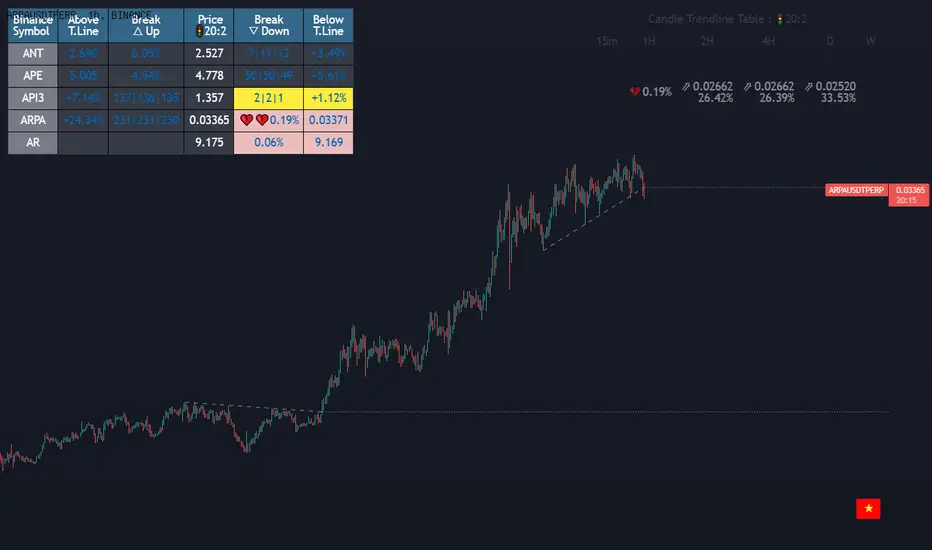
Dashboard trendlines Price(ichimoku14642)Happy new year 2023
Dedicated to traders, the trendline indicator of 5 trading pairs is automatically listed in this table. Wish success
-on each chart of a trading pair, there is only one trendline pair: 1 uptrendline and 1 downtrendline
-so when the statistics on the table also show the column of the uptrend and the column of the downtrend
-When the price approaches any trendline but the ratio is 1%, that trendline will be colored blue (downtrend), red (uptrend)
-the column above T.line(below T.line) is the value of the current trendline compared to the closing price of the candle
-The Break up (Break down) column when the price breaks will show the green heart (break up), the red heart break (break down) and the percentage value when breaking through the point of the trendline.
-price column is the current price of the candle
-SYMBOL is all taken from Binance in the perpetual contract
-especially when a candle has closed above the trendline (assuming an uptrend), then from the 2nd tree to the current , it will count according to memory so that traders know when the price broke, and how many candles already.
-The breakdown parameter is displayed (for example, 3|8|10), which means that the price has broken through 10 candles, of which 8 trees are closing above the breakout point, and the last 3 are closing above. break point
-In addition, when displaying 3 parameters as above, the next column (above/below T.line) will display the percentage from when the price breaks that point to the current price of the candle.
Thank you everyone for your interest and trust
Đây là script về bảng thống kê đường trendline .
-trên mỗi biểu đồ của cặp giao dịch chỉ tồn tại duy nhất 1 cặp trendline là: 1trendline tăng và 1 trendline giảm
-vì vậy khi thống kê trên bảng cũng hiển thị cột của trend tăng và cột của trend giảm
-khi giá tiến gần đến 1 đường trendline bất kì mà tỉ lệ còn 1% thì đường trendline đó tô màu xanh(trend giảm) ,màu đỏ(trend tăng)
-cột above T.line(below T.line) là giá trị của đường trendline hiện tại so với giá đóng cửa của nến
-cột Break up(Break down) khi giá phá vỡ sẽ thể thiện trái tim xanh(phá vỡ lên),trái tim đỏ vỡ(phá vỡ xuống) và giá trị phần trăm khi phá qua điểm của trendline.
-cột giá là giá hiện tại của nến
-SYMBOL là toàn bộ lấy của sàn Binance trong hợp đồng vĩnh cửu
-đặc biệt khi 1 cây nến đã đóng cửa trên đường trendline(giả sử trend tăng) thì từ cây thứ 2 đến hiện tại nó sẽ đếm theo bộ nhớ để các trader biết được giá đã phá khi nào,và qua bao nhiêu nến rồi.
-thông số khi phá vỡ hiển thị (ví dụ là 3|8|10) thì hiểu là giá đã phá vỡ qua 10 nến, trong đó có 8 cây đóng cửa trên điểm phá vỡ,và 3 cây gần nhất đang đóng cửa trên điểm phá vỡ
-ngoài ra khi hiện 3 thông số như trên thì cột bên cạnh (above/below T.line) sẽ hiển thị được số phần trăm tính từ khi giá phá vỡ điểm đó đến giá hiện tại của cây nến.
Cảm ơn mọi người đã quan tâm và tin dùng
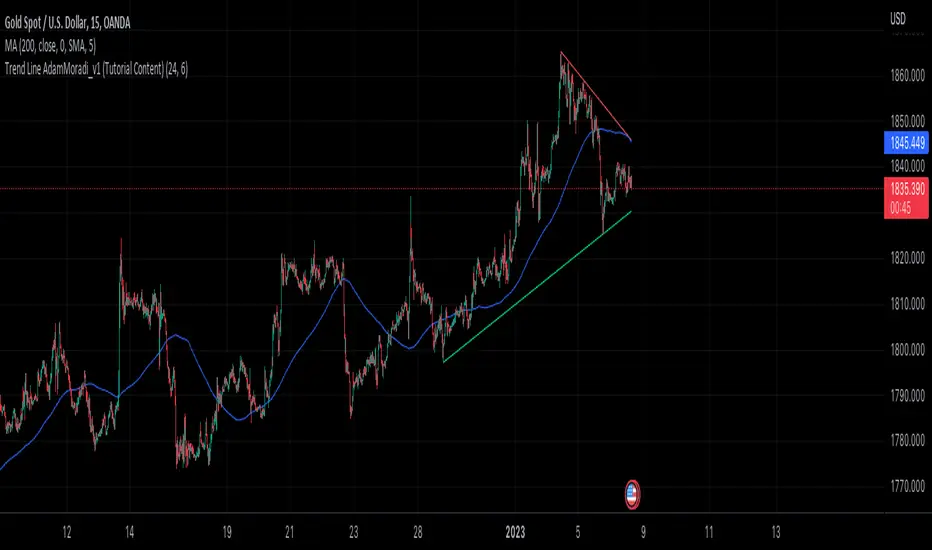
Trend Line Adam Moradi v1 (Tutorial Content)
The Pine Script strategy that plots pivot points and trend lines on a chart. The strategy allows the user to specify the period for calculating pivot points and the number of pivot points to be used for generating trend lines. The user can also specify different colors for the up and down trend lines.
The script starts by defining the input parameters for the strategy and then calculates the pivot high and pivot low values using the pivothigh() and pivotlow() functions. It then stores the pivot points in two arrays called trend_top_values and trend_bottom_values. The script also has two arrays called trend_top_position and trend_bottom_position which store the positions of the pivot points.
The script then defines a function called add_to_array() which takes in three arguments: apointer1, apointer2, and val. This function adds val to the beginning of the array pointed to by apointer1, and adds bar_index to the beginning of the array pointed to by apointer2. It then removes the last element from both arrays.
The script then checks if a pivot high or pivot low value has been calculated, and if so, it adds the value and its position to the appropriate arrays using the add_to_array() function.
Next, the script defines two arrays called bottom_lines and top_lines which will be used to store trend lines. It also defines a variable called starttime which is set to the current time.
The script then enters a loop to calculate and plot the trend lines. It first deletes any existing trend lines from the chart. It then enters two nested loops which iterate over the pivot points stored in the trend_bottom_values and trend_top_values arrays. For each pair of pivot points, the script calculates the slope of the line connecting them and checks if the line is a valid trend line by iterating over the price bars between the two pivot points and checking if the line is above or below the close price of each bar. If the line is found to be a valid trend line, it is plotted on the chart using the line.new() function.
Finally, the script colors the trend lines using the colors specified by the user.
Tutorial Content
'PivotPointNumber' is an input parameter for the script that specifies the number of pivot points to consider when calculating the trend lines. The value of 'PivotPointNumber' is set by the user when they configure the script. It is used to determine the size of the arrays that store the values and positions of the pivot points, as well as the number of pivot points to loop through when calculating the trend lines.
'up_trend_color' is an input parameter for the script that specifies the color to use for drawing the trend lines that are determined to be upward trends. The value of 'up_trend_color' is set by the user when they configure the script and is passed to the color parameter of the line.new() function when drawing the upward trend lines. It determines the visual appearance of the upward trend lines on the chart.
'down_trend_color' is an input parameter for the script that specifies the color to use for drawing the trend lines that are determined to be downward trends. The value of 'down_trend_color' is set by the user when they configure the script and is passed to the color parameter of the line.new() function when drawing the downward trend lines. It determines the visual appearance of the downward trend lines on the chart.
'pivothigh' is a variable in the script that stores the value of the pivot high point. It is calculated using the pivothigh() function, which returns the highest high over a specified number of bars. The value of 'pivothigh' is used in the calculation of the trend lines.
'pivotlow' is a variable in the script that stores the value of the pivot low point. It is calculated using the pivotlow() function, which returns the lowest low over a specified number of bars. The value of 'pivotlow' is used in the calculation of the trend lines.
'trend_top_values' is an array in the script that stores the values of the pivot points that are determined to be at the top of the trend. These are the pivot points that are used to calculate the upward trend lines.
'trend_top_position' is an array in the script that stores the positions (i.e., bar indices) of the pivot points that are stored in the 'trend_top_values' array. These positions correspond to the locations of the pivot points on the chart.
'trend_bottom_values' is an array in the script that stores the values of the pivot points that are determined to be at the bottom of the trend. These are the pivot points that are used to calculate the downward trend lines.
'trend_bottom_position' is an array in the script that stores the positions (i.e., bar indices) of the pivot points that are stored in the 'trend_bottom_values' array. These positions correspond to the locations of the pivot points on the chart.
apointer1 and apointer2 are variables used in the add_to_array() function, which is defined in the script. They are both pointers to arrays, meaning that they hold the memory addresses of the arrays rather than the arrays themselves. They are used to manipulate the arrays by adding new elements to the beginning of the arrays and removing elements from the end of the arrays.
apointer1 is a pointer to an array of floating-point values, while apointer2 is a pointer to an array of integers. The specific arrays that they point to depend on the arguments passed to the add_to_array() function when it is called. For example, if add_to_array(trend_top_values, trend_top_posisiton, pivothigh) is called, then apointer1 would point to the tval array and apointer2 would point to the tpos array.
'bottom_lines' (short for "Bottom Lines") is an array in the script that stores the line objects for the downward trend lines that are drawn on the chart. Each element of the array corresponds to a different trend line.
'top_lines' (short for "Top Lines") is an array in the script that stores the line objects for the upward trend lines that are drawn on the chart. Each element of the array corresponds to a different trend line.
Both 'bottom_lines' and 'top_lines' are arrays of type "line", which is a data type in PineScript that represents a line drawn on a chart. The line objects are created using the line.new() function and are used to draw the trend lines on the chart. The variables are used to store the line objects so that they can be manipulated and deleted later in the script.
Loops
maxline is a variable in the script that specifies the maximum number of trend lines that can be drawn on the chart. It is used to determine the size of the bottom_lines and top_lines arrays, which store the line objects for the trend lines.
The value of maxline is set to 3 at the beginning of the script, meaning that at most 3 trend lines can be drawn on the chart at a time. This value can be changed by the user if desired by modifying the assignment statement "maxline = 3".
'count_line_low' (short for "Count Line Low") is a variable in the script that keeps track of the number of downward trend lines that have been drawn on the chart. It is used to ensure that the maximum number of trend lines (as specified by the maxline variable) is not exceeded.
'count_line_high' (short for "Count Line High") is a variable in the script that keeps track of the number of upward trend lines that have been drawn on the chart. It is used to ensure that the maximum number of trend lines (as specified by the maxline variable) is not exceeded.
Both 'count_line_low' and 'count_line_high' are initialized to 0 at the beginning of the script and are incremented each time a new trend line is drawn. If either variable exceeds the value of maxline, then no more trend lines are drawn.
'pivot1', 'up_val1', 'up_val2', up1, and up2 are variables used in the loop that calculates the downward trend lines in the script. They are used to store intermediate values during the calculation process.
'pivot1' is a loop variable that is used to iterate through the pivot points (stored in the trend_bottom_values and trend_bottom_position arrays) that are being considered for use in the trend line calculation.
'up_val1' and 'up_val2' are variables that store the values of the pivot points that are used to calculate the downward trend line.
up1 and up2 are variables that store the positions (i.e., bar indices) of the pivot points that are stored in 'up_val1' and 'up_val2', respectively. These positions correspond to the locations of the pivot points on the chart.
'value1' and 'value2' are variables that are used to store the values of the pivot points that are being compared in the loop that calculates the trend lines in the script. They are used to determine whether a trend line can be drawn between the two pivot points.
For example, if 'value1' is the value of a pivot point at the top of the trend and 'value2' is the value of a pivot point at the bottom of the trend, then a trend line can be drawn between the two points if 'value1' is greater than 'value2'. The values of 'value1' and 'value2' are used in the calculation of the slope and intercept of the trend line.
'position1' and 'position2' are variables that are used to store the positions (i.e., bar indices) of the pivot points that are being compared in the loop that calculates the trend lines in the script. They are used to determine the distance between the pivot points, which is necessary for calculating the slope of the trend line.
For example, if 'position1' is the position of a pivot point at the top of the trend and 'position2' is the position of a pivot point at the bottom of the trend, then the distance between the two points is given by 'position1' - 'position2'. This distance is used in the calculation of the slope of the trend line.
'different', 'high_line', 'low_location', 'low_value', and 'valid' are variables that are used in the loop that calculates the downward trend lines in the script. They are used to store intermediate values during the calculation process.
'different' is a variable that stores the slope of the downward trend line being calculated. It is calculated as the difference in value between the two pivot points (stored in up_val1 and up_val2) divided by the distance between the pivot points (calculated using their positions, stored in up1 and up2).
'high_line' is a variable that stores the current value of the trend line being calculated at a given point in the loop. It is initialized to the value of the second pivot point (stored in up_val2) and is updated on each iteration of the loop using the value of different.
'low_location' is a variable that stores the position (i.e., bar_index) on the chart of the point where the trend line being calculated first touches the low price. It is initialized to the position of the second pivot point (stored in up2) and is updated on each iteration of the loop if the trend line touches a lower low.
'low_value' is a variable that stores the value of the trend line at the point where it first touches the low price. It is initialized to the value of the second pivot point (stored in up_val2) and is updated on each iteration of the loop if the trend line touches a lower low.
'valid' is a Boolean variable that is used to indicate whether the trend line being calculated is valid. It is initialized to true and is set to false if the trend line does not pass through all the lows between the pivot points. If valid is still true after the loop has completed, then the trend line is considered valid and is drawn on the chart.
d_value1, d_value2, d_position1, and d_position2 are variables that are used in the loop that calculates the upward trend lines in the script. They are used to store intermediate values during the calculation process.
d_value1 and d_value2 are variables that store the values of the pivot points that are used to calculate the upward trend line.
d_position1 and d_position2 are variables that store the positions (i.e., bar indices) of the pivot points that are stored in d_value1 and d_value2, respectively. These positions correspond to the locations of the pivot points on the chart.
The variables d_value1, d_value2, d_position1, and d_position2 have the same function as the variables uv1, uv2, up1, and up2, respectively, but for the calculation of the upward trend lines rather than the downward trend lines. They are used in a similar way to store intermediate values during the calculation process.
thank you.
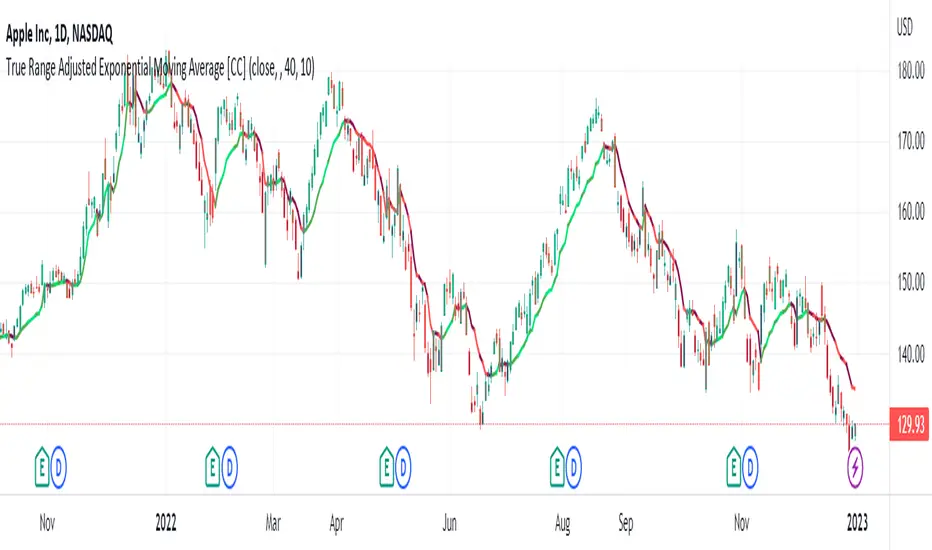
True Range Adjusted Exponential Moving Average [CC]The True Range Adjusted Exponential Moving Average was created by Vitali Apirine (Stocks and Commodities Jan 2023 pgs 22-27) and this is the latest indicator in his EMA variation series. He has been tweaking the traditional EMA formula using various methods and this indicator of course uses the True Range indicator. The way that this indicator works is that it uses a stochastic of the True Range vs its highest and lowest values over a fixed length to create a multiple which increases as the True Range rises to its highest level and decreases as the True Range falls. This in turn will adjust the Ema to rise or fall depending on the underlying True Range. As with all of my indicators, I have color coded it to turn green when it detects a buy signal or turn red when it detects a sell signal. Darker colors mean it is a very strong signal and let me know if you find any settings that work well overall vs the default settings.
Let me know if you would like me to publish any other scripts that you recommend!
Auto Trend Lines Breakouts and Bounces Signals and AlertsAuto Trend Lines Breakout with Confirmation Bounce Signals and Alerts
This indicator draws trend lines automatically based on the 2 pivot points, which are calculated based on the specified number of bars (length), which is of course customizable. The indicator then shows you when these trend lines get touched (potential bounce) or “almost touched” (Yes! The script can do that as well!) by the current price of the instrument or broken and then confirmed by the “after break come back touch” – classic! Everything is shown on the chart, and for everything - alarms can be set up with just a few clicks!
Now there are 2 modes here (you can hide all signals as well and just use the trend lines):
1) Current/recent trend lines only: will only show 2 current upper/lower trend lines as well as previous 2 for reference.
2) All time (historical) trend lines: will show 2 current upper/lower trend lines as well as the historical lines from the past and these lines are often very respected by the price!
Besides that, you can set the indicator to show you exactly what you want: Just the trend lines touches/bounces, breaks with confirmation touches/bounces or BOTH.
In addition to that, you can set the indicator to only show you these touches/bounces and breaks with additional confirmations, only if confirmed by :
- Moving Average (customizable length): LONG signals based off the trend lines will only be shown if above EMA, SHORT if below.
- Signals where the candle color confirms the direction of the trade, but the candle type is opposite (like a green colored bearish hammer for example) will be avoided (such candles can be very uncertain/deceptive)
- Signals where the signal candle is doji will be avoided (uncertain)
- Signals will only be shown if supported by the trend line slope (for example, with this feature turned on, if there is an upper line trend line, but the line is actually above, touching the top of the candles and the price touches/crosses it or it gets broken – there will be no signal as even though the trend line is an upper line above candles, it’s slope is positive (going up), if the slope would be down, like a classical down/bearish trend line and the price touches/bounces off it or the line gets broken, only then the indicator will show the signal/alert.
- OFFSET: this one is really cool! With this feature you can hunt these conditions when the price comes very near the trend line, but never touches it. With this setting turned on, with a correct offset amount – you will be able to catch these! You will need to play around with the offset amount, depending on the timeframe/instrument, be quick-n-easy!
The indicator also includes Round Number lines on the chart, which are customizable for any instrument. As you know round numbers are appreciated by the price and can be very nicely used with this indicator looking for combos or using trend lines for signals, while round numbers as partial profit price targets or stop-loss areas.
Important economic events are also shown on the chart as red vertical lines (during these events, volatility can suddenly spike, so it’s best to stay away from trading!)
This is a very powerful indicator with plenty of customizations to find the best approaches, can be used for any instrument and on any timeframe! Awesome for scalping and could be used with swing trading as well! Enjoy!
To add the alerts
-Right-click anywhere on the TradingView chart
-Click on Add alert
-Condition: Auto Trend Lines Breakout with Confirmation Bounce Signals and Alerts
-Alert name: DO NOT TOUCH THIS
-Hit “Create”
-Note: If you change ANY Settings within the indicator – you must DELETE the current alert and create a new one per steps above, otherwise it will continue triggering alerts per old Settings!
A few strategies how this indicator can be used (these were actually tested and showed awesome results!):
1) Bounce Scalping: Simply hunting bounces off the trend lines. Often the price will slightly cross the trend line and then immediately bounces from it for nice little price move, which is great for scalping or if you for example take 2/3s off the position and leave the remaining, often with such bounces – the price may reverse from the trend line and go in the opposite direction considerably.
2) Break-Bounce-Confirm: this is the “Breaks with Confirmation Bounce” option of the script which fully automates the classical trend lines break confirmation, where the trend line is broken (which could be a fake out), so you wait for a touch/bounce of that trend line back from the initial break and open the position right there or wait and see if after the touch/bounce back, the price once again goes into the direction of the break.
For stop-loss and take-profit areas, you can use:
1) Pivots (these are marked with red and green crosses on the chart), which are used to draw the actual trend lines.
2) The actual trend lines themselves (if one gets broken + confirmation, you can set your stop-loss if that same line gets broken again in the opposite direction | similar for take-profit, you can take profit or partial profit at next trend line on the chart if the price reaches it.
3) Use the Round Numbers included, for example: use the closest round number as a visual soft stop-loss and the furthest one away as a visual soft take-profit.
You can try combining this indicator with divergence, stochastic, Bollinger bands, pretty much anything!
If you wish to try this out for a week or so – please reach out and I will give you access.

Immediate Trend - VHXIMMEDIATE TREND - VULNERABLE_HUMAN_X
This indicator is used to identify the immediate trend in the market.
When a Short Term High (STH) is engulfed and closed above, we consider that as a bullish trend.
And Similarly, when a Short Term Low (STL) is engulfed and closed below, we consider that as a bullish trend.
STH - A candle that is higher than the one candle towards it's left and one candle towards it's right.
STL - A candle that is lower than the one candle towards it's left and one candle towards it's right.
HOW TO USE:
1. Do not take trades purely based on the immediate trend showcased by the indicator. Rather, use them as confluence with your trading strategy.
2. When you are expecting price to reverse at your point of interest (Denamd/Supply zone), this indicator can help you predict the reversal by showcasing the current trend.
3. Using this indicator you can travel the trend as long as there is a change of trend predicted by this indicator.

Trend line & pivot level
This script can plot pivot levels and trend lines that are haven't broke out.
In the setting, left and right means how to get the pivot. the pivot will be gotten based on the left candles and the right candles. boxes will be auto deleted after the box was broke.
Important: This is just a beta version, if you find some bug with using this script. Don't hesitate to contact me.
What the future version will have? Might be pattern scanner, multi trend line, levels in different time frame, break out alert, or better key level algorithm. Depends on when I have free time.

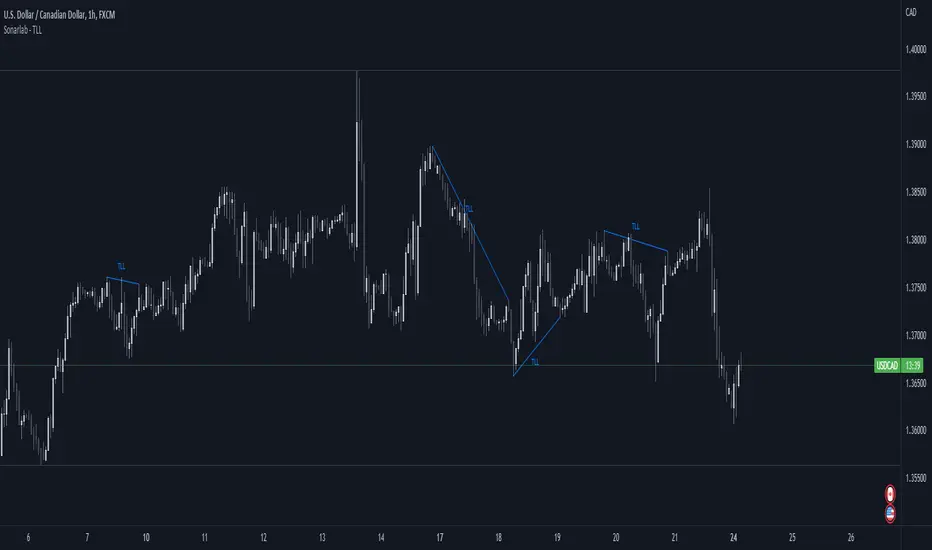
Sonarlab - Trendline Liquidity Indicator**This is not a normal Trend Line Indicator**
Most of the concepts we get thought online are to good to be true. Buy and sell off the touch of the trend line and you will be winning! You probably find out already that this ain't the way to trade. Trend lines mostly gets broken and you will be taken out.
he reason behind this is that the trend lines sparks the interests of Institutions. They use those area's to stop people out and use them as fuel for their positions: Liquidity.
TLL: Trend Line Liquidity
Lets show you an example on how to use these TLL markings 👇
In this example above we can see a beautiful example of the TLL indicator mapping out the TLL. The Imbalance Indicator shows us with the BPR (balanced price range) there is a sign of going short. The other confluence we can add is the TLL, which price likes to clear in these situations.
In this other example we also see two TLL resting on top. We see that price tried to break the SL (swing low), but the fake out detection showed us this was a grab on liquidity. After that we can see that on the LTF we get a displacement and we can assume that price is going to target the TLL.
Another example where price cleared the TLL and used is a targets.
This indicator will map the Trend Line Liquidity for you, so you are more aware of the liquidity that is resting around you. The Indicator has the following inputs:
Sensitivity A lower sensitivity create smaller trend lines, where a higher sensitivity creates bigger trend lines.
Display limit : The amount of lines you want the indicator to display
Line type/ text size (styling options)
ATR Trend Bands [Misu]█ This indicator shows an upper and lower band based on price action and ATR (Average True Range)
The average true range (ATR) is a market volatility indicator used in technical analysis.
█ Usages:
The purpose of this indicator is to identify changes in trends and price action.
It is mainly used to identify breaking points and trend reversals.
But it can also be used to show resistance or support levels.
█ Features:
> Buy & Sell Alerts
> Buy & Sell Labels
> Color Bars
> Show Bands
█ Parameters:
Length: Length is used to calculate ATR.
Atr Multiplier: A factor used to balance the impact of the ATR on the Trend Bands calculation.

Support Resistance Channels/Zones Multi Time FrameHello All,
For long time I have been getting a lot of requests for Support/Resistance Multi Time Frame script. Here ' Support Resistance Channels/Zones Multi Time Frame ' is in your service.
This script works if the Higher Time Frame you set is higher than the chart time frame. so the time frame in the options should be higher than the chart time frame.
The script checks total bars and highest/lowest in visible part of the chart and shows all S/R zones that fits according the highest/lowest in visible part. you can see screenshots below if it didn't make sense or if you didn't understand
Let see the options:
Higher Time Frame : the time frame that will be used to get Support/Resistance zones, should be higher than chart time frame
Pivot Period : is the number to find the Pivot Points on Higher time frame, these pivot points are used while calculating the S/R zones
Loopback Period : is the number of total bars on higher time frame which is used while finding pivot points
Maximum Channel Width % : is the percent for maximum width for each channel
Minimum Strength : each zone should contain at least a 1 or more pivot points, you set it here. (Open/High/Low/Close also are considered while calculating the strength)
Maximum Number of S/R : the number of maximum Support/Resistance zones. there can be less S/Rs than this number if it can not find enough S/Rs
Show S/R that fits the Chart : because of we use higher time frame, you should enable this option then the script shows only S/Rs that fits the current chart. if you disable this option, all S/R zones are shown and it may shrink the chart. also you may not see any S/R zone if you don't choose the higher time frame wisely ;)
Show S/R channels in a table : if you enable this option (by default it's enabled) then lower/upper bands of all S/R zones shown in a table ( even if it doesn't fit the chart ). you can change its location. zones are sorted according to their strengths. first one is the strongest.
and the other options is about colors and transparency.
Screenshots before and after zoom-out:
after zoom-out number of visible bars and highest/lowest change and it shows more S/R zones that fits the current chart!
if you see Support Resistance zone like below then you should decrease ' Maximum Channel Width ' or you should set higher time frame better:
You can change colors and transparency:
You can change Table location:
Alerts added :)
P.S. I haven't tested it so much, if you see any issue please drop a comment or send me message
Enjoy!

Auto Fibonacci Levels + Auto Trend Line generatorAnother indicator for you guys!!!
This indicator consists of the 5 key Fibonacci retracement levels, plotted automatically to user input settings. I also have included an auto support/resistance trend line generator.
What is a Fibonacci retracement?
'Fibonacci retracement is a method of technical analysis for determining support and resistance levels. It is named after the Fibonacci sequence of numbers, whose ratios provide price levels to which markets tend to retrace a portion of a move before a trend continues in the original direction.' - Wikipedia
How to use the Fibonacci retracement?
- The Fibonacci levels are default. These percentiles from price to the average of the high in a sample and low in a sample give you a guideline of where a bottom may be, where a top may be, and where a range is being created.
- Look for the price to reject from 61.8% and 76.4%, and also look for price to bounce from 38.2% and 23.6%. If a lower low/higher high is made, the fib levels will follow and the percentiles within will be recalculated after a 5 candle offset period.
- If you see price trending towards the lower percentiles (38&23) and using the 50% as resistance, look for a break downwards and vice versa.
-This Fibonacci set as all others is subject to fake-out, always use this with another series indicator, or don't use it as a signal for entry at all (unless you have a backdated strategy)
How to use the trend line generator?
-The trend line generator will only plot when a lower low/higher high has taken place within the input amount of candles. It is also offset by a user amount.
-The check box will give the option to have the trend line's plot or not.
- If you see a green/red dot it means that that will be your first coordinate for the trend line, and until the computations are complete it will give you an idea of which direction it will be in (resistance or support)
-When opening this indicator zoom out all the way to connect any trend lines that do not load automatically.
Let me know if you have any questions, suggestions or issues! Thank you everyone!
-Cheatcode1 :)
SP:SPX TVC:DXY BMFBOVESPA:EUR1! CME:BTC1! BINANCE:BTCUSDT
