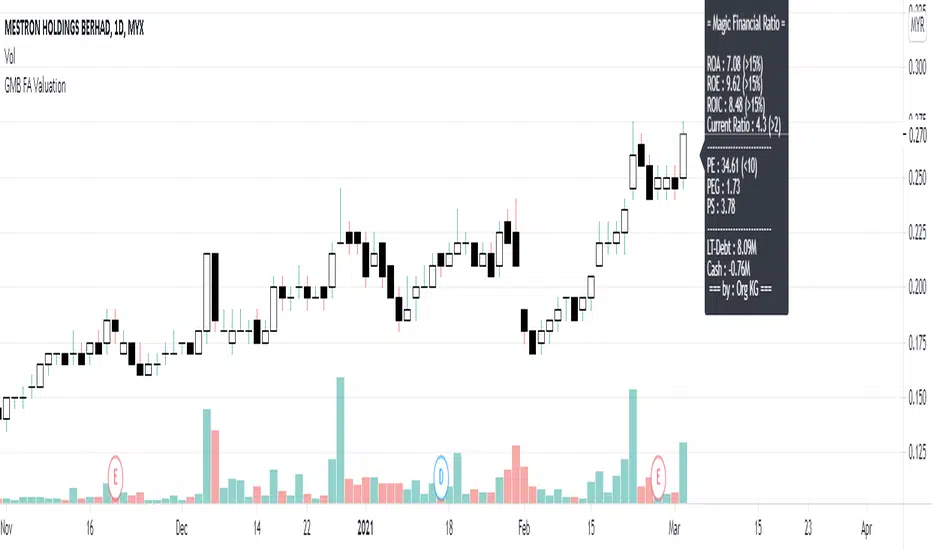
Financial MetricsGives a sneak peak into some of the important financial ratios described below:
1. P/E : price to earnings ratio (Green when P/E<15)
2. PEG: Price to earnings growth ratio (Green when PEG<1)
3. P/S: Price to sales ratio (Green when P/S<2)
4. EV/FCF: Enterprise Value to Free Cashflow ratio
5. OPM: Operating Profit Margin % (Green when OPM>15%)
6. D/E: Debt to equity ratio (Green when D/E<1)
7. ROE: Return on equity % (Green when ROE>15%)
8. Div_Yield: Dividend yield
Disclaimer: All the limits defined are based on the widely accepted general values, but are subjective to particular sector or group of stocks. For example IT stocks command higher valuation than cyclical stocks like metal. So Compare with other stocks of the same sector to reach any conclusion.
Valuation

Benjamin Graham Net-Net AnalyserA simple indicator that displayers as a table, telling you whether or not the stock you have selected has a current price that is less than 67% of the company's net current asset value per share (NCAVPS) at its last reporting period (FQ, FY, TTM).
Benjamin Graham uses this 67% rule to decide whether or not a stock is significantly undervalued, and studies have shown that investing in companies whose share prices are less than 67% of their NCAVPS can be highly profitable, and will beat markets in the long run.
Feel free to use as you please or repurpose the code for your own projects.

EsIstTurnt's Relative Value Comparison Multi SymbolCompare the relative valuation of up to 8 tickers. By taking a shorter term moving average and dividing by a longer term moving average(optionally with an offset) we get a value that is either above or below 1. Easy to tell what is undervalued and overvalued with this setup. Useful for comparing different asset classes or sector specific securities looking for outperformers/underperformers. Overvalued and Undervalued levels marked by Red and Green background. Recommended in conjunction with other indicators of your choosing for confirmation of trend changes but this is good for getting a broader view of the market you're interested in. Multiple timeframes, sources available however you should tinker with it to find what gives you the best view for your preferred timeframe.

OGT Intrinsic Value IndicatorOGT Intrinsic Value Indicator
This indicator will show you visually the intrinsic value of a stock. Intrinsic value aims to measure of what an asset is worth. There are a number of intrinsic valuation models where this TradingView indicator uses an earnings valuation model.
There are 4 inputs to the model:
1) EPS trailing 12 months (ttm) - the first step is to know what the current EPS is for a stock. The indicator calculates this for you
2) Annual EPS Growth Next 5 Years - You need to input what you think the annual growth rate is going to be for the stock. You can use you annual estimates which you can obtain by searching "stock name - eps growth forecast"
3) Earnings Multiple (PE Ratio) - The next step is to input the earnings multiple in year 5. You can get this from analyst estimates or looking at the average PE ratio of the asset over the past 3 / 5 / 10 years.
4) Desired Rate Of Return - The last input is your rate of return. I personally use 12.5% as you can invest in an S&P ETF and get 8-10% return. So I prefer a higher rate of return for the risk I am taking.
You will need to input your low, medium and high assumptions so you can see the different price ranges.

Valuation TableHey folks, I hope you are all doing well!
This is an indicator that you can use to help you to evaluate companies. There are a few things I added to the valuation table that I personally use and I will explain what they are.
I added Joel Greenblatt's ROC% because it takes Earnings before Interest and Taxes to reflect more closely what the company earns from its operations, while including the cost of depreciation/amortization of assets. A high double digit figure often means that the company has a defensible edge versus its competitors (e.g. a strong brand or a unique product). It's good for relative valuation (comparing two companies in the same industry).
I also added Donald Yacktman's forward rate of return. Yacktman defines forward rate of return as the normalized free cash flow yield plus real growth plus inflation . Unlike the Earnings Yield %, the Forward Rate of Return uses the normalized Free Cash Flow of the past seven years, and considers growth. The forward rate of return can be thought of as the return that investors buying the stock today can expect from it in the future. Yacktman’s Forward Rate of Return may or may not be a useful metric. However, it does present new ways to see and think about stocks we may want to buy.
I added a box called "real price" and that is from Peter Lynch's book, "One Up on Wall Street," where he talked about how the real price of the stock is really the current price - Net Cash Per Share.
I would also personally pair this script with TradingView's built in financial indicators that shows the revenue growth, net income, etc.
Note: the script only works on the weekly timeframe and it will take some time to load because it has a lot of data.

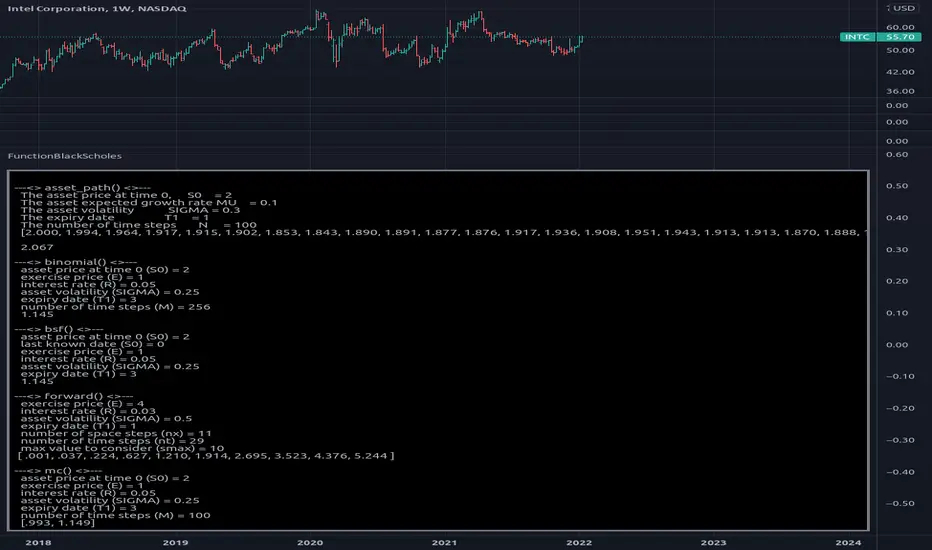
FunctionBlackScholesLibrary "FunctionBlackScholes"
Some methods for the Black Scholes Options Model, which demonstrates several approaches to the valuation of a European call.
// reference:
// people.math.sc.edu
// people.math.sc.edu
asset_path(s0, mu, sigma, t1, n) Simulates the behavior of an asset price over time.
Parameters:
s0 : float, asset price at time 0.
mu : float, growth rate.
sigma : float, volatility.
t1 : float, time to expiry date.
n : int, time steps to expiry date.
Returns: option values at each equal timed step (0 -> t1)
binomial(s0, e, r, sigma, t1, m) Uses the binomial method for a European call.
Parameters:
s0 : float, asset price at time 0.
e : float, exercise price.
r : float, interest rate.
sigma : float, volatility.
t1 : float, time to expiry date.
m : int, time steps to expiry date.
Returns: option value at time 0.
bsf(s0, t0, e, r, sigma, t1) Evaluates the Black-Scholes formula for a European call.
Parameters:
s0 : float, asset price at time 0.
t0 : float, time at which the price is known.
e : float, exercise price.
r : float, interest rate.
sigma : float, volatility.
t1 : float, time to expiry date.
Returns: option value at time 0.
forward(e, r, sigma, t1, nx, nt, smax) Forward difference method to value a European call option.
Parameters:
e : float, exercise price.
r : float, interest rate.
sigma : float, volatility.
t1 : float, time to expiry date.
nx : int, number of space steps in interval (0, L).
nt : int, number of time steps.
smax : float, maximum value of S to consider.
Returns: option values for the european call, float array of size ((nx-1) * (nt+1)).
mc(s0, e, r, sigma, t1, m) Uses Monte Carlo valuation on a European call.
Parameters:
s0 : float, asset price at time 0.
e : float, exercise price.
r : float, interest rate.
sigma : float, volatility.
t1 : float, time to expiry date.
m : int, time steps to expiry date.
Returns: confidence interval for the estimated range of valuation.
Valuation Scenarios by Filipe RamosEnglish:
An indicator that allows you to project a scenario of fair value of a stock considering expected revenue growth and net margin in a DCF model. Rather than forecast what should be the price of a stock, this indicator calculates possible scenarios accordingly to expected growth and value added the user inputs. It has 3 parameters:
-Years: the timeframe of projected present value;
-Revenue yearly growth percentage: minimum value is 1.1 (represents 10% annual growth but with the discount rate of 10% means no growth at all);
-Margin: the net margin.
It projects a linear growth and an exponential growth.

ROE ValuationAn indicator that can be used to study ROE Valuation for stocks.
Red color means the market price is higher than the valuation whereas green color means the market price is below the valuation and it might be a good opportunity for value traders. Gray color indicates non-applicable results, when valuation is below zero for example.

PE ValuationAn indicator that can be used to study PE Valuation for stocks.
When the reported EPS for a company is non-positive the line turns gray. Red color means the market price is higher than the valuation whereas green color means the market price is below the valuation and it might be a good opportunity for value traders.

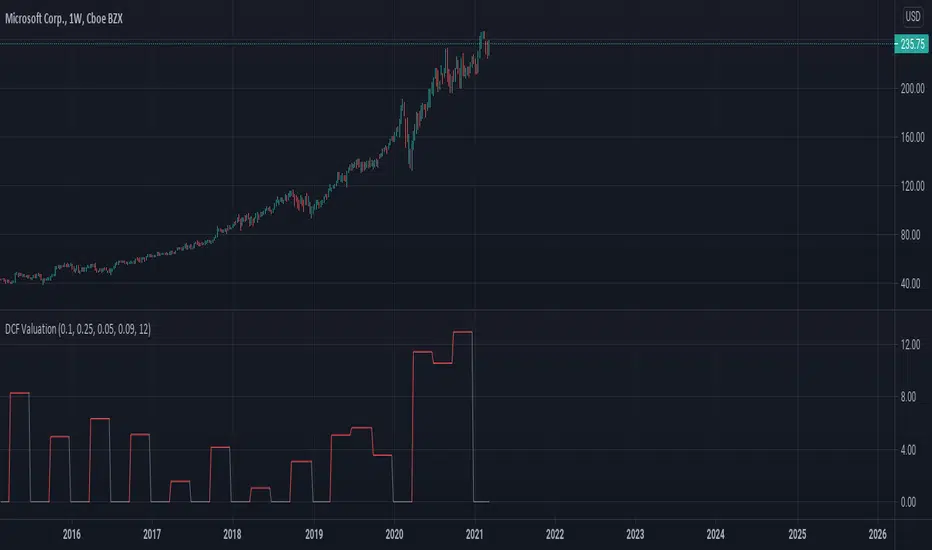
DCF ValuationAn indicator that can be used to study Discounted Cash Flow Valuation for stocks.
When the reported Free Cash Flow for a company is non-positive the line turns gray. Red color means the market price is higher than the valuation whereas green color means the market price is below the valuation and it might be a good opportunity for value traders.
FA Valuation DashboardSimple Financial Ratio for investor.
User can insert CAGR value for PEG ratio.
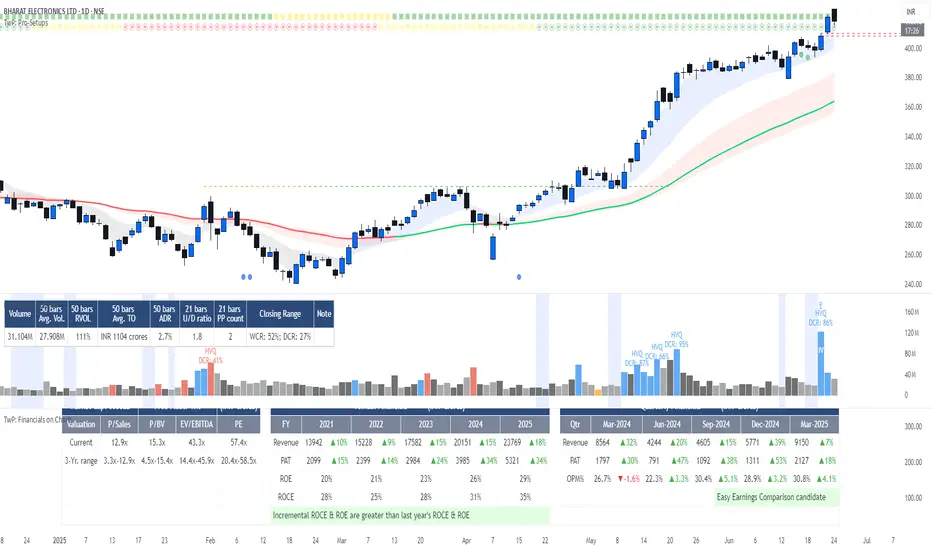
TwP: Financials on ChartsWith this indicator, you can see the following on a chart:
> An Info Panel , with the financial snapshot of the company, such as its market capitalization, annual & quarterly financials, Y/Y growth numbers, profitability margins, RoE & RoCE, and valuation ratios.
> EBITDA and PAT margins over a period of time.
> RoE and RoCE ratios over a period of time.
> Valuation multiples over a period of time.
> A comparison of margins, return ratios, and valuation multiples with any peer-group company .
Info Panel
This gives a quick snapshot of the financials of the company, which includes annual & quarterly Revenue, EBITDA, PAT, margins with Y/Y changes, Debt-Equity ratio, ROE, ROCE, and valuation multiples.
Profitability & Return Ratios
You can view quarterly as well as annual EBITDA & PAT margins and annual RoE, RoCE. You can choose to see these ratios either only for the company or can also add a peer company to compare.
Valuation Ratios
You can view TTM valuation ratios such as EV/Sales, EV/EBITDA, P/BV & P/E multiples. You can choose to see these valuation multiples either only for the company or can also add a peer company to compare.
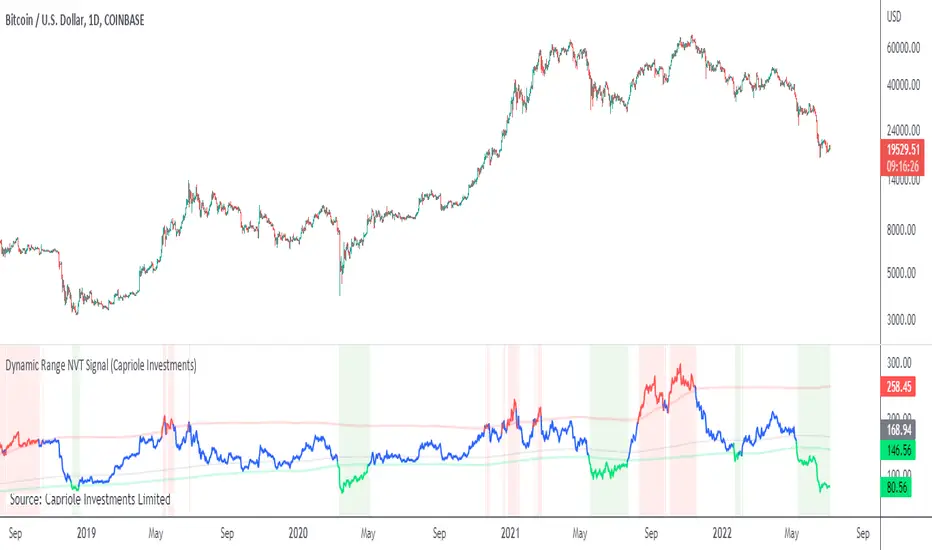
Dynamic Range NVT SignalABOUT DYNAMIC RANGE NVT SIGNAL
NVT Signal (Credit: Willy Woo and Dmitry Kalichkin) is akin to a "PE" ratio for Bitcoin , and can be used to identify when Bitcoin is overbought or oversold based on the relative value of transactions sent across the network.
This indicator includes a 2 year moving average and standard deviation to identify outlier values, instead of declaring a static high-low range for relative valuation.
THEORY
A dynamic "high-low" range was chosen for the following reasons:
- Bitcoin is only 10 years old, it is likely that relatively "high" and relatively "low" NVT values will change with time, as have PE ratios over the last century.
- Some transactions are now made off-chain (eg. Liquid Network's private side-chain which is used by many major exchanges). If this trend continues, we can expect "normal" NVT ranges to increase with time (as the relative portion of public on-chain transaction values decreases).
CALCULATION
- NVT = Circulating Market Cap / 90 average On-chain Transaction Value*
- Overbought (default): NVT > 2-year mean + 2*standard deviations. I.e. NVT Signal is in the top 2.5% of values for the prior 2 years.
- Oversold (default) NVT < 2-year mean - 0.5 * standard deviations.**
*Data source: Blockchain.info, estimated transaction value does not include returned to sender as change.
**Oversold under 2-year mean was chosen due to the skewness of NVT Signal, it is not normally distributed. For example: NVT Signal has never been less than the 2-year mean - 2* standard deviations. This may change in the future.
NOTES ON USAGE
- Use with care. Bitcoin can remain "overbought" or "oversold" for extended periods (eg. 2015-2016).
- As Bitcoin ages, the validity of NVT Signal will need to be monitored. Particularly with respect to potentially increasing use of side-chains, private transactions and potentially the lightning network.
- It is likely that a 2-year “look back period” for calculating mean and standard deviation will not be sufficient in the decades to come. As Bitcoin matures and stabilizes (some time in the future), a longer "look back period" should probably be used. To allow for this, the defaults for this indicator can be easily adjusted.
🔗Blockchain Fundamentals - Average Cap & Top Cap -Cryptorhythms🔗Blockchain Fundamentals - Average Cap & Top Cap (Marketcap Alternatives)
Intro
Last one for a couple days but then I will be back! Here are the marketcap alternatives Average Cap (created by Renato Shirakashi) and Top Cap (created by Willy Woo).
Descriptions
Average Cap
This is the "forever" moving average of Market Cap. The cumulative sum of daily Market Cap values divided by the age of the market in days.
Top Cap
Willy Woo: "I found historically 35x Average Cap picks the market top. This 'Top Cap' together with Delta Cap creates a 'Valuation Bollinger Band'. Top Cap helps us estimate the next top, I would guess at $90k as a minimum (on the early trajectory). Top Cap is very experimental."
👍 Enjoying this indicator or find it useful? Please give me a like and follow! I post crypto analysis, price action strategies and free indicators regularly.
💬 Questions? Comments? Want to get access to an entire suite of proven trading indicators? Come visit us on telegram and chat, or just soak up some knowledge. We make timely posts about the market, news, and strategy everyday. Our community isn't open only to subscribers - everyone is welcome to join.
For Trialers & Chat: t.me

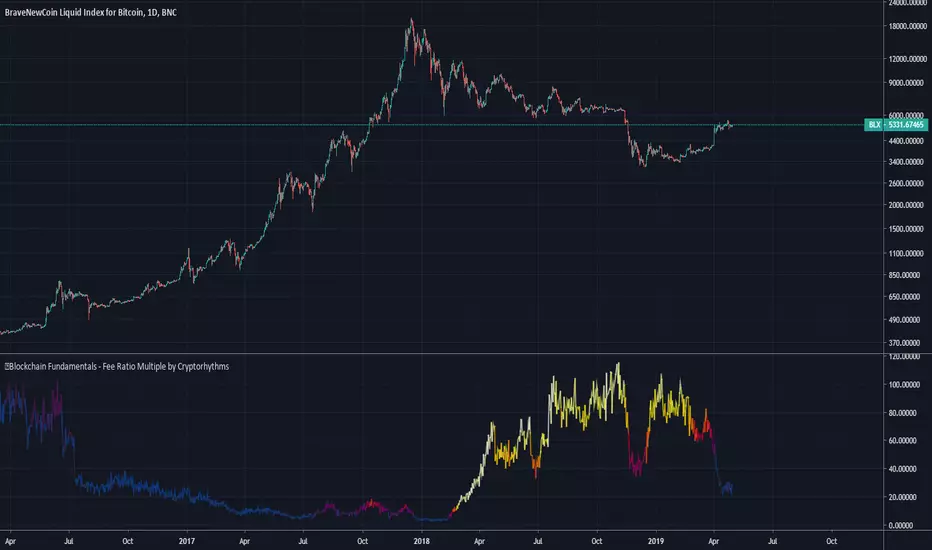
🔗Blockchain Fundamentals - Fee Ratio Multiple by Cryptorhythms🔗Blockchain Fundamentals - Fee Ratio Multiple by Cryptorhythms
Intro
Back with the next indicator in the Blockchain Fundamentals Series! Hope everyone is enjoying using these as much as I enjoyed porting them to tradingview. This one is not a buy / sell signal, but useful none the less. Created by Matteo Leibowitz.
Description
Fee Ratio Multiple (FRM), which seeks to measure the transaction fee revenue growth required for dis-inflationary Proof of Work chains to maintain existing security levels once block rewards are fully phased out. A high FRM suggests that a network will have to maintain inflationary block rewards in order to sustain security, whilst a low FRM suggests that a network can maintain existing security levels while simultaneously achieving low inflation. The latter outcome is arguably more desirable for a long term Store of Value and protection against inflationary government-controlled currencies.
FRM is explicitly about security, which should be considered the foundational layer of the chain stack. By looking at FRM we can deduce how secure chains will be once block rewards disappear. Further, FRM implicitly measures the strength of an assets properties as a Store of Value.
A low FRM suggests that an asset can maintain its current security budget (miner revenue) without having to rely on an inflationary subsidy.
Conversely, a high FRM suggests that an asset will require heavy inflation via block reward subsidies in order to maintain its existing security budget.
I suggest everyone read the article here for further clarification on what this indicator means and how to use it: medium.com
👍 Enjoying this indicator or find it useful? Please give me a like and follow! I post crypto analysis, price action strategies and free indicators regularly.
💬 Questions? Comments? Want to get access to an entire suite of proven trading indicators? Come visit us on telegram and chat, or just soak up some knowledge. We make timely posts about the market, news, and strategy everyday. Our community isn't open only to subscribers - everyone is welcome to join.
For Trialers & Chat: t.me
🔗Blockchain Fundamentals - BTC Network Momentum - Cryptorhythms🔗Blockchain Fundamentals - Bitcoin Network Momentum by Cryptorhythms
Description
Network Momentum is a view created by PositiveCrypto which looks into the value transmitted through the Bitcoin blockchain denominated in BTC value plotted against Bitcoin`s price. It serves as a leading indicator of Bitcoin bull markets. Sufficiently high levels of value throughput is needed drive bull markets.
Network Momentum, if it was corrected for Bitcoin`s expanding token supply, would essentially be Bitcoin Velocity. In other words an inverse chart of NVT Ratio.
Bitcoin Network Momentum is another piece of the puzzle to help our understanding of Bitcoin fundamentals and their impact on price. Bitcoin Network Momentum looks at the relationship between Bitcoin’s price and the BTC value of daily transactions flowing through the blockchain.
It is important to note here that we are using the BTC daily value flowing through the blockchain, not the USD daily value which NVT Signal uses.
What we see when we look at this is that the BTC value of daily transactions acts as a leading indicator of Bitcoin’s major market phases.
Extras
We give you the option of changing the median price lookback length
👍 Enjoying this indicator or find it useful? Please give me a like and follow! I post crypto analysis, price action strategies and free indicators regularly.
💬 Questions? Comments? Want to get access to an entire suite of proven trading indicators? Come visit us on telegram and chat, or just soak up some knowledge. We make timely posts about the market, news, and strategy everyday. Our community isn't open only to subscribers - everyone is welcome to join.
For Trialers & Chat: t.me

🔗 Blockchain Fundamentals - Thermocap by Cryptorhythms🔗 Blockchain Fundamentals - Thermocap (Marketcap Alternative) by Cryptorhythms
Description
Market capitalization is an indicator for assessing the value of equity in companies. Crypto has inherited the metric from stocks and is having a hard time trying to get rid of it. Problems here are:
Market Cap takes into account all coins distributed so far, not distinguishing lost coins within the circulating supply (or coins intended to be hodled for long periods).
The point is: if a cryptocurrency has a market cap of $1 billion, it doesn’t mean that $1 billion has flown into that asset. One can create a billion coins; sell 2 of them for $2; and thus pump into CoinMarketCap an excess of $999.999.998 in relation to the actual amount that asset has been traded for.
A more appropriate measure of network value was recently put forth by Nic Carter. Remember capital flows in crypto generally do not come in via exchanges (miners notably like to sell OTC). Every buy in an exchange is matched by a sell. Money that comes in = money that goes out.
True inflows (in Bitcoin, at least) are the aggregate of resources spent by miners. And a good proxy for that is the amount these folks are earning back from networks they support in return for their investments. That’s aggregate security spend (or Thermocap): what was actually paid out to miners (coinbase transactions * their price in USD at the time they were mined).
What does it portray?
A more effective measure of wealth in illiquid markets. How much the network has been worth to its maintainers, in cash flows.

UCSgears_Transaction Valuation IndexHere is the Version 2 of the TVI indicator posted earlier.
This is inspired from the Value Charts Indicator.
Version 1

UCSgears_Transaction Valuation IndexThis is an indicator, That works great in a wip-saw market range. Would not use this to trade in a breakout.
I am calling it the "Transaction Value Index (UCS_TVI)", The reason is because, it measure where the price currently from the mean trade value.
The cross represents the highest trade value on that day, circle represents the lowest trade value.
In other words, Top and bottom of the candle wicks, in relation to the mean trade value (MTV).
Watchout for Further Updates on Optimizing this indicator.
DO NOT CONFUSE IT WITH FUNDAMENTAL VALUATION, THIS IS PURELY TECHNICAL VALUATION TECHNIQUE
As Usual, Good Luck
List of All my Indicators - www.tradingview.com
