Universal Strategy | QuantEdgeBIntroducing the Universal Strategy by QuantEdgeB
The Universal Strategy | QuantEdgeB is a dynamic, multi-indicator strategy designed to operate across various asset classes with precision and adaptability. This cutting-edge system utilizes four sophisticated methodologies, each integrating advanced trend-following, volatility filtering, and normalization techniques to provide robust signals. Its modular architecture and customizable features ensure suitability for diverse market conditions, empowering traders with data-driven decision-making tools. Its adaptability to different price behaviors and volatility levels makes it a robust and versatile tool, equipping traders with data-driven confidence in their market decisions.
_______
1. Core Methodologies and Features
1️⃣ DEMA ATR
Strength : Fast responsiveness to trend shifts.
The double exponential moving average is inherently aggressive, designed to reduce lag and quickly identify early signs of trend reversals or breakout opportunities. ATR bands add a volatility-sensitive layer, dynamically adjusting the breakout thresholds to match current market conditions, ensuring it remains responsive while filtering out noise
How It Fits :
This indicator is the first responder, providing early signals of potential trend shifts. While its aggressiveness can result in quick entries, it may occasionally overreact in noisy markets. This is where the smoother indicators step in to confirm signals.
2️⃣ Gaussian - VIDYA ATR (Variable Index Dynamic Average)
Strength : Smooth, adaptive trend identification.
Unlike DEMA, VIDYA adapts to market volatility through its standard deviation-based formula, making it smoother and less reactive to short-term fluctuations. ATR filtering ensures the indicator remains effective in volatile markets by dynamically adjusting its sensitivity.
How It Fits :
The smoother complement to DEMA ATR, VIDYA ATR filters out false signals from minor price movements. It provides confirmation for the trends identified by DEMA ATR, ensuring entries are based on robust, sustained price movements.
3️⃣ VIDYA Loop Trend Scoring
Strength : Historical trend scoring for consistent momentum detection.
This module evaluates the relative strength of trends by comparing the current VIDYA value to its historical values over a defined range. The loop mechanism provides a trend confidence score, quantifying the momentum behind price movements.
How It Fits :
VIDYA For-Loop adds a quantitative measure of trend strength, ensuring that trades are backed by sustained momentum. It balances the early signals from DEMA ATR and the smoothness of VIDYA ATR by providing a statistical check on the underlying trend.
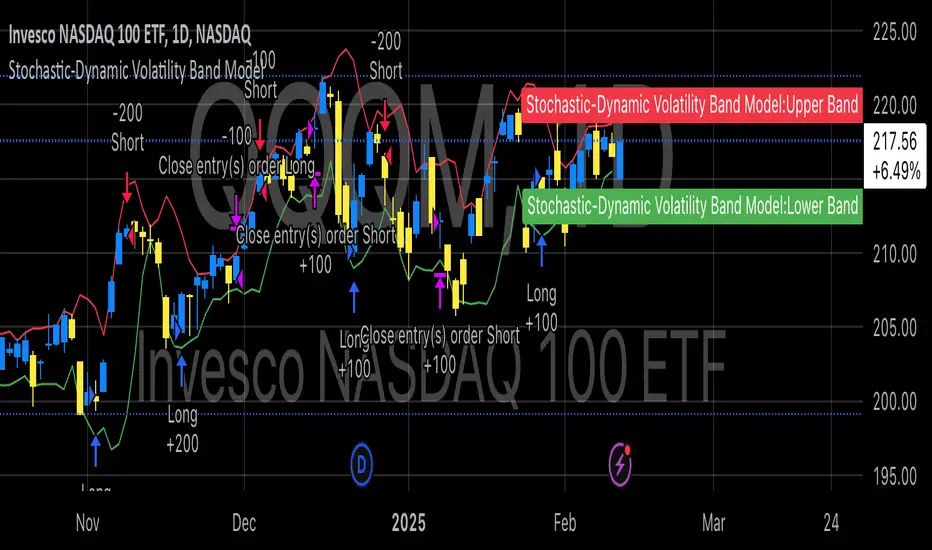
4️⃣ Median SD with Normalization
Strength : Precision in breakout detection and market normalization.
The Median price serves as a robust baseline for detecting breakouts and reversals.
SD bands expand dynamically during periods of high volatility, making the indicator particularly effective for spotting strong trends or breakout opportunities. Normalization ensures the indicator adapts seamlessly across different assets and timeframes, providing consistent performance.
How It Fits :
The Median SD module provides final confirmation by focusing on price breakouts and market normalization. While the other indicators focus on momentum and trend strength, Median SD emphasizes precision, ensuring entries align with significant price movements rather than random fluctuations.
_______
2. How The Single Components Work Together
1️⃣ Balance of Speed and Smoothness :
The strategy blends quick responsiveness (DEMA ATR) with smooth and adaptive confirmation (VIDYA ATR & For-Loop), ensuring timely reactions without overreacting to market fluctuations. Median SD with Normalization refines breakout detection and stabilizes performance across assets using statistical anchors like price median and standard deviation.
Adaptability to Market Dynamics:
2️⃣ Adaptability to Market Dynamics :
The indicators complement each other seamlessly in trending markets, with the DEMA ATR and Median SD with Normalization quickly identifying shifts and confirming sustained momentum. In volatile or choppy markets, normalization and SD bands work together to filter out noise and reduce false signals, ensuring precise entries and exits. Meanwhile, the For-Loop scoring and Gaussian-Filtered VIDYA ATR focus on providing smoother, more reliable trend detection, offering consistent performance regardless of market conditions.
_______
3. Scoring and Signal Confirmation
The Universal Strategy consolidates signals from all four methodologies, calculating a Trend Probability Index (TPI). The four core indicators operate independently but contribute to a unified TPI, enabling highly adaptive behavior across asset classes.
- Each methodology generates a trend score: 1 for bullish trends, -1 for bearish trends.
- The TPI averages the scores, creating a unified signal.
- Long Position: Triggered when the TPI exceeds the long threshold (default: 0).
- Short Position: Triggered when the TPI falls below the short threshold (default: 0).
The strategy’s customizable settings allow traders to tailor its behavior to different market conditions—whether smoother trends in low-volatility assets or quick reaction to high-volatility breakouts. The long and short thresholds can be fine-tuned to match a trader’s risk tolerance and preferences.
_______
4. Use Cases:
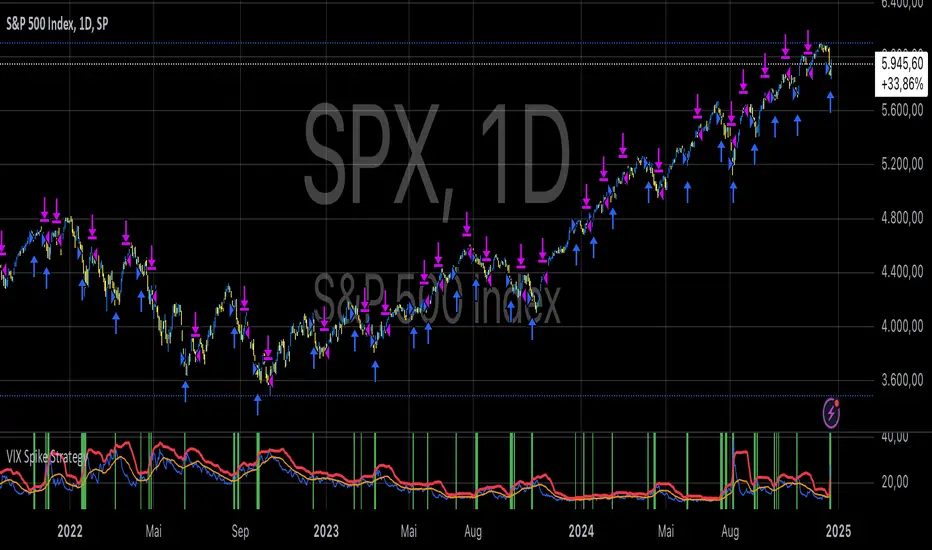
The Universal Strategy | QuantEdgeB is designed to excel across a wide range of trading scenarios, thanks to its modular architecture and adaptability. Whether you're navigating trending, volatile, or range-bound markets, this strategy offers robust tools to enhance your decision-making. Below are the key use cases for its application:
1️⃣ Trend Trading
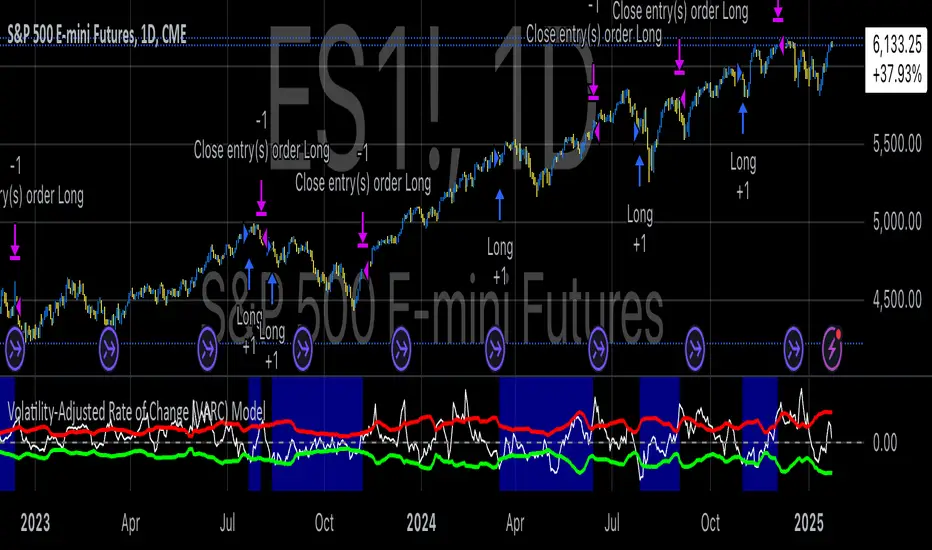
The strategy’s Gaussian-Filtered DEMA ATR and VIDYA ATR modules are perfect for identifying and riding sustained trends.
Ideal For: Traders looking to capture long-term momentum or position trades.
2️⃣ Breakout and Volatility-Based Strategies
With its Median SD with Normalization, the strategy excels in detecting volatility breakouts and significant price movements.
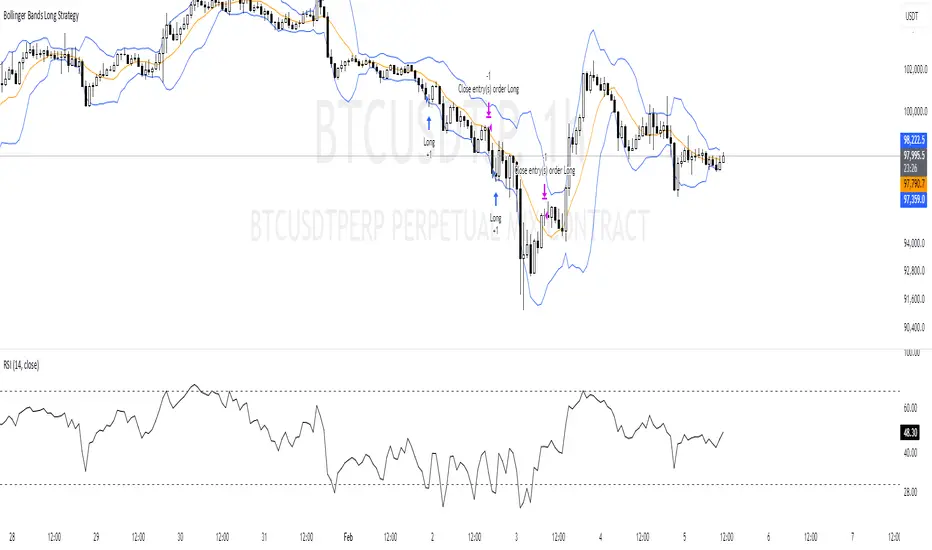
Ideal For: Traders aiming to capitalize on sudden market movements, especially in assets like cryptocurrencies and commodities.
3️⃣ Momentum and Strength Assessment
By generating a trend confidence score, the VIDYA For-Loop quantifies momentum strength—helping traders distinguish temporary spikes from sustainable trends.
Ideal For: Swing traders and those focusing on momentum-driven setups.
4️⃣ Adaptability Across Multiple Assets
The strategy’s robust framework ensures it performs consistently across different assets and timeframes.
Ideal For: Traders managing diverse portfolios or shifting between asset classes.
5️⃣ Backtesting and Optimization
Built-in backtesting and equity visualization tools make this strategy ideal for testing and refining parameters in real-world conditions.
• How It Helps: The strategy equity curve and metrics table offer a clear picture of performance, helping traders identify optimal settings for their chosen market and timeframe.
• Ideal For: Traders focused on rigorous testing and long-term optimization.
_______
5. Signal Composition Table:
This table presents a real-time breakdown of each indicator’s trend score (+1 bullish, -1 bearish) alongside the final aggregated signal. By visualizing the contribution of each methodology, traders gain greater transparency, confidence, and clarity in identifying long or short opportunities.
6. Customized Settings:
1️⃣ General Inputs
• Strategy Long Threshold (Lu): 0
• Strategy Short Threshold (Su): 0
2️⃣ Gaussian Filter
• Gaussian Length (len_FG): 4
• Gaussian Source (src_FG): close
• Gaussian Sigma (sigma_FG): 2.0
3️⃣ DEMA ATR
• DEMA Length (len_D): 30
• DEMA Source (src_D): close
• ATR Length (atr_D): 14
• ATR Multiplier (mult_D): 1.0
4️⃣ VIDYA ATR
• VIDYA Length (len_V1): 9
• SD Length (len_VHist1): 30
• ATR Length (atr_V): 14
• ATR Multiplier (mult_V): 1.7
5️⃣ VIDYA For-Loop
• VIDYA Length (len_V2): 2
• SD Length (len_VHist2): 5
• VIDYA Source (src_V2): close
• Start Loop (strat_loop): 1
• End Loop (end_loop): 60
• Long Threshold (long_t): 40
• Short Threshold (short_t): 8
6️⃣ Median SD
• Median Length (len_m): 24
• Normalized Median Length (len_msd): 50
• SD Length (SD_len): 32
• Long SD Weight (w1): 0.98
• Short SD Weight (w2): 1.02
• Long Normalized Smooth (smooth_long): 1
• Short Normalized Smooth (smooth_short): 1
Conclusion
The Universal Strategy | QuantEdgeB is a meticulously crafted, multi-dimensional trading system designed to thrive across diverse market conditions and asset classes. By combining Gaussian-Filtered DEMA ATR, VIDYA ATR, VIDYA For-Loop, and Median SD with Normalization, this strategy provides a seamless balance between speed, smoothness, and adaptability. Each component complements the others, ensuring traders benefit from early responsiveness, trend confirmation, momentum scoring, and breakout precision.
Its modular structure ensures versatility across trending, volatile, and consolidating markets. Whether applied to equities, forex, commodities, or crypto, it delivers data-driven precision while minimizing reliance on randomness, reinforcing confidence in decision-making.
With built-in backtesting tools, traders can rigorously evaluate performance under real-world conditions, while customization options allow fine-tuning for specific market dynamics and individual trading styles.
Why It Stands Out
The Universal Strategy | QuantEdgeB isn’t just a trading algorithm—it’s a comprehensive framework that empowers traders to make confident, informed decisions in the face of ever-changing market conditions. Its emphasis on precision, reliability, and transparency makes it a powerful tool for both professional and retail traders seeking consistent performance and enhanced risk management.
_______
🔹 Disclaimer: Past performance is not indicative of future results. No trading strategy can guarantee success in financial markets.
🔹 Strategic Advice: Always backtest, optimize, and align parameters with your trading objectives and risk tolerance before live trading.
Pine Script®策略