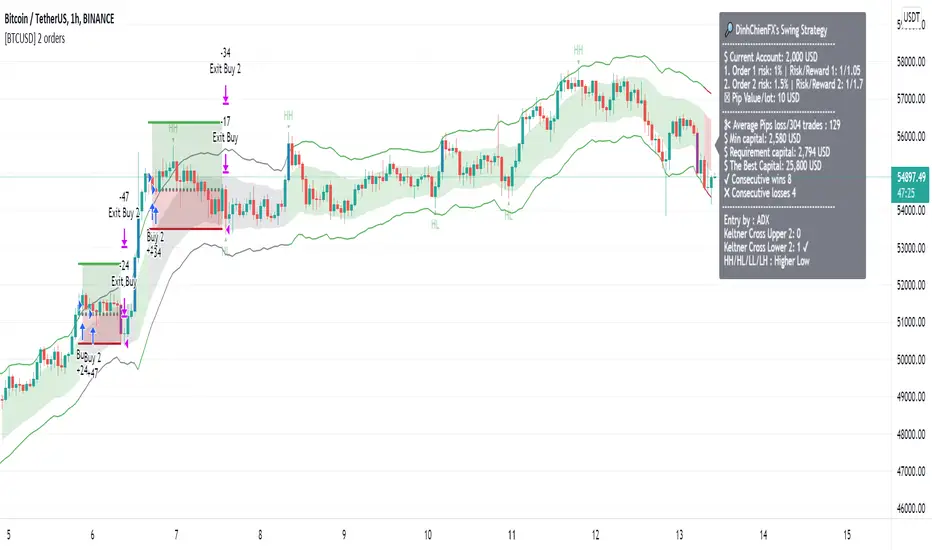
4. AutoBots Trading - BACKTEST: Bollinger BandsBACKTEST: Bollinger Bands
1. Description: a technical analysis tool defined by a set of trendlines plotted two standard deviations (positively and negatively) away from a simple moving average ( SMA ) of a security's price, but which can be adjusted to user preferences.
2. Strategy rules: defined based on the component, signal count, entry prices, open order count, position check, position averages, conditional closes and close signals.
3. Risk management: system was defined based on the choice of only long, only short or both sides. Defining the choice of take profit, stop loss and trailing stos (no repaint).
4. Symbol: EURUSD (only)
5. Suggested Timeframe: 1H
6. Parameter for optimization: 13, 1.5, side: both, tp: 0.4%, sl: 0.2%, ts: na
7. Walk forward simulation
7.1. In sample period: jan/2018-jan/2020
7.2. Out of sample period: jan/2020 - ago/2020
** For purpose educate only
波動率
vertex reversal indicator (lirshah)vertex reversal strategy has been written based on vertex reversal indicator, this new indicator is a combination of three different indicator: Momentum, Moving Averages and Bollinger Bands.
this strategy has been written based on current bar calculation so no repainting occurs.
in order to access script contact me directly.
[astropark] VWAP Crosses [strategy]Dear Followers,
today a new Swing and Scalping Strategy based on WVAP , mainly designed for Bitcoin and High-Cap Cryptocurrencies, like Ethereum. It works also on Forex and Stocks.
It works great since 15m and above till 1D. I suggest you to use it on 15m, 30m or 1h timeframes .
VWAP or "Volume Weighted Average Price" is a volume-based indicator similar to a moving average.
This trading indicator is used to identify market resistance and support levels and is represented as a weighted average price for the treaded volumes.
My strategy will help you identify main support-resistance level to be careful of and it will trigger a buy or a sell depending on how price will intereact with vwaps.
green means we are in a bullish trend, in fact it start with a "buy" signal
red means we are in a bearish trend, in fact it start with a "sell" signal
blue means we are in a moment where trend may change, so be careful and always remember that taking profits is awesome and have a stoploss is a must in trading
The user who wants to use this strategy, especially via an automated bot, must always set a stoploss (example 150$ from entry on bitcoin) or use a proper risk management strategy .
This is not the "Holy Grail", so use it with caution. It's highly suggested to use a proper money management .
This script will let you backtest this script and check profitability on your preferred market.
The alarms version of this indicator, which will let you set all notifications you may need in order to be alerted on each triggered signals, can be found by searching for astropark "VWAP Crosses"
This is a premium indicator , so send me a private message in order to get access to this script.
WOMBO COMBO: EMA & VWAP & MACD & BB & STCHello my fellow investors,
After hours of reading, backtesting, and YouTube video watching I discovered that EMA, VWAP, BB, MACD, and STC produce the most consistent results for investment planning. This strategy allows you to pick between the aforementioned indicators or layer them together.
It works on the pricipal of:
1) Always follow the market trend - buy/sell above/below 200EMA
2) Follow corporate investing trends - buy/sell above/below VWAP
3) Apply MACD check - buy--> MACD line above signal line and corssover below histogram \\ sell --> MACD line below signal line and crossover above histogram.
4) Check volitility with price against BB limits upper/Sell or lower/buy
5) When STC crosses about 10 buy and when it drops below 90 sell
6) Exit position when stop loss is triggered or profit target is hit. BB also provides a parameter to exit positions.
This code is the product of many hours of hard work on the part of the greater tradingview community. The credit goes to everyone in the community who has put code out there for the greater good.
Swing trading StrategyThis indicator based on capturing historical swing. It predicts future swing based on historical swing data. This is very useful for short term swing trading and gives best result on 30 minute chart.
Volume Based Buy/SellThis is my very first scrip on this platform. It's the first version of the script, It works on the volume-based moving averages and exponential moving average.
I have added the buy/sell signals for educational purposes only. While adding the buy/sell signal I have an additional check on the strength of the trend to reduce loss to a minimum.
How to use:
1. Use with Heikin Ashi Chart.
2. Use 15 Min timeframe for intraday.
Some improvements I am working in the near future is:
1. Exit tread with the maximum profit.
2. Reduce down false trad to 0%.
To encourage and support please like the script try using for your own paper trading.
Dont forget to leave a comment on if you see any improvement in the script or any idea you have. Happy treading together.
Highest High and Lowest Low Channel StrategyHighest / Highest High Highest (Data) - HHV (Data, Period)
Lowest / Lowest Low Lowest (Data) LLV (Data, Period)
These functions calculate the highest / lowest value of a selected data.
Highest High and Lowest Low options are mostly used.
The Highest function calculates the highest value of the selected data in the past.
The Lowest function calculates the lowest value of the selected data in the past.
Twin Range Filter Algo@Colinmck used two different ranges to generate signals. Read his release notes to find out what the original script does.
I added one condition which seems to increase performance on 15m BTCUSD as well as 1h BTCUSD and that is ATR with 32 periods being smaller than ATR with 64 periods. I used my script Volatility Optimiser to discover this tendency.
Both buying and selling conditions are same as in @Colinmck's script plus one condition of my own. You can disable my condition.
Target and stop-loss are manually set values in ticks.
Time stop-loss is manually set value in a number of candles. After this number of candles, a position always exits (or should 😇). You can disable it by inserting a very long period. I do not recommend it, because a value of indicator should not be measured in luck and if market starts moving in the direction after 40 periods, the predictive capability of an indicator is questionable.
I used 300/150/17 for 15m BTCUSD chart and 900/30/17 for 1h BTCUSD. I didn't try to optimize any other parameters for these periods.
Since this script relies mostly on volatility for its prediction, I wouldn't recommend using it on its own. Individual approach to the market is recommended. Also, it didn't work on EURUSD when using the same default values and different order management (tp, sl, time sl), so it is probably not as versatile.
Let me know what do you think of this strategy. If you have some ideas about how to make it more reliable, share it in the comments, I might put it to the test. Good luck 🍀
TradeSense Breakout Strategy v1TradeSense is a Renko brick breakout trading system for short-term or intraday trade. It is also a trend following strategy using a confluence of multiple MA's to spot the underlying trend. Exit and Stop Loss is based on dynamic ATR to predict possible target based on ticker's real time volatility.
So far this has been back-tested on major cyrptos, and the same concept is applicable to other asset types. It is more suitable for lower timeframes (such as the 30m, 15m, and 5m) though you may try adjusting the parameters for higher timeframes.
Feel free to backtest it and comment below!
Optimum parameters:
BTCUSD-15m
- Noise Filter: 1
- ATRLength : 15
- SL coefficient : 2.0
- TP coefficient : 1.5
ETHUSD-15m
- Noise Filter: 7
- ATRLength : 16
- SL coefficient : 2.0
- TP coefficient : 1.5
Systematic Momentum strategy v 1.0Systematic Momentum strategy v 1.0
This is a long-only strategy optimized taking into consideration the underlying's momentum and volatily.
Long story short it opens positions when the momentum is highest and the risk is lowest and closes the same position when the risk-to-reward is no longer optimal.
How to use:
-> To be used on an Index or a tracker ETF
-> Position sizing should be set up to 100% of the portfolio
EMA Slope Trend Follower StrategyThis strategy is based on the slope of the EMA130.
Over that slope, the script calculates two EMAs (9,21) which are used to generate the main entry and exit signal.
In particular, the strategy enters a LONG position when EMA9 > EMA21. On the contrary, it closes the LONG and opens a SHORT when EMA9 < EMA21.
When the slope of the EMA130 is rising, it means that the price is accelerating upwards, fueling an uptrend. Conversely, when the slope is falling, it means that the price is slowing down, falling into a possible downtrend.
Calculating and analyzing two EMAs (fast and slow) over the slope of a medium length EMA instead of the price anticipates a lot the signal. In this way, the strategy never miss a trend.
In order to minimize false positives (entering useless positions), I included two filters, which can be optionally turned on:
- Trend Filter: When the price is above EMA200, the strategy opens ONLY LONG positions. If price < EMA200, only shorts allowed. If the slope gives a long signal and price is below EMA200, for example, the eventual SHORT position is closed, but the LONG entry is postponed to the moment when both conditions (slope uptrending and price > ema200) are met.
I recommend always turning on this filter, as it dramatically decreases drawdown.
- Volatility Filter: When the standard deviation of the last 20 candles is below its 50 samples moving average, no positions are opened, as market is going sideways. The purpose of this filter is to prevent false positives (positions which open and close in a matter of candles due to false signals in sideways market).
I recommend turning on this filter only on low time frames.
This strategy works great on medium time frames (like 4h, 6h, daily), since it spends way less in fees, opening less positions.
It works good on low TFs too (up to 1h, didn't test lower ones), provided Volatility filter is turned on and parameters are set according to the asset.
Commission included in calculations: 0.06% (it's the taker commission on BitMEX with the 10% discount obtainable with any referral link)
Slippage included in calculations: 2 ticks (BitMEX has very liquid order books, and slippage doesn't happen very often unless a huge position size is used).
BKN: Thick Cut StrategyThick Cut is the juiciest BKN yet. This indicator is created to take a profitable trading strategy and turn it into an automated system. We've built in several pieces that professional traders use every day and turned it into an algo that produces on timeframes as low as 1, 3, and 5 minutes!
Limit Order Entries: When criteria is met, an alert is signaled that will send a value to enter a position at a limit price.
Built in Stop Loss: A stop is built in and the value can be sent to your bot using the {{plot}} function or you can rely on a TradingView alert when the stop is hit.
Built in Take Profits: We've built in two separate take profits and the ability to move your stop loss to breakeven after the first take profit is hit. Even if you take 50% profit at 1R and move your stop loss, you already have a profitable trade. Test results show 50% profits at 2R and the remainder at higher returns result in exceptional results.
Position Sizing: We've built in a position size based on your own predetermined risk. Want to risk $100 per trade? Great, put in 100 in the inputs and reference a quantity of {{plot("Position Size")}} in your alert to send a position size to the bot. You can also reference {{plot("Partial Close")}} to pull 50% of the position size closing 50% at TP1 and 50% at TP2.
Backtest results shown are very short term since we are viewing a 15m chart. This can be a profitable strategy on many timeframes, but lower timeframes will maximize results.
A unique script with incredible results. Further forward testing is live.
***IMPORTANT***
For access, please do not comment below. Comments here will not be replied to. Please send a DM here or on my linked Twitter. At this time, this strategy is considered a Beta release as we continue to fine tune settings and more. Expecting 2 weeks of beta with official release around June 6.
GOAT Signals Custom No Repaint Buy Sell Arrow Strategy Tester
WELCOME to GOAT Signals Custom No Repaint Buy Sell Moving Average (MA) Strategy Tester!
This indicator can quickly and easily identify the past trading success of signals based on moving averages.
What is a Moving Average?
According to investopedia.com a moving average (MA) is a widely used indicator in technical analysis that helps smooth out price action by filtering out the “noise” from random short-term price fluctuations.
Keeping this in mind let me give an example how this indicator could be useful in identifying trends.
Many Bitcoin traders use the 21 moving average on the weekly chart to make trading decisions.
Some of this has to do with 21 being a Fibonacci sequence number, and also because of how Bitcoin price action has reacted to it's trend line in the past.
When applying this script to the Bitcoin(BLX) weekly chart with a 21 moving average the strategy tester gives us 33.33 % Percent Profitable results with 6.31 % Net Profit.
If we test another moving average, let's try 29, and change our step input to 1, we get 85.71 % Percent Profitable with 9.22 % Net Profit.
With a bit of tweaking we may be able to find charts and settings with even better performance.
Keep in mind the strategy tester does not calculate trading fees, therefore in most cases will work better on longer time frames.
The Step input gives price action some breathing space if desired. Steps can be added or subtracted.
Personally, I use the Daily and Weekly charts except during high volatility, and use a one or two bar trail depending on price action.
Past performance does NOT guarantee future gains but keep in mind Bitcoin, Litecoin and a few others are on deflationary cycles.
For full invite only access please contact DogeyBlaze.
Alert Script And Limited Time Free Trial Available.
Not Certified Financial Advice.


