STRX - Structure Min/MaxSTRX - Structure Min/Max
The STRX - Structure Min/Max is an advanced and intuitive indicator designed for traders who want to identify key highs and lows in the market and visualize support and resistance structures clearly. Perfect for those looking to improve their chart reading abilities, this tool offers a simple and effective way to pinpoint key reversal points.
Key Features:
Relevant Pivot Highs and Lows: The indicator automatically calculates pivot highs and lows using a customizable period. These price levels are precisely displayed on the chart, with an "H" label for highs and "L" for lows, helping traders easily identify market turning points.
Dynamic Support and Resistance Lines: When a significant high or low is detected, the indicator automatically draws an extended support or resistance line. These dashed lines clearly show where the price may find support or resistance in future moves.
Complete Customization: The period for pivot calculation can be adjusted between 2 and 50, making this indicator extremely flexible and adaptable to different trading strategies, whether short or long-term. Additionally, users can choose to enable or disable the display of lines on highs and lows, keeping the chart clean and focused on relevant information.
Clean and Intuitive Visualization: Highs and lows are displayed with distinct symbols above and below the bars on the chart, allowing traders to quickly identify reversal points without confusion. The automatically drawn support and resistance lines extend to give a clear indication of critical market zones.
Versatile Tool: The STRX - Structure Min/Max is ideal for any type of asset, such as stocks, cryptocurrencies, forex, or commodities, and is applicable to any timeframe, from intraday trading to long-term analysis.
With STRX - Structure Min/Max, you can enhance your technical analysis skills by easily recognizing key reversal points and support and resistance zones, making your trading decisions more informed and precise. This indicator is perfect for those who want a structured and visually clear approach to market analysis.
波浪分析

Volume Wave Trend ConfirmationUtility of the Indicator
The core utility of this indicator lies in its ability to utilize volume, a less frequently exploited metric in MACD analysis, providing several strategic advantages:
Trend Confirmation: By focusing on volume, the indicator confirms whether movements in price are backed by significant trading activity. A rising MACD line above the signal line, paired with increasing volume, can confirm the strength of an uptrend. Conversely, if the histogram turns negative while the MACD line falls below the signal line during a price drop, it confirms a robust downtrend.
Early Warning Signals: Changes in the histogram and divergences between the MACD and Signal lines can serve as early warnings of potential reversals or slowdowns in market momentum. For instance, a shrinking histogram in an uptrend might suggest that the upward movement is losing steam.
Market Sentiment: The integration of volume into the MACD framework allows the indicator to provide insights into underlying market sentiment. Higher volumes during price movements indicate stronger conviction among traders, making the trend more reliable.
Indicator Functionality
The "Volume Wave Trend Confirmation" indicator is built on the Moving Average Convergence Divergence (MACD) framework, but with a unique twist: it uses the smoothed moving averages (SMA) of trading volumes instead of price. The indicator calculates two specific SMAs of the volume — a shorter 33-period SMA and a longer 100-period SMA — and computes their difference. This difference is then used as the input for the MACD calculation, with typical parameters set at 12, 26, and a signal line of 9.
MACD Line (Blue): Represents the main line, calculated as the difference between the 12-period and 26-period exponential moving averages (EMA) of the volume difference.
Signal Line (Orange): A 9-period EMA of the MACD line, acting as a trigger for buy or sell signals.
Histogram (Blue/Purple): Measures the distance between the MACD line and the Signal line, colored blue when positive (above the Signal line) and purple when negative (below the Signal line).

DCA, Support and Resistance with RSI and Trend FilterThis script is based on
script from Kieranj with added pyramiding and DCA
The buy condition (buyCondition) is triggered when the RSI crosses above the oversold threshold (ta.crossover(rsi, oversoldThreshold)), the trend filter confirms an uptrend (isUptrend is true), and the close price is greater than or equal to the support level (close >= supportLevel).
The partial sell condition (sellCondition) is triggered when the RSI crosses below the overbought threshold (ta.crossunder(rsi, overboughtThreshold)) and profit goal is reached, the trend filter confirms a downtrend (isUptrend is false), and the close price is less than or equal to the resistance level (close <= resistanceLevel).
Full sell will be triggered if trend is broken and profit goal is reached
With this implementation, the signals will only be generated in the direction of the trend on the 4-hour timeframe. The trend is considered up when the 50-period SMA is below the 200-period SMA (ta.sma(trendFilterSource, 50) < ta.sma(trendFilterSource, 200)).
Pyramiding should be activated, values like 100, so every DCA step should be around 1%
i have best results on 5 min charts
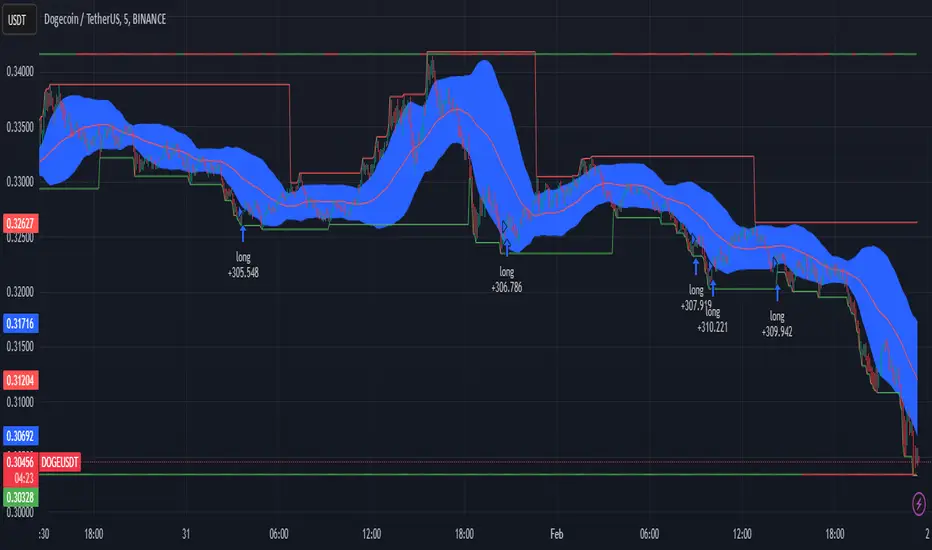
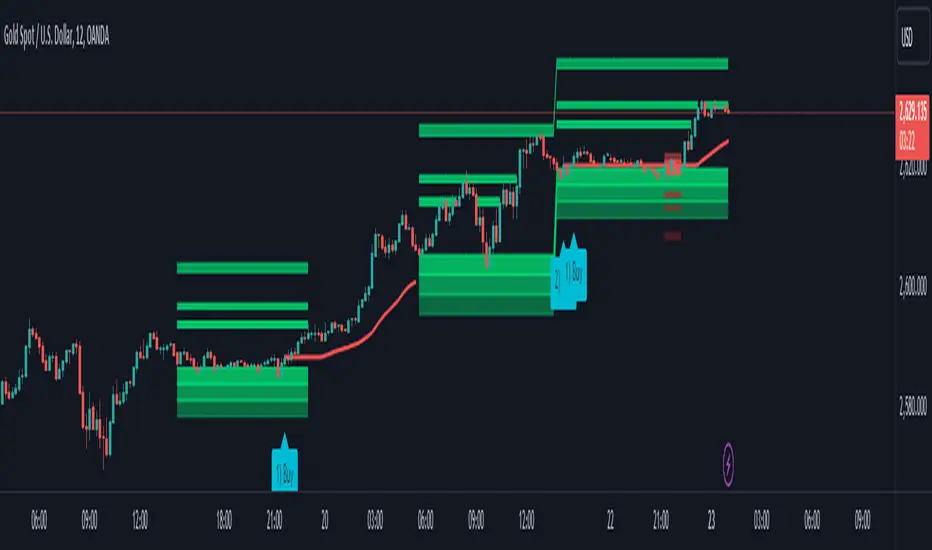
Gaussian Filter [BigBeluga]The Gaussian Filter - BigBeluga indicator is a trend-following tool that uses a Gaussian filter to smooth price data and identify directional shifts in the market. It provides dynamic signals for entering and exiting trades based on trend changes, helping traders stay aligned with the market's momentum. What sets this indicator apart is its ability to display precise entry and exit points with real-time tracking of percentage price changes, making it ideal for trend-based strategies.
SP500:
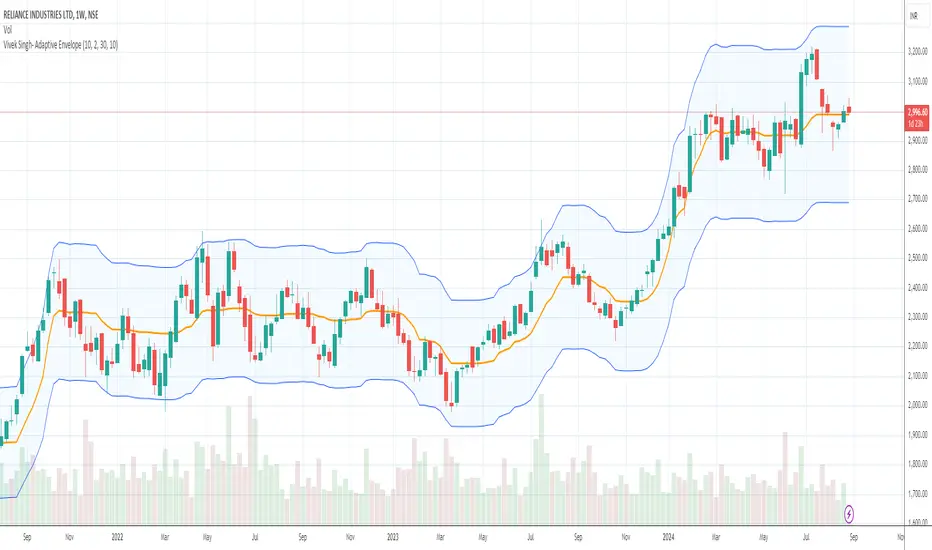
NIFTY50:
🔵 KEY FEATURES & USAGE
◉ Gaussian Filter Trend Line:
//@function GaussianFilter is used for smoothing, reducing noise, and computing derivatives of data.
//@param src (float) The source data (e.g., close price) to be smoothed.
//@param params (GaussianFilterParams) Gaussian filter parameters that include length and sigma.
//@returns (float) The smoothed value from the Gaussian filter.
gaussian_filter(float src, params) =>
var float weights = array.new_float(params.length) // Array to store Gaussian weights
total = 0.0
pi = math.pi
for i = 0 to params.length - 1
weight = math.exp(-0.5 * math.pow((i - params.length / 2) / params.sigma, 2.0))
/ math.sqrt(params.sigma * 2.0 * pi)
weights.set(i, weight)
total := total + weight
for i = 0 to params.length - 1
weights.set(i, weights.get(i) / total)
sum = 0.0
for i = 0 to params.length - 1
sum := sum + src * weights.get(i)
sum
The core functionality of the Gaussian Filter line is to show trend direction. When the trend line increases four times consecutively, it indicates an uptrend signal. Similarly, if it decreases four times in a row, it signals a downtrend. The smoothness of the filter helps traders stay on the right side of the market by filtering out noise and emphasizing the dominant trend direction.
◉ Entry and Exit Levels with Real-Time Price and Performance Data:
Each time the indicator detects a trend change, it plots an entry or exit level on the chart. For an uptrend, an entry level is marked, and for a downtrend, an exit level is plotted. These levels display the price at the time of the signal.
While the trend is ongoing, the indicator tracks the percentage change in price from the initial entry or exit signal to the current bar, updating in real-time. When a trend concludes, it displays the total percentage change from the entry or exit point to the trend's end. This feature provides valuable insights into how much the price has moved during each trend phase and allows traders to monitor the performance of each trade.
◉ Color-Coded Candlestick Representation with Trend Shift Alerts:
In addition to coloring the candlesticks based on the trend direction, the indicator also uses gray candles to highlight potential early trend shifts. For example, if the Gaussian Filter detects a downtrend but the price moves above the filter line, the candles turn gray, signaling a possible reversal or shift in momentum. Similarly, in an uptrend, if the price moves below the Gaussian Filter line, the candles turn gray as an early indication of potential bearish momentum. This visual cue helps traders stay alert to possible faster shifts in market direction, allowing for quicker decision-making.
🔵 CUSTOMIZATION
Length and Sigma for Gaussian Filter:
Adjust the length and sigma parameters to control how the Gaussian Filter smooths the price data. A longer length provides smoother trend lines, while adjusting sigma can fine-tune the level of smoothing applied.
Levels Display and Candle Coloring:
You can toggle the visibility of entry and exit levels as well as enable or disable the dynamic coloring of candlesticks based on the trend direction. The additional gray color setting provides an extra layer of information, allowing you to spot potential trend reversals early.
🔵 CONCLUSION
The Gaussian Filter indicator is a powerful tool for identifying and following market trends. By providing clear entry and exit signals, along with real-time tracking of price changes, it gives traders a structured way to manage trades and monitor performance. The color-coded candles, including gray to highlight possible trend shifts, add another dimension to visualizing market dynamics. The added flexibility of customizing colors and trend levels makes it a versatile indicator suitable for both trend-following and reversal strategies.

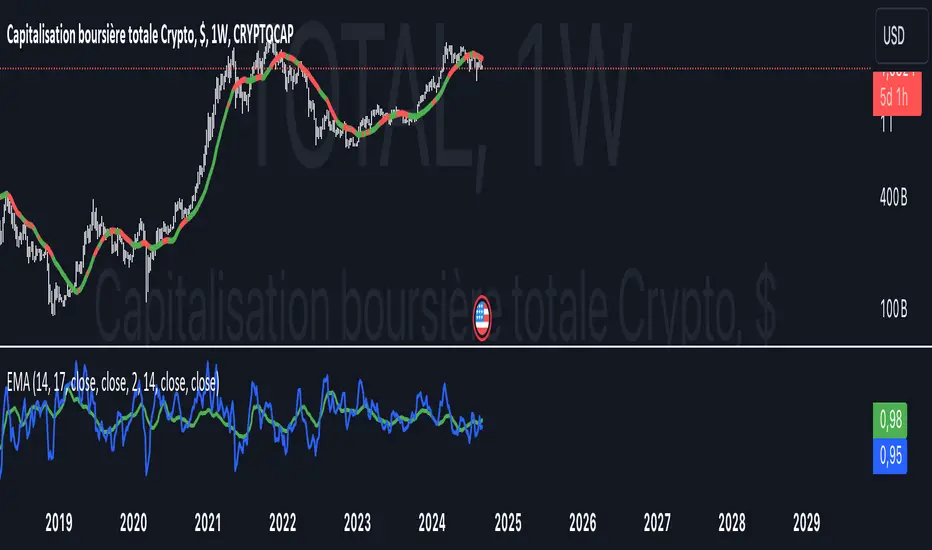
COMBINED EMA & SMA + DOUBLE DEMA, $TOTAL 1W / 5D -- Ruslan CRYPTOCAP:TOTAL
This Pine Script indicator, **"EMAS"**, provides an enhanced visualization of multiple types of moving averages, including both **Exponential Moving Averages (EMA)**, **Simple Moving Averages (SMA)**, and **Double Exponential Moving Averages (DEMA)**. It allows the user to observe the relationship between these different types of moving averages and apply regime-based coloring to price bars based on the comparison between the EMAs and DEMAs.
#### Key Features:
1. **EMA & SMA:**
- **EMA (Exponential Moving Average):** Calculated using a customizable lookback period (default 17), the EMA places greater weight on more recent prices, making it react faster to price changes.
- **SMA (Simple Moving Average):** Uses an equal-weighted average over a customizable lookback period (default 14), providing a slower-moving average compared to the EMA.
2. **DEMA (Double Exponential Moving Average):**
- Two separate DEMA lines are plotted using different lookback periods (default 2 and 14). The DEMA is a smoother and faster-responding version of the EMA, intended to reduce lag while retaining trend-following characteristics.
3. **Combined Signals:**
- The script calculates ratios between EMA/SMA (`comb`) and DEMA1/DEMA2 (`combd`) to generate a **regime-based bar coloring system**:
- If `combd > comb`: The bars are colored **green**, indicating that DEMAs are outperforming the EMAs, potentially signaling a stronger trend or momentum.
- If `comb > combd`: The bars are colored **red**, suggesting that the EMAs are dominant, which may indicate a different phase of the market.
4. **Signal SMA:**
- A 21-period **SMA** is plotted as a general trend-following signal. It provides a broader perspective on the current price trend, helping to smooth out short-term fluctuations.
5. **Customizable Options:**
- **"Show MAs?"**: The user has the option to toggle the display of the EMA, SMA, and DEMA lines on or off.
- **Custom Period Inputs**: Each type of moving average can have its period length customized via the input settings for better adaptability to different market conditions.
#### How to Use the Indicator:
- **Trend Following**:
The **EMA, SMA, and DEMA** values can help you determine the direction of the trend. When the EMA is above the SMA, it could indicate a stronger, more recent upward momentum. Similarly, DEMA comparisons provide smoother and faster trend signals.
- **Bar Coloring Regime**:
The **bar color** gives a quick visual cue of the regime:
- **Green bars** suggest that DEMAs are indicating stronger bullish or bearish signals compared to the EMAs.
- **Red bars** imply the opposite, where EMAs may be showing stronger signals, but possibly with more noise or lag.
- **Signal SMA**:
The **21-period SMA** line can be used as a simple trend indicator. When the price is above this line, it could signify an uptrend, while price movement below the line might indicate a downtrend.
#### Custom Inputs:
- **EMA Length**: Default is 17, but can be adjusted to fit your trading style.
- **SMA Length**: Default is 14.
- **DEMA Lengths**: Two customizable inputs for DEMA (default 2 and 14).
- **Source Selection**: You can choose which price source (close, open, high, low, etc.) to use for each calculation (default is the closing price).
#### Conclusion:
This indicator is useful for traders who wish to blend **trend-following strategies** (using EMA, SMA, and DEMA) with **visual regime indicators** (bar coloring). It is highly customizable, allowing traders to adjust settings based on their market approach. The combination of EMAs and DEMAs provides a nuanced view of price dynamics, potentially leading to better-informed trading decisions.
GKD-C Wavelet Oscillator [Loxx]The Giga Kaleidoscope GKD-C Wavelet Oscillator is a Confirmation module included in AlgxTrading's "Giga Kaleidoscope Modularized Trading System."
█ GKD-C Wavelet Oscillator, a brief overview
The Wavelet Oscillator is an advanced technical analysis tool that integrates wavelet transformations with the Kalman filter to provide a nuanced understanding of market trends and momentum. At the heart of this oscillator is the Haar wavelet transform, a mathematical technique that breaks down price data into different frequency components. The Haar transform works by analyzing the price series in pairs, calculating the average and difference between adjacent data points, effectively separating the underlying signal (trend) from noise or minor fluctuations. This decomposition allows the oscillator to isolate significant price movements and reconstruct them with greater clarity through the inverse Haar transform. The Kalman filter is then applied to further smooth the signal, refining the data and reducing the impact of short-term volatility.
This process enhances the oscillator's ability to detect subtle shifts in market dynamics that might be missed by conventional indicators. The GKD-C Wavelet Oscillator utilizes these refined signals to generate two types of trading signals: Zero-line crosses, where the oscillator moves above or below a central reference point, indicating potential bullish or bearish momentum, and Signal crosses, where the current oscillator value crosses its previous value, signaling possible trend reversals. These features make the Wavelet Oscillator particularly effective in identifying key turning points in the market, providing traders with a powerful tool for anticipating and responding to changes in price momentum within the GKD trading system. (Read the sections below to learn how traders can test these different signal types using AlgxTrading's GKD trading system.)
GKD-C Wavelet Oscillator in Zero-line crosses mode
GKD-C Wavelet Oscillator in Signal crosses mode
To explain the features included in the GKD-C Wavelet Oscillator, let's first dive into the details of the Giga Kaleidoscope (GKD) Modularized Trading System.
█ Giga Kaleidoscope (GKD) Modularized Trading System
The GKD Trading System is a comprehensive, algorithmic trading framework from AlgxTrading, designed to optimize trading strategies across various market conditions. It employs a modular approach, incorporating elements such as volatility assessment, trend identification through a baseline, multiple confirmation strategies for signal accuracy, and volume analysis. Key components also include specialized strategies for entry and exit, enabling precise trade execution. The system allows for extensive backtesting, providing traders with the ability to evaluate the effectiveness of their strategies using historical data. Aimed at reducing setup time, the GKD system empowers traders to focus more on strategy refinement and execution, leveraging a wide array of technical indicators for informed decision-making.
🔶 Core components of a GKD Algorithmic Trading System
Each GKD indicator is denoted with a module identifier of either: GKD-BT, GKD-B, GKD-C, GKD-V, GKD-M, or GKD-E. This allows traders to understand to which module each indicator belongs and where each indicator fits into the GKD system. The GKD algorithm is built on the principles of trend, momentum, and volatility. There are eight core components in the GKD trading algorithm:
🔹 Volatility - In the GKD trading system, volatility is used as a part of the system to help determine the appropriate stop loss and take profit levels for a trade. There are 17+ different types of volatility available in the GKD system including Average True Range (ATR), True Range Double (TRD), Close-to-Close, Garman-Klass, and more.
🔹 Baseline (GKD-B) - The baseline is essentially a moving average and is used to determine the overall direction of the market. The baseline in the GKD trading system is used to filter out trades that are not in line with the long-term trend of the market. The baseline is plotted on the chart along with other GKD indicators.
Trades are only taken when the price is in the same direction as the baseline. For example, if the baseline is sloping upwards or price is above the baseline, then only long trades are taken, and if the baseline is sloping downwards or price is below the baseline, then only short trades are taken. This approach helps to ensure that trades are in line with the overall trend of the market, and reduces the risk of entering trades that are likely to fail.
🔹 Confirmation 1, Confirmation 2, Continuation (GKD-C) - The GKD trading system incorporates technical confirmation indicators for the generation of its primary long and short signals, essential for its operation.
The GKD trading system distinguishes three specific categories. The first category, Confirmation 1, encompasses technical indicators designed to identify trends and generate explicit trading signals. The second category, Confirmation 2, a technical indicator used to identify trends; this type of indicator is primarily used to filter the Confirmation 1 indicator signals; however, this type of confirmation indicator also generates signals*. Lastly, the Continuation category includes technical indicators used in conjunction with Confirmation 1 and Confirmation 2 to generate a special type of trading signal called a "Continuation"
In a full GKD trading system all three categories generate signals. (see the section “GKD Trading System Signals” below)
🔹 Volatility/Volume (GKD-V) - Volatility/Volume indicators are used to measure the amount of buying and selling activity in a market. They are based on the trading Volatility/Volume of the market, and can provide information about the strength of the trend. In the GKD trading system, Volatility/Volume indicators are used to confirm trading signals generated by the various other GKD indicators. In the GKD trading system, Volatility is a proxy for Volume and vice versa.
Volatility/Volume indicators reduce the risk of false signals and improve the overall profitability of trades. These indicators can provide additional information about the market that is not captured by GKD-C confirmation and GKD-B baseline indicators.
🔹 Exit (GKD-E) - The exit indicator in the GKD system is an indicator that is deemed effective at identifying optimal exit points. The purpose of the exit indicator is to identify when a trend is likely to reverse or when the market conditions have changed, signaling the need to exit a trade. By using an exit indicator, traders can manage their risk and prevent significant losses.
🔹 Backtest (GKD-BT) - The GKD-BT backtest indicators link all other GKD-C, GKD-B, GKD-E, GKD-V, and GKD-M components together to create a GKD trading system. GKD-BT backtests generate signals (see the section “GKD Trading System Signals” below) from the confluence of various GKD indicators that are imported into the GKD-BT backtest. Backtest types include: GKD-BT solo and full GKD backtest strategies used for a single ticker; GKD-BT optimizers used to optimize a single indicator or the full GKD trading system; GKD-BT Multi-ticker used to backtest a single indicator or the full GKD trading system across up to ten tickers; GKD-BT exotic backtests like CC, Baseline, and Giga Stacks used to test confluence between GKD components to then be injected into a core GKD-BT Multi-ticker backtest or single ticker strategy.
🔹 Metamorphosis (GKD-M)** - The concept of a metamorphosis indicator involves the integration of two or more GKD indicators to generate a compound signal. This is achieved by evaluating the accuracy of each indicator and selecting the signal from the indicator with the highest accuracy. As an illustration, let's consider a scenario where we calculate the accuracy of 10 indicators and choose the signal from the indicator that demonstrates the highest accuracy.
The resulting output from the metamorphosis indicator can then be utilized in a GKD-BT backtest by occupying a slot that aligns with the purpose of the metamorphosis indicator. The slot can be a GKD-B, GKD-C, GKD-E, or GKD-V slot, depending on the specific requirements and objectives of the indicator. This allows for seamless integration and utilization of the compound signal within the GKD-BT framework.
*(see the section “GKD Trading System Signals” below)
**(not a required component of the GKD algorithm)
🔶 What does the application of the GKD trading system look like?
Example trading system:
Volatility: Average True Range (ATR) (selectable in all backtests and other related GKD indicators)
GKD-B Baseline: GKD-B Multi-Ticker Baseline using Hull Moving Average
GKD-C Confirmation 1: GKD-C Advance Trend Pressure
GKD-C Confirmation 2: GKD-C Dorsey Inertia
GKD-C Continuation: GKD-C Stochastic of RSX
GKD-V Volatility/Volume: GKD-V Damiani Volatmeter
GKD-E Exit: GKD-E MFI
GKD-BT Backtest: GKD-BT Multi-Ticker Full GKD Backtest
GKD-M Metamorphosis: GKD-M Baseline Optimizer
**all indicators mentioned above are included in the same AlgxTrading package**
Each module is passed to a GKD-BT backtest module. In the backtest module, all components are combined to formulate trading signals and statistical output. This chaining of indicators requires that each module conform to AlgxTrading's GKD protocol, therefore allowing for the testing of every possible combination of technical indicators that make up the various indictor types in the GKD algorithm.
🔶 GKD Trading System Signals
🔹 Standard Entry requires a sequence of conditions including a confirmation signal from GKD-C, baseline agreement, price criteria related to the Goldie Locks Zone, and concurrence from a second confirmation and volatility/volume indicators.
🔹 1-Candle Standard Entry introduces a two-phase process where initial conditions must be met, followed by a retraction in price and additional confirmations in the subsequent candle, including baseline, confirmations 1 and 2, and volatility/volume criteria.
🔹 Baseline Entry focuses on signals generated by the GKD-B Baseline, requiring agreement from confirmation signals, specific price conditions within the Goldie Locks Zone, and a timing condition related to the confirmation 1 signal.
🔹 1-Candle Baseline Entry mirrors the baseline entry but adds a requirement for a price retraction and subsequent confirmations in the following candle, maintaining the focus on the baseline's guidance.
🔹 Volatility/Volume Entry is predicated on signals from volatility/volume indicators, requiring support from confirmations, price criteria within the Goldie Locks Zone, baseline agreement, and a timing condition for the confirmation 1 signal.
🔹 1-Candle Volatility/Volume Entry adapts the volatility/volume entry to include a phase of initial signal and agreement, followed by a retracement phase that seeks further agreement from the system's components in the subsequent candle.
🔹 Confirmation 2 Entry is based on the second confirmation signal, requiring the first confirmation's agreement, specific price criteria, agreement from volatility/volume indicators, and baseline, with a timing condition for the confirmation 1 signal.
🔹 1-Candle Confirmation 2 Entry adds a retracement requirement to the confirmation 2 entry, necessitating additional agreements from the system's components in the candle following the signal.
🔹 PullBack Entry initiates with a baseline signal and agreement from the first confirmation, with a price condition related to volatility. It then looks for price to return within the Goldie Locks Zone and seeks further agreement from the system's components in the subsequent candle.
🔹 Continuation Entry allows for the continuation of an active position, based on a previously triggered entry strategy. It requires that the baseline hasn't crossed since the initial trigger, alongside ongoing agreements from confirmations and the baseline.
█ GKD-C Wavelet Oscillator, a deep dive
Now that you have a basic understanding of the GKD trading system. let's dive deeper into the features included in the GKD-C Wavelet Oscillator
🔶 GKD-C Wavelet Oscillator Modes aka "Confirmation Type"
The GKD-C Wavelet Oscillator has 4 modes: Confirmation for confirmation 1 and 2; Continuation; Multi-ticker for multi-ticker confirmation 1 and 2; and Optimizer.
🔹 Confirmation: When in this mode, the GKD-C Wavelet Oscillator generates confirmation 1 and 2 signals. These values can then be exported to a GKD-BT backtest strategy.
Signal Key: L = Long, S = Short
GKD-C Wavelet Oscillator in Confirmation mode
Confirmation Exports
GKD-C Wavelet Oscillator in attached to a GKD-BT backtest strategy
**the backtest data rendered to the chart above uses $5 commission per trade and 10% equity per trade with $1 million initial capital. Each backtest result for each ticker assumes these same inputs. The results are NOT cumulative, they are separate and isolated per ticker and trading side, long or short**
🔹 Continuation: When in this mode, the GKD-C Wavelet Oscillator generates continuation signals.
Signal Key: L = Long, S = Short, CL = Continuation Long, CS = Continuation Short
GKD-C Wavelet Oscillator in Continuation mode
Continuation Exports
🔹 Multi-ticker: When in this mode, the GKD-C Wavelet Oscillator generates multi-ticker confirmation 1 and 2. This mode allows users to generate confirmation 1 and 2, and continuation signals for up to 10 different tickers. These values can then be exported to a GKD-BT Multi-ticker backtest.
Signal Key: L = Long, S = Short
GKD-C Wavelet Oscillator in Multi-ticker mode
Multi-ticker Exports
GKD-C Wavelet Oscillator attached to the GKD-BT Multi-ticker SCS Backtest
**the backtest data rendered to the chart above uses $5 commission per trade and 10% equity per trade with $1 million initial capital. Each backtest result for each ticker assumes these same inputs. The results are NOT cumulative, they are separate and isolated per ticker and trading side, long or short**
🔹 Optimizer: When in this mode, the GKD-C Wavelet Oscillator generates optimization signals. These signals allow the user to backtest a range of input values. These values are exported to a GKD-BT optimizer backtest.
Signal Key: L = Long, S = Short
GKD-C Wavelet Oscillator in Optimizer mode
Optimizer Inputs and Exports
GKD-C Wavelet Oscillator attacked to the GKD-BT Optimizer SCS Backtest
**the backtest data rendered to the chart above uses $5 commission per trade and 10% equity per trade with $1 million initial capital. Each backtest result for each ticker assumes these same inputs. The results are NOT cumulative, they are separate and isolated per ticker and trading side, long or short**
█ Conclusion
The GKD-C Wavelet Oscillator serves as a multi-modal component of the GKD trading system allowing traders to optimize and backtest acorss a range of input parameters and tickers. These features decrease total build time required to create a custom GKD algorithmic trading system by allowing users to spend more time trading and less time guessing.
█ How to Access
You can see the Author's Instructions below to learn how to get access.

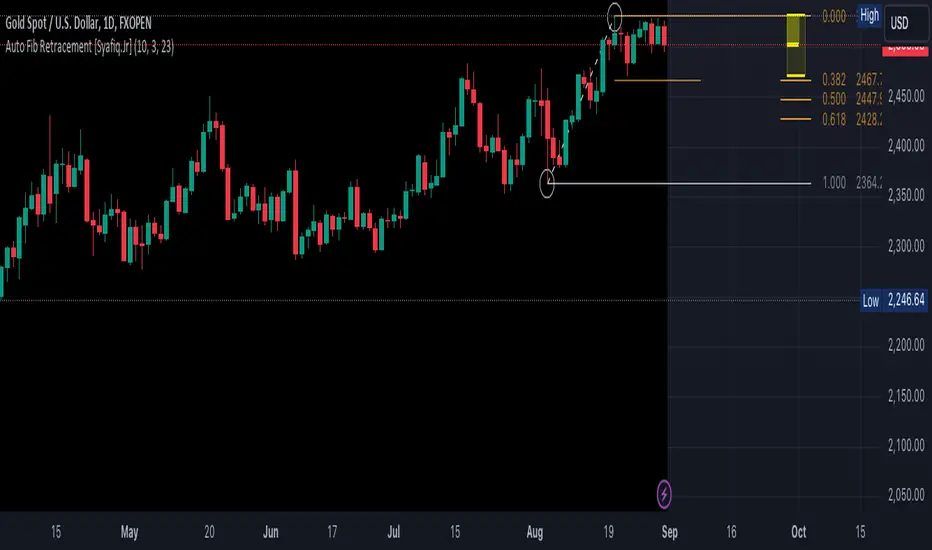
Auto Fib Retracement [Syafiq.Jr]This TradingView script is an advanced indicator titled "Auto Fib Retracement Neo ." It's designed to automatically plot Fibonacci retracement levels on a price chart, aiding in technical analysis for traders. Here's a breakdown of its functionality:
Core Functionality :
The script identifies pivot points (highs and lows) on a chart and draws Fibonacci retracement lines based on these points. The lines are dynamic, updating in real-time as the market progresses.
Customizable Inputs :
Depth: Determines the minimum number of bars considered in the pivot point calculation.
Deviation: Adjusts the sensitivity of the script in identifying new pivots.
Fibonacci Levels: Allows users to select which retracement levels (236, 382, 500, 618, 786, 886) are displayed on the chart.
Visual Settings: Customization options include the colors and styles of pivot points, trend lines, and the retracement meter.
Pivot and Line Calculation:
The script calculates the deviation between the current price and the last pivot point. If the deviation exceeds a certain threshold, it identifies a new pivot and draws a trend line between the previous pivot and the current one.
Visual Aids :
The indicator provides extensive visual aids, including pivot points marked with circles, dashed trend lines connecting pivots, and labels displaying additional information like price and delta rate.
Performance :
Optimized to handle large datasets, the script is configured to process up to 4000 bars and can manage numerous lines and labels efficiently.
Background and Appearance :
The script allows for customization of the chart background color, enhancing visibility based on user preferences.
In essence, this script is a powerful tool for traders who rely on Fibonacci retracement levels to identify potential support and resistance areas, allowing for a more automated and visually guided approach to market analysis.
Dow Theory based Strategy (Markttechnik)What makes this script unique?
calculates two trends at the same time: a big one for the overall strong trend - and a small one to trigger a trade after a small correction within the big trend
only if both trends (the small and the big trend) are in an uptrend, a buy signal is created: this prevents a buy signal from being generated in a falling market just because an upward movement begins in a small trend
the exit strategy can be configured very flexibly and individually: use the last low as stop loss and automatically switch to a trialing stop loss as soon as the take profit is reached (instead of finishing the trade)
the take profit strategy can also be configured - e.g. use the last high, a fixed percentage or a combination of it
plots each trade in detail on the chart - e.g. inner candles or the exact progression of the stop loss over the entire duration of the trade to allow you to analyze each trade precisely
What does the script do and how?
In this strategy an intact upward trend is characterized by higher highs and lower lows only if the big trend and the small trend are in an upward trend at the same time.
The following describes how the script calculates a buy signal. Every step is drawn to the chart immediately - see example chart above:
1. the stock rises in the big trend - i.e. in a longer time frame
2. a correction takes place (the share price falls) - but does not create a new low
3. the stock rises again in the big trend and creates a new high
From now on, the big trend is in an intact upward trend (until it falls below its last low).
This is drawn to the chart as 3 bold green zigzag lines.
But we do not buy right now! Instead, we want to wait for a correction in the big trend and for the start of a small upward trend.
4. a correction takes place (not below the low from 2.)
Now, the script also starts to calculate the small trend:
5. the stock rises in the small trend - i.e. in a shorter time frame
6. a small correction takes place (not below the low from 4.)
7. the stock rises above the high from 5.: a new high in the shorter time frame
Now, both trends are in an intact upward trend.
A buy signal is created and both the minor and major trend are colored green on the chart.
Now, the trade is active and:
the stop loss is calculated and drawn for each candle
the take profit is calculated and drawn to the chart
as soon as the price reaches the take profit or the stop loss, the trade is closed
Features and functionalities
Uptrend : An intact upward trend is characterized by higher highs and lower lows. Uptrends are shown in green on the chart.
The beginning of an uptrend is numbered 1, each subsequent high is numbered 2, and each low is numbered 3.
Downtrend: An intact downtrend is characterized by lower highs and lower lows. Downtrends are displayed in red on the chart.
Note that our indicator does not show the numbering of the points of the downtrend.
Trendless phases: If there is no intact trend, we are in a trendless phase. Trendless phases are shown in blue on the chart.
This occurs after an uptrend, when a lower low or a lower high is formed. Or after a downtrend, when a higher low or a higher high is formed.
Buy signals
A buy signal is generated as soon as a new upward trend has been formed or a new high has been established in an intact upward trend.
But even before a buy signal is generated, this strategy anticipates a possible emerging trend and draws the next possible trading opportunity to the chart.
In addition to the (not yet reached) buy price, the risk-reward ratio, the StopLoss and the TakeProfit price is shown.
With this information, you can already enter a StopBuy order, which is thus triggered directly with the then created buy signal.
You can configure, if a buy signal shall be created while the big trend is an uptrend, a downtrend and/or trendless.
Exit strategy
With this strategy, you have multiple possibilities to close your position. All of them can be configured within the settings. In general, you can combine a take profit strategy with a stop loss strategy.
The take profit price will be calculated once for each trade. It will be drawn to the chart for active trade.
Depending on your configuration, this can be the last high (which is often a resistance level), a fixed percentage added to the buy price or the maximum of both.
You can also configure that a trailing stop loss is used as soon as the take profit price is reached once.
The stop loss gets recalculated with each candle and is displayed and plotted for each active and finished trade. With this, you can easily check how the stop loss changed during your trades.
The stop loss can be configured flexibly:
Use the classic "trailing stop loss" that follows the price from below.
Set the stop loss to the last low and tighten it every time the small trend marks a new local low.
Confiure that the stop loss is tightened as soon as the break even is reached. Nothing is more annoying than a trade turning from a win to a loss.
Ignore inside candles (see description below) and relax the stop loss to use the outside candle for its calculation.
Inner candles
Inner candles are created when the candle body is within the maximum values of a previous candle (the outer candle). There can be any number of consecutive inner candles. As soon as you have activated the "Check inner candles" setting, all consecutive inner candles will be highlighted in yellow on the chart.
Prices during an inner candle scenario might be irrelevant for trading and can be interpreted as fluctuations within the outside candle. For this reason, the trailing stop loss should not be aligned with inner candles. Therefore, as soon as an inner candle occurs, the stop loss is reset and the low at the time of the outside candle is used as the calculation for the trailing stop loss. This will all be plotted for you on the chart.
Display of the trades:
All active and closed trades of the last 5 years are displayed in the chart with buy signal, sell, stop loss history, inside candles and statistics.
Backtesting:
The strategy can be simulated for each stock over the period of the last 5 years. Each individual trade is recorded and can be traced and analyzed in the chart including stop loss history. Detailed evaluations and statistics are available to evaluate the performance of the strategy.
Additional Statistics
This strategy immediately displays a statistic table to the chart area giving you an overview of its performance over the last years for the given chart.
This includes:
The total win/loss in $ and %
The win/loss per year in %
The active investment time in days and % (e.g. invested 10 of 100 trading days -> 10%)
The total win/loss in %, extrapolated to 100% equity usage: Only with this value can strategies really be compared. Because you are not invested between the trades and could invest in other stocks during this time. This value indicates how much profit you would have made if you had been invested 100% of the time - or to put it another way - if you had been invested 100% of the time in stocks with exactly the same performance. Let's say you had only one trade in the last 5 years that lasted, say, only one month and made 5% profit. This would be significantly better than a strategy with which you were invested for, say, 5 years and made 10% profit.
The total profit/loss per year in %, extrapolated to 100% equity usage
Notifications (alerts):
Get alerted before a new buy signal emerges to create an order if necessary and not miss a trade. You can also be notified when the stop loss needs to be adjusted. The notification can be done in different ways, e.g. by Mail, PopUp or App-Notification. This saves them the annoying, time-consuming and error-prone "click through" all the charts.
Settings: Display Settings
With these settings, you have the possibility to:
Show the small or the big trend as a background color
Configure if the numbers (1-2-3-2-3) shall be shown at all or only for the small, the big trend or both
Settings: Trend calculation - fine tuning
Drawing trend lines on a chart is not an exact science. Some highs and lows are not very clear or significant. And so it will always happen that 2 different people would draw different trendlines for the same chart. Unfortunately, there is no exact "right" or "wrong" here.
With the options under "Trend Calculation - Fine Tuning" you have the possibility to influence the drawing in of trends and to adapt it to your personal taste.
Small Trend, Big Trend : With these settings you can influence how significant a high or low has to be to recognize them as an independent high or low. The larger the values, the more significant a high or low must be to be recognized as such.
High and low recognition : With this setting you can influence when two adjacent, almost identical highs or lows should be recognized as independent highs or lows. The higher the value, the more different "similar" highs or lows must be in order to be recognized as such.
Which default settings were selected and why
Show Trades: true - its often useful to see all recent trades in the chart
Time Frame: 1 day - most common time frame (except for day traders)
Take Profit: combined 10% - the last high is taken as take profit because the trend often changes there, but only if there is at least 10% profit to ensure we do not risk money for a tiny profit
Stop Loss: combined - the last low is used as stop loss because the trend would break there and switch to a trailing stop loss as soon as our take profit is reached to let our profits run without risking them anymore
Stop Loss distance: 3% - we are giving the price 3% air (below the last low) to avoid being stopped out due to a short price drop
Trailing Stop Loss: 2% - we have to give the stop loss some room to avoid being stopped out prematurely; this is a value that is well balanced between a certain downside distance and the profit-taking ratio
Set Stop Loss to break even: true, 2% - once we reached the break even, it is a common practice to not risk our money anymore, the value is set to the same value as the trailing stop loss
Trade Filter: Uptrend - we only start trades if the big trend is an uptrend in the expectation that it will continue after a small correction
Display settings: those will not influence the trades, feel free to change them to your needs
Trend calculation - Fine Tuning: 1/1,5/0,05; influences the internal calculation for highs and lows and how significant they need to be to be considered a new high or low; the default values will provide you nicely calculated trends in the daily time frame; if there are too many or too few lows and highs according to your taste, feel free to play around and immediately see the result drawn to the chart; read the manual for a detailed description of this values
Note that you can (and should) configure the general trading properties like your initial capital, order size, slippage and commission.

Unleash Bitcoin's Next Move with S&P Divergence!BTC_GO_LONG_SONG
This script works like a special helper that watches two things: Bitcoin (a popular type of digital money) and the S&P 500 (which is like a big basket of important companies' stocks).
Imagine Bitcoin and the S&P 500 are connected by an invisible elastic band.
When they move together: The elastic band stays relaxed.
When they move apart: The elastic band stretches.
This script keeps an eye on how much the elastic band stretches.
If Bitcoin starts to move in a different way than the S&P 500 and the band stretches a lot, the script thinks that Bitcoin might snap back or make a big jump soon.
Here’s how it works:
Volume Check: The script looks at how many people are buying or selling Bitcoin. If a lot more people are trading than usual, it’s like a signal that something big might happen.
Price Movement: It watches how Bitcoin’s price is changing. If Bitcoin breaks away from its usual pattern and moves far from where it was recently, it could be a sign that a big change is coming.
Elastic Band Check: The script checks if Bitcoin is moving differently than the S&P 500. If Bitcoin is doing its own thing while the S&P 500 moves in another direction, it’s like the elastic band is being stretched.
When all these things happen together—high trading volume, unusual price movement, and a stretched elastic band—the script shows a green triangle on the chart.
This triangle is a signal for people who believe Bitcoin might go up (the Bulls) that it could be a good time to think about entering a trade because a breakout might be coming.
This explanation uses the idea of an elastic band to describe the relationship between Bitcoin and the S&P 500, making it easier to understand how this script helps traders spot potential breakout opportunities.

Breaker Blocks + Order Blocks confirm [TradingFinder] BBOB Alert🔵 Introduction
In the realm of technical analysis, various tools and concepts are employed to identify key levels on price charts. These tools assist traders in analyzing market trends with greater precision, enabling them to optimize their trading decisions. Among these tools, the Order Block and Breaker Block hold a significant place, serving as effective instruments for analyzing market structure.
🟣 Order Block
An Order Block refers to zones on a chart where large financial institutions and high-volume traders place their orders. Due to the substantial volume of buy or sell orders in these areas, they are often regarded as pivotal points for potential price reversals or temporary pauses in a trend. Order Blocks are particularly crucial when prices react to these zones after a strong market move, acting as strong support or resistance levels.
🟣 Breaker Block
On the other hand, a Breaker Block refers to areas on a chart that previously functioned as Order Blocks but where the price has managed to break through and continue in the opposite direction. These zones are typically recognized as key points where market trends might shift, helping traders identify potential reversal points in the market.
🟣 Overlapping Block (BBOB)
Now, imagine a scenario where these two essential concepts in technical analysis—Order Blocks and Breaker Blocks—overlap on a chart. Although this overlap is not specifically discussed within the ICT (Inner Circle Trader) trading framework, exploring and utilizing this overlap can provide traders with powerful insights into strong support and resistance zones. The combination of these two robust concepts can highlight critical areas in trading, potentially offering significant advantages in making informed trading decisions.
In this article, we will delve into the concept of this overlap, explaining how to utilize it in trading strategies. Additionally, we will analyze the potential outcomes and benefits of incorporating this concept into your trading decisions.
Bullish Overlapping Block (BBOB) :
Bearish Overlapping Block (BBOB) :
🔵 How to Use
The overlap between Order Blocks and Breaker Blocks is a compelling and powerful concept that can help traders identify key levels on the chart with a high probability of success. This overlap is particularly valuable because it combines two well-regarded concepts in technical analysis—zones of high order volume and critical market shifts.
🟣 Here’s how to effectively use this overlap in your trading
1. Dentifying the Overlapping Block : To make the most of the overlap between Order Blocks and Breaker Blocks, begin by identifying these zones separately. Order Blocks are areas where price typically reacts and reverses after a strong market move.
Breaker Blocks are areas where a previous Order Block has been breached, and the price continues in the opposite direction. When these two zones overlap on a chart, it’s crucial to pay close attention to this area, as it represents a high-probability reaction zone.
2. Analyzing the Overlapping Block : After identifying the overlap zone, carefully analyze price action within this region. Candlestick patterns and price behavior can provide essential clues.
If the price reaches this overlap zone and strong reversal patterns such as Pin Bars or Engulfing patterns are observed, it’s likely that this zone will act as a pivotal reversal point. In such cases, entering a trade with confidence becomes more feasible.
3. Entering the Trade : When sufficient signs of price reaction are present in the overlap zone, you can proceed to enter the trade. If the overlap zone is within an uptrend and bullish reversal signals are evident, a long position might be appropriate.
Conversely, if the overlap zone is in a downtrend and bearish reversal signals are observed, a short position would be more suitable.
4. Risk Management : One of the most critical aspects of trading in overlap zones is managing risk. To protect your capital, place your stop loss near the lowest point of the Order Block (for buy trades) or the highest point (for sell trades). This approach minimizes potential losses if the overlap zone fails to hold.
5. Price Targets : After entering the trade, set your price targets based on other key levels on the chart. These targets could include other support and resistance zones, Fibonacci levels, or pivot points.
Bullish Overlapping Block :
Bearish Overlapping Block :
🟣 Benefits of the Overlapping Block Between Order Block and Breaker Block
1. Enhanced Precision in Identifying Key Levels : The overlap between these two zones usually acts as a highly reliable area for price reactions, increasing the accuracy of identifying entry and exit points.
2. Reduced Trading Risk : Given the high importance of the overlap zone, the likelihood of making incorrect decisions is reduced, contributing to overall lower trading risk.
3. Increased Probability of Success : The overlap between Order Blocks and Breaker Blocks combines two powerful concepts, enhancing the likelihood of success in trades, as multiple indicators confirm the importance of the area.
4. Creation of Better Trading Opportunities : Overlap zones often provide traders with more robust trading opportunities, as these areas typically represent strong reversal points in the market.
5. Compatibility with Other Technical Tools : This concept seamlessly integrates with other technical analysis tools such as Fibonacci retracements, trend lines, and chart patterns, offering a more comprehensive market analysis.
🔵 Setting
🟣 Global Setting
Pivot Period of Order Blocks Detector : Enter the desired pivot period to identify the Order Block.
Order Block Validity Period (Bar) : You can specify the maximum time the Order Block remains valid based on the number of candles from the origin.
Mitigation Level Order Block : Determining the basic level of a Order Block. When the price hits the basic level, the Order Block due to mitigation.
Mitigation Level Breaker Block : Determining the basic level of a Breaker Block. When the price hits the basic level, the Breaker Block due to mitigation.
Mitigation Level Overlapping Block : Determining the basic level of a Overlapping Block. When the price hits the basic level, the Overlapping Block due to mitigation.
🟣 Overlapping Block Display
Show All Overlapping Block : If it is turned off, only the last Order Block will be displayed.
Demand Overlapping Block : Show or not show and specify color.
Supply Overlapping Block : Show or not show and specify color.
🟣 Order Block Display
Show All Order Block : If it is turned off, only the last Order Block will be displayed.
Demand Main Order Block : Show or not show and specify color.
Demand Sub (Propulsion & BoS Origin) Order Block : Show or not show and specify color.
Supply Main Order Block : Show or not show and specify color.
Supply Sub (Propulsion & BoS Origin) Order Block : Show or not show and specify color.
🟣 Breaker Block Display
Show All Breaker Block : If it is turned off, only the last Breaker Block will be displayed.
Demand Main Breaker Block : Show or not show and specify color.
Demand Sub (Propulsion & BoS Origin) Breaker Block : Show or not show and specify color.
Supply Main Breaker Block : Show or not show and specify color.
Supply Sub (Propulsion & BoS Origin) Breaker Block : Show or not show and specify color.
🟣 Order Block Refinement
Refine Order Blocks : Enable or disable the refinement feature. Mode selection.
🟣 Alert
Alert Name : The name of the alert you receive.
Alert Overlapping Block Mitigation :
On / Off
Message Frequency :
This string parameter defines the announcement frequency. Choices include: "All" (activates the alert every time the function is called), "Once Per Bar" (activates the alert only on the first call within the bar), and "Once Per Bar Close" (the alert is activated only by a call at the last script execution of the real-time bar upon closing). The default setting is "Once per Bar".
Show Alert Time by Time Zone :
The date, hour, and minute you receive in alert messages can be based on any time zone you choose. For example, if you want New York time, you should enter "UTC-4". This input is set to the time zone "UTC" by default.
🔵 Conclusion
The overlap between Order Blocks and Breaker Blocks represents a critical and powerful area in technical analysis that can serve as an effective tool for determining entry and exit points in trading.
These zones, due to the combination of two key concepts in technical analysis, hold significant importance and can help traders make more confident trading decisions.
Although this concept is not specifically discussed in the ICT framework and is introduced as a new idea, traders can achieve better results in their trades through practice and testing.
Utilizing the overlap between Order Blocks and Breaker Blocks, in conjunction with other technical analysis tools, can significantly improve the chances of success in trading.

Jason's Simple Moving Averages WaveUnderstanding the Script:
Purpose: This script identifies potential trend direction and momentum using a moving average and wave amplitude calculation. It shows a green line when the price is trending upwards and a red line when trending downwards.
Strategy: This script doesn't provide a complete trading strategy. It's an indicator designed to be used alongside other tools.
Parameters: You can adjust the "Moving Average Length" input to change the sensitivity of the indicator. A shorter length will react quicker to price changes, while a longer length will be smoother but less responsive.
How to Use it:
Load the Script: In TradingView, navigate to the indicator creation section and paste the provided script code.
Adjust Parameters: Set the "Moving Average Length" based on your preferred timeframe and trading style.
Combine with Other Tools: Use the indicator along with other technical indicators or price action analysis to confirm potential entry and exit points for trades.
Here are some additional points to consider:
Crossovers: You could look for buy signals when the price crosses above the green line and sell signals when it crosses below the red line. However, these can be prone to false signals.
Divergence: Look for divergences between the price movement and the wave indicator. For example, a rising price with a falling wave could indicate overbought conditions and a potential reversal.
Confirmation: Don't rely solely on this indicator. Use it alongside other confirmations from price action, volume analysis, or other indicators to identify higher probability trades.
Important Note:

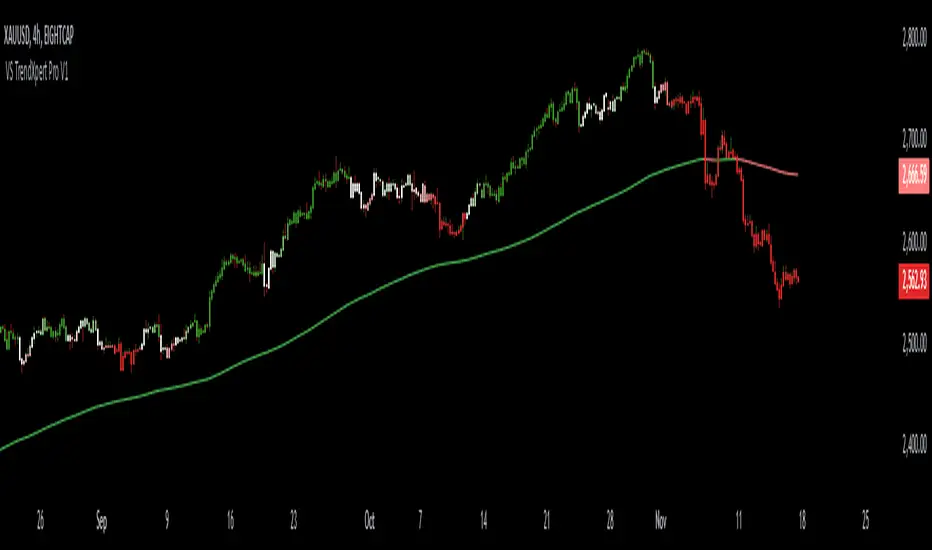
VS TrendXpert ProThe VS TrendXpert Pro indicator is designed to offer a comprehensive and powerful trading solution by combining trend identification, dynamic candle replication, buy/sell sensitivity signals, and volatility moving averages. This multi-functional tool aids traders in making informed decisions by visualizing trend strength, key price levels, and potential buy/sell opportunities across multiple timeframes and market conditions.
This script is a versatile and easy-to-use tool developed in Pine Script™ (TradingView) to help users identify trends and improve trading accuracy by leveraging advanced gradient color changes, dynamic candle replication, and a sensitivity-based signaling system. The indicator seamlessly blends visual clarity with robust trend analysis, making it suitable for both novice and professional traders.
Indicator Components:
VS Dynamic Trend
VS Dynamic Replicator
VS Sensitivity Buy/Sell
VS Volatile Moving Averages (VMAs)
1. VS Dynamic Trend
Description:
The VS Dynamic Trend component focuses on real-time trend detection by incorporating a gradient coloring system that shifts based on trend strength. This tool enables traders to visually assess the market's bullish or bearish strength using dynamic gradient colors on the chart candles.
What It Does:
Color Gradient Visualization: The candles are colored dynamically to reflect the strength of the trend. The gradient moves from weak to strong in both bullish and bearish conditions.
Gradient Sensitivity: Adjustable sensitivity controls allow traders to modify the color shift intensity, making the indicator responsive to varying market conditions.
How to Use:
Bullish Trend: Candles will gradually change from a neutral color to a strong bullish color (as per the selected gradient).
Bearish Trend: Similarly, in a bearish trend, candles shift from neutral to a strong bearish color.
Neutral Market: If the trend is unclear, candles remain in a neutral color, signaling potential consolidation or indecision.
Inputs:
Gradient Sensitivity: Adjust the responsiveness of the color changes (higher values = less sensitivity).
Toggle Dynamic Gradient: Enable or disable the gradient coloring feature based on user preference.
2. VS Dynamic Replicator
Description:
The VS Dynamic Replicator replicates previous candles based on selected timeframes, projecting the future possible price movements. This component helps users predict price action by visually referencing past price behavior with adjustable offsets and line widths for better readability.
What It Does:
Candle Replication: Recreates a replica of the previous or selected timeframe candle on the chart with full customization of color and size.
Projected Price Levels: Visualizes important price levels (Open, High, Low, Close) with dotted lines extending into the future.
How to Use:
Choose Timeframe: Select the timeframe you want to replicate (e.g., daily, weekly).
Customizable Display: Adjust the offset, candle width, and line thickness to personalize the candle replication display.
Use Labels: Labels display the open, high, low, and close values, helping traders easily recognize critical price levels.
Inputs:
Candle Colors: Customize the colors for bullish and bearish replicated candles.
Timeframe Selection: Select the desired timeframe to replicate past candles.
Offset: Determine how far to project the replicated candle from the current price.
3. VS Sensitivity Buy/Sell
Description:
The VS Sensitivity Buy/Sell module generates buy and sell signals based on the crossover of moving averages. It allows traders to select sensitivity levels to determine the frequency and timing of the signals.
What It Does:
Sensitivity Settings: Offers three sensitivity levels—High, Medium, and Low—to adjust how quickly signals are generated.
Buy/Sell Signals: Signals are plotted as triangles above or below the price, indicating potential entry or exit points.
How to Use:
Adjust Sensitivity: Select High for more frequent signals or Low for fewer but more significant signals.
Monitor Signals: Buy signals are shown as green triangles below bars, while sell signals appear as red triangles above bars.
Inputs:
Sensitivity Levels: Choose between High, Medium, and Low to set the frequency of signals.
Toggle Buy/Sell Signals: Enable or disable the buy and sell signals based on your trading strategy.
4. VS Volatile Moving Averages (VMAs)
Description:
The VS Volatile Moving Averages (VMAs) feature is a set of volatility-adjusted moving averages that reflect market trends with customizable colors. Traders can use VMAs to identify trends across different time horizons (e.g., 20, 50, and 200 periods).
What It Does:
Volatility-Adjusted Averages: Displays three VMAs (20, 50, and 200) that adjust according to market volatility.
Color Coding: Each VMA is color-coded to indicate trend direction (bullish, bearish, or neutral).
Trend Confirmation: The color and slope of the VMAs confirm whether the trend is gaining strength or weakening.
How to Use:
Select VMAs: Choose which moving averages (e.g., VMA 20, 50, 200) to display on the chart.
Color Interpretation: Green indicates a bullish trend, red indicates a bearish trend, and yellow/neutral colors indicate indecision.
Overlay on Chart: The VMAs overlay on your price chart, providing a visual confirmation of trend direction.
Inputs:
Display VMAs: Toggle the display of VMAs on or off.
Adjust Fill Opacity: Modify the transparency of the VMA fill color for clarity on the chart.
Conclusion:
The VS TrendXpert Pro indicator is a robust and customizable tool that combines multiple trading methodologies into one cohesive package. By offering dynamic trend visualization, candle replication, sensitivity-based buy/sell signals, and volatility-driven moving averages, it provides a comprehensive approach to analyzing markets. Suitable for all trader levels, the indicator enhances market insight and helps users make more informed trading decisions.
xBrat SlingshotThe xBrat Slingshot Software is designed to identify measured Pull Backs during trends. The Software then identifies two different types of “with trend” trading signals and 1 “trend failure” signal (discussed further down the logic explanation). It is important to know that every pullback is NOT tradeable and a strong set of rules/logic must be used consistently to first measure the pullback. Then a set of repeatable rules/logic is used to identify trading signals when that pullback has found support or resistance within those measured pullback zones. The xBrat Slingshot Software does this all automatically using the following logic.
Long trade
If False Breakout Stochastics (Stoch) closes below 20%, and then closes above 80%, identify a swing low as the lowest price reached since the close below 20%.
When Stoch then closes back down below N%, the algorithm will identify a swing high as the highest price reached since the close above 80.
Behind the chart the software draws a fib retracement from swing low to swing high.
If price ever closed below the 61.8 at any time between the swing high bar and the bar that closed below N%, the software cancels the setup (and undraws pullback zone visuals).
Otherwise our software draws pullback zones at the following fib percentages that are commonly used when measuring pullbacks against a trend.
Pullback zone 1: 23.6-38.2 (default green, light opacity)
Pullback zone 2: 38.2-50 (default green, medium opacity)
Pullback zone 3: 50-61.8 (default green, dark opacity)
If price enters (either closes inside of or touches) a pullback zone and then closes above it without ever closing past (below) it, the setup is confirmed and fib extension targets are drawn (distance from high swing to end of the pullback, extended from the end of the pullback):
Target zone 1: 110-127 (default green, light opacity)
Target zone 2: 161-176 (default green, medium opacity)
Target zone 3: 262-286 (default green, dark opacity)
If price closes past (below) Pullback zone 3 before the setup is confirmed, cancel the setup (and undraw visuals).
Once target zones are drawn, the setup is confirmed and never undrawn.
Short trade
Reverse of the above long trade logic.
Pullback confirmation value: N%
Default zone colour: Red
Once the pullback zone is identified and sufficient initial Support or Resistance occurs within the pullback zones, they are locked along with the target Target Zones for the current move.
Then further confluences are used with our proprietary logic to identify 3 types of Trading Signals. Just because we have a pullback during a trend, doesn't mean we are going to get straight back to the trend. We have identified 2 special sets of confluences that occur in a predefined order to ensure the trend is being returned to with momentum.
These are the Type 1 and Type 2 Trading Signals Below. Then we have another set of circumstances/confluence for when a Trend Fails and traders need to be able to trade these. This is the 3rd type of Trade, a Type 3 below.
Type 1 Trade Signals - Trend Continuation - The following MUST occur within the 3 pullback zones. This signal uses Crosses of Fast and Slow EMA’s which denote the switch back for slingshot and the trend to resume in its original direction after a measured pullback. Then we apply our proprietary EMA cloud for moving out of the pull back zones as a final confirmation for the signal to be Printed.
Type 1 Buy Signals: Fast EMA (default period N, displacement 0) closes below the slow EMA (default period N, displacement N) while in a green pullback zone, and then the fast EMA closes back above the slow EMA without price ever breaking below the last pullback zone (green zones must still be printing). Draw a horizontal line N ticks for entry above the close of the confirmation bar and extend until the lower EMA cloud line breaks it – at which point the lower EMA cloud line is shown as trailing stop
Type 1 Sell Signals: Fast EMA (default period N, displacement 0) closes above the slow EMA (default period N, displacement N) while in a red pullback zone, and then the fast EMA closes back below the slow EMA without price ever breaking above the last pullback zone (red zones must still be printing). Draw a horizontal line N ticks below the close of the confirmation bar and extend until the upper EMA cloud line breaks it – at which point the upper EMA cloud line is shown as trailing stop.
These are the most common of the trading signals when price action follows all of our standard logic rules for a pullback and starts to return in the direction of the main trend after the measured pullback. The highest probability move is to Target 2.
Type 2 Trades - Trend Continuation - For this signal type the Fast and Slow EMA’s DO NOT Cross. BUT price action has to Enter our proprietary EMA cloud and close in the cloud. Then on a set “N” bars must move back out and close outside of the EMA Cloud back in the direction of the original trend. Again, All this must be done within the Pull back Zones.
Type 2 Buy Signal: A bar closes below the upper cloud line while in a green pullback zone, and then within N bars, a bar closes above the upper cloud line without ever breaking below the last pullback zone or the lower EMA Cloud line (green zones must still be printing). Draw a horizontal line N ticks above the close of this bar and extend until the lower EMA cloud line breaks it – at which point the lower EMA cloud line is shown as trailing stop.
Type 2 Sell Signal: A bar closes above the lower cloud line while in a red pullback zone, and then within N bars, a bar closes below the lower cloud line without ever breaking above the last pullback zone or upper EMA cloud line (red zones must still be printing). Draw a horizontal line N ticks below the close of this bar and extend until the upper cloud line breaks it – at which point the upper cloud line is shown as trailing stop.
These are Shallow pullbacks, but still hit the pullback zones. The price action in this instance returns to the direction of the main trend more quickly but still follows a different set of rules to that of Type 1 trades. The Highest Probability move is to target Two
Type 3 Trades - Trend failure - These are trend failure signals where the pullback zones are printed but the price action does not return to the main trend, BUT breaks the third pullback zone and breaks the slingshot rules for a Trend following trade setup. Our proprietary EMA Cloud positioning is then used to confirm and print the signal once the leading edge( direction dependent) moves out of the last pullback zone and we get a candle close with “N” percentage of the pull backs zone's depth.
Type 3 Buy Signal: A bar closes above the highest red pullback zone without pricing previously having ever touched the first red target zone for previous short with trend move. Draw a horizontal line N ticks above the close of the bar that broke the last zone and extend until the lower cloud line breaks it – at which point the lower cloud line is shown as a trailing stop.
Type 3 Sell Signal: A bar closes below the lowest green pullback zone without pricing having ever touched the previous first green target zone for previous long with trend move. Draw a horizontal line N ticks below the close of the bar that broke the last zone and extend until the upper cloud line breaks it – at which point the upper cloud line is shown as a trailing stop.
The Trailing Stop Line is also printed to help with trade management of these 3 different types of trades. This EMA trailing stop is adjustable.
This strategy is designed for Scalping, Day Trading and even Swing Trading. Works with Forex, Crypto, Futures and Stocks.
Envelop-Ama-VivekThe Adaptive Moving Average (AMA) is a type of moving average developed by Perry Kaufman, designed to adapt to the market's volatility. Unlike traditional moving averages that use fixed periods for smoothing, the AMA adjusts its sensitivity based on the market's noise and trends.
### Key Features of AMA:
1. **Adaptive Sensitivity:**
- The AMA responds more quickly to significant market movements while filtering out minor fluctuations. This is achieved by adjusting the smoothing constant dynamically.
- In trending markets, the AMA becomes more sensitive, allowing it to capture trends faster.
- In choppy or sideways markets, the AMA reduces its sensitivity, thus minimizing the impact of noise and avoiding false signals.
2. **Efficiency Ratio (ER):**
- The ER is a core component of the AMA. It measures the efficiency of price movement by comparing the net price change to the total price change over a given period.
- A higher ER indicates a strong trend, while a lower ER suggests more noise in the market.
3. **Smoothing Constant (SC):**
- The SC determines how much weight is given to the most recent price relative to the previous AMA value.
- The SC is dynamically adjusted based on the ER, with higher values used during strong trends and lower values during volatile or choppy periods.
### Applications of AMA:
- **Trend Detection:** The AMA is useful for identifying the start of a new trend or confirming an existing one, as it adjusts quickly to significant price movements.
- **Noise Reduction:** By adapting to market conditions, the AMA helps in filtering out market noise, making it easier to distinguish between genuine trends and short-term fluctuations.
- **Entry and Exit Signals:** Traders can use the AMA to generate buy and sell signals. For instance, when the price crosses above the AMA, it might indicate a buying opportunity, and when it crosses below, it might signal a selling opportunity.
### Benefits:
- **Adaptive Nature:** Its ability to adjust to market conditions makes the AMA more reliable in different market environments.
- **Reduced Lag:** Compared to traditional moving averages, the AMA reduces lag during trending markets, allowing for quicker responses to price movements.
### Drawbacks:
- **Complexity:** The calculation of the AMA is more complex compared to simple moving averages, which might make it less accessible to some traders.
- **Parameter Sensitivity:** The effectiveness of the AMA can vary depending on the chosen parameters (e.g., length, fast length, slow length), requiring careful tuning.
In summary, the AMA is a powerful tool for traders looking to capture trends while minimizing the impact of market noise. Its adaptive nature makes it suitable for various market conditions, providing a balance between responsiveness and noise reduction.
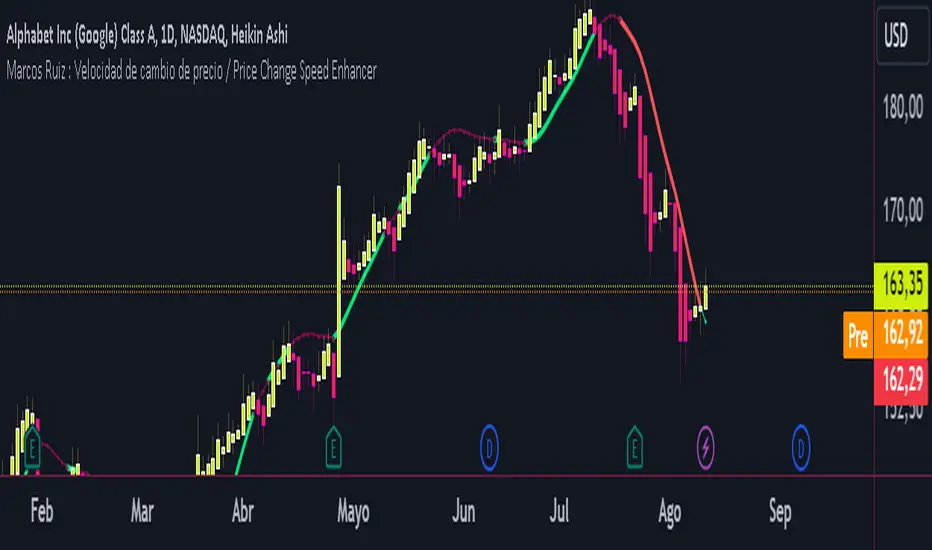
Marcos Ruiz :Price Change Speed Descripción:
Este indicador en Pine Script está diseñado para analizar y visualizar dinámicamente la velocidad de los cambios de precio en un gráfico de TradingView. El indicador permite a los usuarios seleccionar diferentes tipos de medias móviles y fuentes de precios para calcular y mostrar el cambio porcentual en el precio durante un período especificado
Características:
Selección de Fuente de Precio: Elige entre cierre, apertura, alto, o bajo para los cálculos de precios
Tipos de Media Móvil: Selecciona entre SMA, WMA, EMA, HMA, o VWMA para determinar la media móvil utilizada en el cálculo de la velocidad promedio
Coloreado Dinámico: El color de la línea de la media móvil cambia según la velocidad de cambio de precio
Aumento de Velocidad: Cuando la velocidad del cambio de precio está aumentando, la media móvil se colorea según upColor definido por el usuario
Disminución de Velocidad: Cuando la velocidad está disminuyendo, la media móvil se colorea según downColor definido por el usuario
Posición Neutral: Coloreado adicional para escenarios donde el precio está por encima o por debajo de la media móvil, pero no cumple con las condiciones de aumento/disminución
Factor de Refuerzo: Ajusta la sensibilidad del cálculo del cambio de velocidad
Uso:
Parámetros de Entrada:
Define el Período para establecer la ventana de retroceso para calcular la velocidad
Elige la Fuente de Precio para determinar qué datos de precios usar
Selecciona el Tipo de Media Móvil y ajusta la Longitud de EMA para la comparación
Interpretación:
El indicador traza la media móvil seleccionada con colores dinámicos basados en la velocidad calculada del cambio de precio
Los cambios positivos y negativos en la velocidad se indican con diferentes colores, proporcionando una representación visual del momento y la fuerza de la tendencia del precio
Nota: Este script es el resultado de un desarrollo y pruebas extensivas. Se agradecen mucho sus comentarios y contribuciones
Description:
This Pine Script indicator is designed to dynamically analyze and visualize the speed of price changes on a TradingView chart. The indicator allows users to select different moving average types and price sources to compute and display the percentage change in price over a specified period
Features:
Price Source Selection: Choose from close, open, high, or low for price calculations
Moving Average Types: Select from SMA, WMA, EMA, HMA, or VWMA to determine the moving average used for computing average speed
Dynamic Coloring: The moving average line's color changes based on the speed of price change
Increasing Speed: When the price change speed is increasing, the moving average is colored according to the user-defined upColor
Decreasing Speed: When the speed is decreasing, the moving average is colored according to the user-defined downColor
Neutral Position: Additional coloring for scenarios where the price is above or below the moving average but not meeting the increase/decrease conditions
Reinforcement Factor: Adjusts the sensitivity of the speed change calculation
Usage:
Input Parameters:
Set the Period to define the lookback window for calculating speed
Choose the Price Source to determine which price data to use
Select the Moving Average Type and adjust the EMA Length for comparison
Interpretation:
The indicator plots the selected moving average with dynamic colors based on the calculated speed of price change
Positive and negative changes in speed are indicated by different colors, providing a visual representation of price momentum and trend strength
Note: This script is the result of extensive development and testing. Your feedback and contributions are highly appreciated
Fibonacci-Only StrategyFibonacci-Only Strategy
This script is a custom trading strategy designed for traders who leverage Fibonacci retracement levels to identify potential trade entries and exits. The strategy is versatile, allowing users to trade across multiple timeframes, with built-in options for dynamic stop loss, trailing stops, and take profit levels.
Key Features:
Custom Fibonacci Levels:
This strategy calculates three specific Fibonacci retracement levels: 19%, 82.56%, and the reverse 19% level. These levels are used to identify potential areas of support and resistance where price reversals or breaks might occur.
The Fibonacci levels are calculated based on the highest and lowest prices within a 100-bar period, making them dynamic and responsive to recent market conditions.
Dynamic Entry Conditions:
Touch Entry: The script enters long or short positions when the price touches specific Fibonacci levels and confirms the move with a bullish (for long) or bearish (for short) candle.
Break Entry (Optional): If the "Use Break Strategy" option is enabled, the script can also enter positions when the price breaks through Fibonacci levels, providing more aggressive entry opportunities.
Stop Loss Management:
The script offers flexible stop loss settings. Users can choose between a fixed percentage stop loss or an ATR-based stop loss, which adjusts based on market volatility.
The ATR (Average True Range) stop loss is multiplied by a user-defined factor, allowing for tailored risk management based on market conditions.
Trailing Stop Mechanism:
The script includes an optional trailing stop feature, which adjusts the stop loss level as the market moves in favor of the trade. This helps lock in profits while allowing the trade to run if the trend continues.
The trailing stop is calculated as a percentage of the difference between the entry price and the current market price.
Multiple Take Profit Levels:
The strategy calculates seven take profit levels, each at incremental percentages above (for long trades) or below (for short trades) the entry price. This allows for gradual profit-taking as the market moves in the trade's favor.
Each take profit level can be customized in terms of the percentage of the position to be closed, providing precise control over exit strategies.
Strategy Backtesting and Results:
Realistic Backtesting:
The script has been backtested with realistic account sizes, commission rates, and slippage settings to ensure that the results are applicable to actual trading scenarios.
The backtesting covers various timeframes and markets to ensure the strategy's robustness across different trading environments.
Default Settings:
The script is published with default settings that have been optimized for general use. These settings include a 15-minute timeframe, a 1.0% stop loss, a 2.0 ATR multiplier for stop loss, and a 1.5% trailing stop.
Users can adjust these settings to better fit their specific trading style or the market they are trading.
How It Works:
Long Entry Conditions:
The strategy enters a long position when the price touches the 19% Fibonacci level (from high to low) or the reverse 19% level (from low to high) and confirms the move with a bullish candle.
If the "Use Break Strategy" option is enabled, the script will also enter a long position when the price breaks below the 19% Fibonacci level and then moves back up, confirming the break with a bullish candle.
Short Entry Conditions:
The strategy enters a short position when the price touches the 82.56% Fibonacci level and confirms the move with a bearish candle.
If the "Use Break Strategy" option is enabled, the script will also enter a short position when the price breaks above the 82.56% Fibonacci level and then moves back down, confirming the break with a bearish candle.
Stop Loss and Take Profit Logic:
The stop loss for each trade is calculated based on the selected method (fixed percentage or ATR-based). The strategy then manages the trade by either trailing the stop or taking profit at predefined levels.
The take profit levels are set at increments of 0.5% above or below the entry price, depending on whether the position is long or short. The script gradually exits the trade as these levels are hit, securing profits while minimizing risk.
Usage:
For Fibonacci Traders:
This script is ideal for traders who rely on Fibonacci retracement levels to find potential trade entries and exits. The script automates the process, allowing traders to focus on market analysis and decision-making.
For Trend and Swing Traders:
The strategy's flexibility in handling both touch and break entries makes it suitable for trend-following and swing trading strategies. The multiple take profit levels allow traders to capture profits in trending markets while managing risk.
Important Notes:
Originality: This script uniquely combines Fibonacci retracement levels with dynamic stop loss management and multiple take profit levels. It is not just a combination of existing indicators but a thoughtful integration designed to enhance trading performance.
Disclaimer: Trading involves risk, and it is crucial to test this script in a demo account or through backtesting before applying it to live trading. Users should ensure that the settings align with their individual risk tolerance and trading strategy.

Price Oscillator TR### Summary: How to Use the Price Oscillator with EMA Indicator
The **Price Oscillator with EMA** is a custom technical analysis tool designed to help traders identify potential buying and selling opportunities based on price momentum. Here's how to use it:
1. **Understanding the Oscillator**:
- The oscillator is calculated by normalizing the current price relative to the highest high and lowest low over a specified lookback period. It fluctuates between -70 and +70.
- When the oscillator is near +70, the price is close to the recent highs, indicating potential overbought conditions. Conversely, when it’s near -100, the price is close to recent lows, indicating potential oversold conditions.
2. **Exponential Moving Average (EMA)**:
- The indicator includes an EMA of the oscillator to smooth out price fluctuations and provide a clearer signal.
- The EMA helps to filter out noise and confirm trends.
3. **Trading Signals**:
- **Bullish Signal**: A potential buying opportunity is signaled when the oscillator crosses above its EMA. This suggests increasing upward momentum.
- **Bearish Signal**: A potential selling opportunity is signaled when the oscillator crosses below its EMA. This indicates increasing downward momentum.
4. **Visual Aids**:
- The indicator includes horizontal lines at +70, 0, and -70 to help you quickly assess overbought, neutral, and oversold conditions.
- The blue line represents the oscillator, while the orange line represents the EMA of the oscillator.
### How to Use:
- **Set your parameters**: Adjust the lookback period and EMA length to fit your trading strategy and time frame.
- **Watch for Crossovers**: Monitor when the oscillator crosses the EMA. A crossover from below to above suggests a buy, while a crossunder from above to below suggests a sell.
- **Confirm with Other Indicators**: For more reliable signals, consider using this indicator alongside other technical tools like volume analysis, trend lines, or support/resistance levels.
This indicator is ideal for traders looking to capture momentum-based trades in various market conditions.
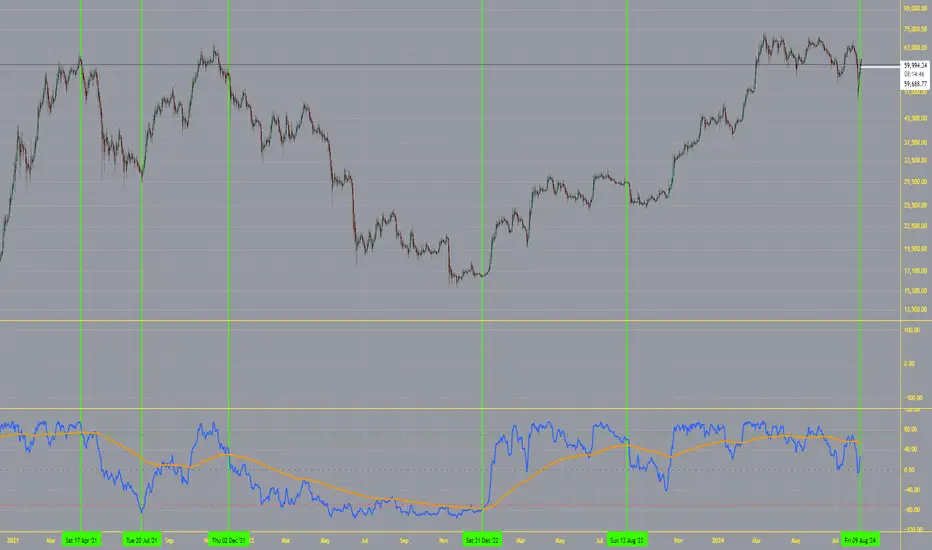
Butterfly Harmonic Pattern [TradingFinder] Harmonic Detector🔵 Introduction
The Butterfly Harmonic Pattern is a sophisticated and highly regarded tool in technical analysis, utilized by traders to identify potential reversal points in the financial markets. This pattern is distinguished by its reliance on Fibonacci ratios and geometric configurations, which aid in predicting price movements with remarkable precision.
The origin of the Butterfly Harmonic Pattern can be traced back to the pioneering work of Bryce Gilmore, who is credited with discovering this pattern. Gilmore's extensive research and expertise in Fibonacci ratios laid the groundwork for the identification and application of this pattern in technical analysis.
The Butterfly pattern, like other harmonic patterns, is based on the principle that market movements are not random but follow specific structures and ratios.
The pattern is characterized by a distinct "M" shape in bullish scenarios and a "W" shape in bearish scenarios, each indicating a potential reversal point. These formations are identified by specific Fibonacci retracement and extension levels, making the Butterfly pattern a powerful tool for traders seeking to capitalize on market turning points.
The precise nature of the Butterfly pattern allows for the accurate prediction of target prices and the establishment of strategic entry and exit points, making it an indispensable component of a trader's analytical arsenal.
Bullish :
Bearish :
🔵 How to Use
Like other harmonic patterns, the Butterfly pattern is categorized based on how it forms at the end of an uptrend or downtrend. Unlike the Gartley and Bat patterns, the Butterfly pattern, similar to the Crab pattern, forms outside the wave 3 range at the end of a rally.
🟣 Types of Butterfly Harmonic Patterns
🟣 Bullish Butterfly Pattern
This pattern forms at the end of a downtrend and leads to a trend reversal from a downtrend to an uptrend.
🟣 Bearish Butterfly Pattern
In contrast to the Bullish Butterfly pattern, this pattern forms at the end of an uptrend and warns analysts of a trend reversal to a downtrend. In this case, traders are encouraged to shift their trading stance from buy trades to sell trades.
Advantages and Limitations of the Butterfly Pattern in Technical Analysis :
The Butterfly pattern is considered one of the precise and stable tools in financial market analysis. However, it is always important to pay special attention to the advantages and limitations of each pattern.
Here, we review the advantages and disadvantages of using the Butterfly harmonic pattern :
The main advantage of the Butterfly pattern is providing very accurate signals.
Using Fibonacci golden ratios and geometric rules, the Butterfly pattern identifies patterns accurately and systematically. (This high accuracy significantly helps investors in making trading decisions.)
Identifying this pattern requires expertise and experience in technical analysis.
Recognizing the Butterfly pattern might be complex for beginner traders. (Correct identification of the pattern necessitates mastery over geometric principles and Fibonacci ratios.)
The Butterfly harmonic pattern might issue false trading signals. (Traders usually combine the Butterfly pattern with other technical tools to confirm buy and sell signals.)
🔵 Setting
🟣 Logical Setting
ZigZag Pivot Period : You can adjust the period so that the harmonic patterns are adjusted according to the pivot period you want. This factor is the most important parameter in pattern recognition.
Show Valid Forma t: If this parameter is on "On" mode, only patterns will be displayed that they have exact format and no noise can be seen in them. If "Off" is, the patterns displayed that maybe are noisy and do not exactly correspond to the original pattern.
Show Formation Last Pivot Confirm : if Turned on, you can see this ability of patterns when their last pivot is formed. If this feature is off, it will see the patterns as soon as they are formed. The advantage of this option being clear is less formation of fielded patterns, and it is accompanied by the latest pattern seeing and a sharp reduction in reward to risk.
Period of Formation Last Pivot : Using this parameter you can determine that the last pivot is based on Pivot period.
🟣 Genaral Setting
Show : Enter "On" to display the template and "Off" to not display the template.
Color : Enter the desired color to draw the pattern in this parameter.
LineWidth : You can enter the number 1 or numbers higher than one to adjust the thickness of the drawing lines. This number must be an integer and increases with increasing thickness.
LabelSize : You can adjust the size of the labels by using the "size.auto", "size.tiny", "size.smal", "size.normal", "size.large" or "size.huge" entries.
🟣 Alert Setting
Alert : On / Off
Message Frequency : This string parameter defines the announcement frequency. Choices include: "All" (activates the alert every time the function is called), "Once Per Bar" (activates the alert only on the first call within the bar), and "Once Per Bar Close" (the alert is activated only by a call at the last script execution of the real-time bar upon closing). The default setting is "Once per Bar".
Show Alert Time by Time Zone : The date, hour, and minute you receive in alert messages can be based on any time zone you choose. For example, if you want New York time, you should enter "UTC-4". This input is set to the time zone "UTC" by default.

Sylvain Zig-Zag [MyTradingCoder]This Pine Script version of ZigZagHighLow is a faithful port of Sylvain Vervoort's original study, initially implemented in NinjaScript and later added to the thinkorswim standard library. This indicator identifies and connects swing points in price data, offering a clear visualization of market moves that exceed a specified threshold. Additionally, it now includes features for detecting and plotting support and resistance levels, enhancing its utility for technical analysis.
Overview
The Sylvain Zig-Zag study excels at highlighting significant price swings by plotting points where the price change, combined with volatility adjustments via the Average True Range (ATR), exceeds a user-defined percentage. It effectively smooths out minor fluctuations, allowing traders to focus on the primary market trends. This tool is particularly useful in identifying potential turning points, trends in price movements, and key support and resistance levels, making it a valuable addition to your technical analysis arsenal.
How It Works
The Sylvain Zig-Zag indicator works by detecting swing points in the price data and connecting them to form a zigzag pattern. A swing point is identified when the price moves a certain distance, defined by a combination of percentage change and ATR. This distance must be exceeded for a swing point to be plotted.
When the price moves upwards and exceeds the previous high by a specified percentage plus a factor of the ATR, a new high swing point is plotted. Conversely, a low swing point is plotted when the price moves downwards and exceeds the previous low by the same criteria. This ensures that only significant price moves are considered, filtering out minor fluctuations and providing a clear view of the overall market trend.
In addition to plotting zigzag lines, the indicator can now identify and draw support and resistance levels based on the detected swing points. These levels are crucial for identifying potential reversal areas and market structure.
Key Features
Swing Point Detection: Accurately identifies significant price swings by considering both percentage price change and volatility (via Average True Range).
Dynamic Support/Resistance: Automatically generates support and resistance lines based on the identified swing points, providing potential areas of price reversals.
Customizable Parameters: Tailor the indicator's sensitivity to your preferred trading style and market conditions. Adjust parameters like percentage reversal, ATR settings, and absolute/tick reversals.
Visual Clarity: Choose to display the ZigZag line, support/resistance levels, new trend icons, continuation icons, and even customize bar colors for easy visual analysis.
Trading Applications
Trend Identification: Easily visualize the prevailing market trend using the direction of the ZigZag line and support/resistance levels.
Entry/Exit Signals: Potential entry points can be identified when the price interacts with the dynamic support/resistance levels.
Stop-Loss Placement: Use recent swing points as logical places for setting stop-loss orders.
Profit Targets: Project potential price targets based on the distance between previous swing points.
Input Parameters
Several input parameters can be adjusted to customize the behavior of the Sylvain Zig-Zag indicator. These parameters allow traders to fine-tune the detection of swing points and support/resistance levels to better suit their trading strategy and the specific market conditions they are analyzing.
High Source and Low Source:
These inputs define the price points used for detecting high and low swing points, respectively. You can choose between high, low, open, or close prices for these calculations.
Percentage Reversal:
This input sets the minimum percentage change in price required for a swing to be detected. A higher percentage value will result in fewer but more significant swing points, while a lower value will detect more frequent, smaller swings.
Absolute Reversal:
This parameter allows for an additional fixed value to be added to the minimum price change and ATR change. This can be useful for increasing the distance between swing points in volatile markets.
ATR Length:
This input defines the period used for calculating the ATR, which is a measure of market volatility. A longer ATR period will smooth out the ATR calculation, while a shorter period will make it more sensitive to recent price changes.
ATR Multiplier:
This factor is applied to the ATR value to adjust the sensitivity of the swing point detection. A higher multiplier will increase the required price movement for a swing point to be plotted, reducing the number of detected swings.
Tick Reversal:
This input allows for an additional value in ticks to be added to the minimum price change and ATR change, providing further customization in the swing point detection process.
Support and Resistance:
Show S/R: Enable or disable the plotting of support and resistance levels.
Max S/R Levels: Set the maximum number of support and resistance levels to display.
S/R Line Width: Adjust the width of the support and resistance lines.
Visual Settings
The Sylvain Zig-Zag indicator also includes visual settings to enhance the clarity of the plotted swing points and trends. You can customize the color and width of the zigzag line, and enable icons to indicate new trends and continuation patterns. Additionally, the bars can be colored based on the detected trend, aiding in quick visual analysis.
Conclusion
This port of the ZigZagHighLow study from NinjaScript to Pine Script preserves the essence of Sylvain Vervoort’s methodology while adding new features for support and resistance. It provides traders with a powerful tool for technical analysis. The combination of price changes and ATR ensures that you have a robust and adaptable tool for identifying key market movements and structural levels. Customize the settings to match your trading style and gain a clearer picture of market trends, turning points, and support/resistance areas. Enjoy improved market analysis and more informed trading decisions with the Sylvain Zig-Zag indicator.

Price & Momentum Reversal Indicator [TradeDots]Price & Momentum Divergence Indicator is a variant of the Chande Momentum Oscillator (CMO), designed to identify reversal patterns in overvalued and undervalued markets. This indicator aims to mitigate the common problem of all oscillating indicators: false buy/sell signals during prolonged market trends, by incorporating a volume-weighted approach and momentum analysis.
📝 HOW IT WORKS
Price Extremeness Calculation
The indicator evaluates the extremeness of the current price by analyzing price changes over a fixed window of candlesticks.
It separates the price changes into positive and negative changes, then multiplies them by the bar volume to obtain volume-weighted values, giving higher significance to bars with larger volumes.
Extremeness Ratio
The ratio is calculated by taking the difference between the total positive changes and total negative changes, and then dividing this result by the sum of the total positive and negative changes.
The result is then smoothed to reduce market noise and rescaled to a range between -100 to 100, where 100 indicates all price changes within the window are positive.
Momentum Analysis
Momentum is calculated by measuring the rate of change of the smoothed extremeness ratio, indicating whether market extremeness is slowing and showing signs of reversion.
Reversal Signal Confirmation
For an asset to be considered a reversal, it has to be in the overvalued or undervalued zone (exceeding the overvalued & undervalued threshold). It must then show a slowed momentum change and a price reversion.
Lastly, candlestick analysis is used to confirm the reversal signal, ensuring there is no room for further breakout price movement.
🛠️ HOW TO USE
Candlestick Visualization
Candlestick bodies are painted with gradient colors representing the smoothed price extremeness (OBOS Index), ranging from -100 (solid red) to 100 (solid green). The exact value is displayed in a table at the bottom right corner.
Slowing price momentum is indicated with blue (bearish) and purple (bullish) colors, showing market pressure from the opposite side.
Reversal Confirmation
A decrease in price momentum combined with a price reversal triggers a signal label on the candlestick, indicating a potential pullback or reversal. This can serve as a reference for better entry and exit points.
⭐️ Premium Features
Higher Timeframe (HTF) Analysis
The indicator includes a feature to apply the same algorithm to a selected higher timeframe, ensuring trend alignment across multiple timeframes.
Alert Functions
Real-time notifications for overvalued and undervalued conditions, allowing traders to monitor trades and reversal signals anywhere and anytime.
❗️LIMITATIONS
Accuracy decreases in volatile and noisy markets.
Extended bullish or bearish market conditions may affect performance.
See Author's instructions below to get instant access to this indicator.
RISK DISCLAIMER
Trading entails substantial risk, and most day traders incur losses. All content, tools, scripts, articles, and education provided by TradeDots serve purely informational and educational purposes. Past performances are not definitive predictors of future results.
All Chart Patterns [theEccentricTrader]█ OVERVIEW
This indicator automatically draws and sends alerts for all of the chart patterns in my public library as they occur. The patterns included are as follows:
• Ascending Broadening
• Broadening
• Descending Broadening
• Double Bottom
• Double Top
• Triple Bottom
• Triple Top
• Bearish Elliot Wave
• Bullish Elliot Wave
• Bearish Alternate Flag
• Bullish Alternate Flag
• Bearish Flag
• Bullish Flag
• Bearish Ascending Head and Shoulders
• Bullish Ascending Head and Shoulders
• Bearish Descending Head and Shoulders
• Bullish Descending Head and Shoulders
• Bearish Head and Shoulders
• Bullish Head and Shoulders
• Bearish Pennant
• Bullish Pennant
• Ascending Wedge
• Descending Wedge
• Wedge
█ CONCEPTS
Green and Red Candles
• A green candle is one that closes with a close price equal to or above the price it opened.
• A red candle is one that closes with a close price that is lower than the price it opened.
Swing Highs and Swing Lows
• A swing high is a green candle or series of consecutive green candles followed by a single red candle to complete the swing and form the peak.
• A swing low is a red candle or series of consecutive red candles followed by a single green candle to complete the swing and form the trough.
Peak and Trough Prices
• The peak price of a complete swing high is the high price of either the red candle that completes the swing high or the high price of the preceding green candle, depending on which is higher.
• The trough price of a complete swing low is the low price of either the green candle that completes the swing low or the low price of the preceding red candle, depending on which is lower.
Historic Peaks and Troughs
The current, or most recent, peak and trough occurrences are referred to as occurrence zero. Previous peak and trough occurrences are referred to as historic and ordered numerically from right to left, with the most recent historic peak and trough occurrences being occurrence one.
Upper Trends
• A return line uptrend is formed when the current peak price is higher than the preceding peak price.
• A downtrend is formed when the current peak price is lower than the preceding peak price.
• A double-top is formed when the current peak price is equal to the preceding peak price.
Lower Trends
• An uptrend is formed when the current trough price is higher than the preceding trough price.
• A return line downtrend is formed when the current trough price is lower than the preceding trough price.
• A double-bottom is formed when the current trough price is equal to the preceding trough price.
Range
The range is simply the difference between the current peak and current trough prices, generally expressed in terms of points or pips.
Retracement and Extension Ratios
Retracement and extension ratios are calculated by dividing the current range by the preceding range and multiplying the answer by 100. Retracement ratios are those that are equal to or below 100% of the preceding range and extension ratios are those that are above 100% of the preceding range.
Measurement Tolerances
Tolerance refers to the allowable variation or deviation from a specific value or dimension. It is the range within which a particular measurement is considered to be acceptable or accurate. I have applied this concept in my pattern detection logic and have set default tolerances where applicable, as perfect patterns are, needless to say, very rare.
Chart Patterns
Generally speaking price charts are nothing more than a series of swing highs and swing lows. When demand outweighs supply over a period of time prices swing higher and when supply outweighs demand over a period of time prices swing lower. These swing highs and swing lows can form patterns that offer insight into the prevailing supply and demand dynamics at play at the relevant moment in time.
‘Let us assume… that you the reader, are not a member of that mysterious inner circle known to the boardrooms as “the insiders”… But it is fairly certain that there are not nearly so many “insiders” as amateur trader supposes and… It is even more certain that insiders can be wrong… Any success they have, however, can be accomplished only by buying and selling… hey can do neither without altering the delicate poise of supply and demand that governs prices. Whatever they do is sooner or later reflected on the charts where you… can detect it. Or detect, at least, the way in which the supply-demand equation is being affected… So, you do not need to be an insider to ride with them frequently… prices move in trends. Some of those trends are straight, some are curved; some are brief and some are long and continued… produced in a series of action and reaction waves of great uniformity. Sooner or later, these trends change direction; they may reverse (as from up to down), or they may be interrupted by some sort of sideways movement and then, after a time, proceed again in their former direction… when a price trend is in the process of reversal… a characteristic area or pattern takes shape on the chart, which becomes recognisable as a reversal formation… Needless to say, the first and most important task of the technical chart analyst is to learn to know the important reversal formations and to judge what they may signify in terms of trading opportunities’ (Edwards & Magee, 1948).
This is as true today as it was when Edwards and Magee were writing in the first half of the last Century, study your patterns and make judgements for yourself about what their implications truly are on the markets and timeframes you are interested in trading.
Over the years, traders have come to discover a multitude of chart and candlestick patterns that are supposed to pertain information on future price movements. However, it is never so clear cut in practice and patterns that where once considered to be reversal patterns are now considered to be continuation patterns and vice versa. Bullish patterns can have bearish implications and bearish patterns can have bullish implications. As such, I would highly encourage you to do your own backtesting.
There is no denying that chart patterns exist, but their implications will vary from market to market and timeframe to timeframe. So it is down to you as an individual to study them and make decisions about how they may be used in a strategic sense.
█ INPUTS
• Change pattern and label colours
• Show or hide patterns individually
• Adjust pattern ratios and tolerances
• Set or remove alerts for individual patterns
█ NOTES
I have decided to rename some of my previously published patterns based on the way in which the pattern completes. If the pattern completes on a swing high then the pattern is considered bearish, if the pattern completes on a swing low then it is considered bullish. This may seem confusing but it makes sense when you come to backtesting the patterns and want to use the most recent peak or trough prices as stop losses. Patterns that can complete on both a swing high and swing low are for such reasons treated as neutral, namely all broadening and wedge variations. I trust that it is quite self-evident that double and triple bottom patterns are considered bullish while double and triple top patterns are considered bearish, so I did not feel the need to rename those.
The patterns that have been renamed and what they have been renamed to, are as follows:
• Ascending Elliot Waves to Bearish Elliot Waves
• Descending Elliot Waves to Bullish Elliot Waves
• Ascending Head and Shoulders to Bearish Ascending Head and Shoulders
• Descending Head and Shoulders to Bearish Descending Head and Shoulders
• Head and Shoulders to Bearish Head and Shoulders
• Ascending Inverse Head and Shoulders to Bullish Ascending Head and Shoulders
• Descending Inverse Head and Shoulders to Bullish Descending Head and Shoulders
• Inverse Head and Shoulders to Bullish Head and Shoulders
You can test the patterns with your own strategies manually by applying the indicator to your chart while in bar replay mode and playing through the history. You could also automate this process with PineScript by using the conditions from my swing and pattern libraries as entry conditions in the strategy tester or your own custom made strategy screener.
█ LIMITATIONS
All green and red candle calculations are based on differences between open and close prices, as such I have made no attempt to account for green candles that gap lower and close below the close price of the preceding candle, or red candles that gap higher and close above the close price of the preceding candle. This may cause some unexpected behaviour on some markets and timeframes. I can only recommend using 24-hour markets, if and where possible, as there are far fewer gaps and, generally, more data to work with.
█ SOURCES
Edwards, R., & Magee, J. (1948) Technical Analysis of Stock Trends (10th edn). Reprint, Boca Raton, Florida: Taylor and Francis Group, CRC Press: 2013.

Boost Candle Indicator by JulianThe Boost Candle Trading Indicator is designed to identify significant price movements by calculating the average candle size for the same direction candles (green for bullish and red for bearish) over a specified number of periods. It then highlights candles that exceed a predefined multiple of this average size, indicating potential strong buying or selling pressure.
Key Features:
Directional Average Calculation: Calculates the average size of the previous candles in the same direction (green for buy signals and red for sell signals), ensuring the boost signal is contextually relevant.
Boost Multiplier: Allows customization of the multiplier to define what constitutes a boost candle, providing flexibility in detecting varying levels of price movement intensity.
Proximity to Moving Average: Integrates a proximity check to the moving average (MA), ensuring that boost candles are identified in context with the overall market trend.
Buy and Sell Signals:
Buy Signal: Triggered when a significant green boost candle appears below the moving average and closes above it, indicating a strong bullish movement.
Sell Signal: Triggered when a significant red boost candle appears above the moving average and closes below it, indicating a strong bearish movement.
Customizable Inputs:
Moving Average Length: Adjust the length of the moving average to suit different trading strategies.
Number of Periods for Average Candle Size: Define the lookback period for calculating the average candle size.
Boost Multiplier and Proximity Tolerance: Fine-tune the sensitivity of the indicator to suit different market conditions.
How to Use:
Buy Signals: Look for green labels ("B") below significant bullish candles, indicating a potential upward price movement.
Sell Signals: Look for red labels ("S") above significant bearish candles, indicating a potential downward price movement.
Proximity to Moving Average: Use the proximity tolerance setting to filter out signals that are not closely aligned with the moving average trend.
This indicator is ideal for traders looking to identify strong market movements and align their trades with significant price actions. Customize the settings to fit your trading style and enhance your market analysis.

Harmonic Patterns Library [TradingFinder]🔵 Introduction
Harmonic patterns blend geometric shapes with Fibonacci numbers, making these numbers fundamental to understanding the patterns.
One person who has done a lot of research on harmonic patterns is Scott Carney.Scott Carney's research on harmonic patterns in technical analysis focuses on precise price structures based on Fibonacci ratios to identify market reversals.
Key patterns include the Gartley, Bat, Butterfly, and Crab, each with specific alignment criteria. These patterns help traders anticipate potential market turning points and make informed trading decisions, enhancing the predictability of technical analysis.
🟣 Understanding 5-Point Harmonic Patterns
In the current library version, you can easily draw and customize most XABCD patterns. These patterns often form M or W shapes, or a combination of both. By calculating the Fibonacci ratios between key points, you can estimate potential price movements.
All five-point patterns share a similar structure, differing only in line lengths and Fibonacci ratios. Learning one pattern simplifies understanding others.
🟣 Exploring the Gartley Pattern
The Gartley pattern appears in both bullish (M shape) and bearish (W shape) forms. In the bullish Gartley, point X is below point D, and point A surpasses point C. Point D marks the start of a strong upward trend, making it an optimal point to place a buy order.
The bearish Gartley mirrors the bullish pattern with inverted Fibonacci ratios. In this scenario, point D indicates the start of a significant price drop. Traders can place sell orders at this point and buy at lower prices for profit in two-way markets.
🟣 Analyzing the Butterfly Pattern
The Butterfly pattern also manifests in bullish (M shape) and bearish (W shape) forms. It resembles the Gartley pattern but with point D lower than point X in the bullish version.
The Butterfly pattern involves deeper price corrections than the Gartley, leading to more significant price fluctuations. Point D in the bullish Butterfly indicates the beginning of a sharp price rise, making it an entry point for buy orders.
The bearish Butterfly has inverted Fibonacci ratios, with point D marking the start of a sharp price decline, ideal for sell orders followed by buying at lower prices in two-way markets.
🟣 Insights into the Bat Pattern
The Bat pattern, appearing in bullish (M shape) and bearish (W shape) forms, is one of the most precise harmonic patterns. It closely resembles the Butterfly and Gartley patterns, differing mainly in Fibonacci levels.
The bearish Bat pattern shares the Fibonacci ratios with the bullish Bat, with an inverted structure. Point D in the bearish Bat marks the start of a significant price drop, suitable for sell orders followed by buying at lower prices for profit.
🟣 The Crab Pattern Explained
The Crab pattern, found in both bullish (M shape) and bearish (W shape) forms, is highly favored by analysts. Discovered in 2000, the Crab pattern features a larger final wave correction compared to other harmonic patterns.
The bearish Crab shares Fibonacci ratios with the bullish version but in an inverted form. Point D in the bearish Crab signifies the start of a sharp price decline, making it an ideal point for sell orders followed by buying at lower prices for profitable trades.
🟣 Understanding the Shark Pattern
The Shark pattern appears in bullish (M shape) and bearish (W shape) forms. It differs from previous patterns as point C in the bullish Shark surpasses point A, with unique level measurements.
The bearish Shark pattern mirrors the Fibonacci ratios of the bullish Shark but is inverted. Point D in the bearish Shark indicates the start of a sharp price drop, ideal for placing sell orders and buying at lower prices to capitalize on the pattern.
🟣 The Cypher Pattern Overview
The Cypher pattern is another that appears in both bullish (M shape) and bearish (W shape) forms. It resembles the Shark pattern, with point C in the bullish Cypher extending beyond point A, and point D forming within the XA line.
The bearish Cypher shares the Fibonacci ratios with the bullish Cypher but in an inverted structure. Point D in the bearish Cypher marks the start of a significant price drop, perfect for sell orders followed by buying at lower prices.
🟣 Introducing the Nen-Star Pattern
The Nen-Star pattern appears in both bullish (M shape) and bearish (W shape) forms. In the bullish Nen-Star, point C extends beyond point A, and point D, the final point, forms outside the XA line, making CD the longest wave.
The bearish Nen-Star has inverted Fibonacci ratios, with point D indicating the start of a significant price drop. Traders can place sell orders at point D and buy at lower prices to profit from this pattern in two-way markets.
The 5-point harmonic patterns, commonly referred to as XABCD patterns, are specific geometric price structures identified in financial markets. These patterns are used by traders to predict potential price movements based on historical price data and Fibonacci retracement levels.
Here are the main 5-point harmonic patterns :
Gartley Pattern
Anti-Gartley Pattern
Bat Pattern
Anti-Bat Pattern
Alternate Bat Pattern
Butterfly Pattern
Anti-Butterfly Pattern
Crab Pattern
Anti-Crab Pattern
Deep Crab Pattern
Shark Pattern
Anti- Shark Pattern
Anti Alternate Shark Pattern
Cypher Pattern
Anti-Cypher Pattern
🔵 How to Use
To add "Order Block Refiner Library", you must first add the following code to your script.
import TFlab/Harmonic_Chart_Pattern_Library_TradingFinder/1 as HP
🟣 Parameters
XABCD(Name, Type, Show, Color, LineWidth, LabelSize, ShVF, FLPC, FLPCPeriod, Pivot, ABXAmin, ABXAmax, BCABmin, BCABmax, CDBCmin, CDBCmax, CDXAmin, CDXAmax) =>
Parameters:
Name (string)
Type (string)
Show (bool)
Color (color)
LineWidth (int)
LabelSize (string)
ShVF (bool)
FLPC (bool)
FLPCPeriod (int)
Pivot (int)
ABXAmin (float)
ABXAmax (float)
BCABmin (float)
BCABmax (float)
CDBCmin (float)
CDBCmax (float)
CDXAmin (float)
CDXAmax (float)
🟣 Genaral Parameters
Name : The name of the pattern.
Type: Enter "Bullish" to draw a Bullish pattern and "Bearish" to draw an Bearish pattern.
Show : Enter "true" to display the template and "false" to not display the template.
Color : Enter the desired color to draw the pattern in this parameter.
LineWidth : You can enter the number 1 or numbers higher than one to adjust the thickness of the drawing lines. This number must be an integer and increases with increasing thickness.
LabelSize : You can adjust the size of the labels by using the "size.auto", "size.tiny", "size.smal", "size.normal", "size.large" or "size.huge" entries.
🟣 Logical Parameters
ShVF : If this parameter is on "true" mode, only patterns will be displayed that they have exact format and no noise can be seen in them. If "false" is, the patterns displayed that maybe are noisy and do not exactly correspond to the original pattern.
FLPC : if Turned on, you can see this ability of patterns when their last pivot is formed. If this feature is off, it will see the patterns as soon as they are formed. The advantage of this option being clear is less formation of fielded patterns, and it is accompanied by the lateest pattern seeing and a sharp reduction in reward to risk.
FLPCPeriod : Using this parameter you can determine that the last pivot is based on Pivot period.
Pivot : You need to determine the period of the zigzag indicator. This factor is the most important parameter in pattern recognition.
ABXAmin : Minimum retracement of "AB" line compared to "XA" line.
ABXAmax : Maximum retracement of "AB" line compared to "XA" line.
BCABmin : Minimum retracement of "BC" line compared to "AB" line.
BCABmax : Maximum retracement of "BC" line compared to "AB" line.
CDBCmin : Minimum retracement of "CD" line compared to "BC" line.
CDBCmax : Maximum retracement of "CD" line compared to "BC" line.
CDXAmin : Minimum retracement of "CD" line compared to "XA" line.
CDXAmax : Maximum retracement of "CD" line compared to "XA" line.
🟣 Function Outputs
This library has two outputs. The first output is related to the alert of the formation of a new pattern. And the second output is related to the formation of the candlestick pattern and you can draw it using the "plotshape" tool.
Candle Confirmation Logic :
Example :
import TFlab/Harmonic_Chart_Pattern_Library_TradingFinder/1 as HP
PP = input.int(3, 'ZigZag Pivot Period')
ShowBull = input.bool(true, 'Show Bullish Pattern')
ShowBear = input.bool(true, 'Show Bearish Pattern')
ColorBull = input.color(#0609bb, 'Color Bullish Pattern')
ColorBear = input.color(#0609bb, 'Color Bearish Pattern')
LineWidth = input.int(1 , 'Width Line')
LabelSize = input.string(size.small , 'Label size' , options = )
ShVF = input.bool(false , 'Show Valid Format')
FLPC = input.bool(false , 'Show Formation Last Pivot Confirm')
FLPCPeriod =input.int(2, 'Period of Formation Last Pivot')
//Call function
= HP.XABCD('Bullish Bat', 'Bullish', ShowBull, ColorBull , LineWidth, LabelSize ,ShVF, FLPC, FLPCPeriod, PP, 0.382, 0.50, 0.382, 0.886, 1.618, 2.618, 0.85, 0.9)
= HP.XABCD('Bearish Bat', 'Bearish', ShowBear, ColorBear , LineWidth, LabelSize ,ShVF, FLPC, FLPCPeriod, PP, 0.382, 0.50, 0.382, 0.886, 1.618, 2.618, 0.85, 0.9)
//Alert
if BearAlert
alert('Bearish Harmonic')
if BullAlert
alert('Bulish Harmonic')
//CandleStick Confirm
plotshape(BearCandleConfirm, style = shape.arrowdown, color = color.red)
plotshape(BullCandleConfirm, style = shape.arrowup, color = color.green, location = location.belowbar )
