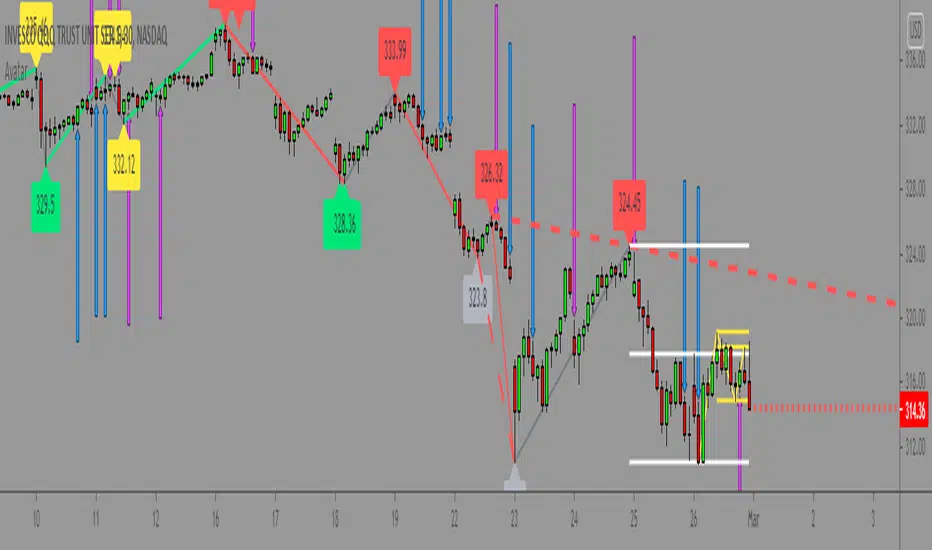
Master000 automation trade indicatorIndicator description:
The Master000 indicator is four indicators built into one. They work together to provide trading insights including trend and momentum, reversal points, potential entry points, and projections of future reversal or breakout levels.
Trend power
Shows strength of trend and a change in momentum
Red: The trend has been determined and is short
Lime: The trend has been determined and is long
Aqua: Continuation of the down trend, but showing down trend is in weakness.
Fuchsia: Continuation of the up trend, but showing up trend is in weakness
Yellow: Trend is reversing or trend is missing direction
Zig Zag Trend Lines (Major/Minor )
Major
The trend is graphed based on changes in price. The major trend should be used in deciding which way to enter the trade.
Min or
The minor trend is similar to the major but it is used to determine your entry point. It is easy to spot higher highs or lower lows. Take not when the minor trend fails to set a new high or a new low.
Channels
These dotted lines are provided as a quick guide to determine where the trend is headed. They show if price is getting squeezed and we should look for a break out using a flag or pennant pattern or is there an ever widening channel creating a broadening wedge. Look for hesitation or a reversal near the channel lines.
Entry Signals
Should be taken as a suggestion and not taken everyone. Do your research before entering any trade. There could also be many profitable trades even when an entry signal was not given.
Not good now, just reference for you.
Strategies for using the indicator
Major and minor trendlines: Once major trendline has been set look for a pullback for an entry. Look for a reversal in the major trendline when the minor trendline fails to create a higher high or lower low.
Trend Power: Look for an optimal entry point when the trend power turns teal. This mean the trend is reversing and should be an optimal place for an entry going against the previous trend.
Indicator Explain video at YouTube:
youtu.be
Anyone can apply to use it, you will get two weeks for testing it. [/b
Just click 'like', when I get the message, I will add you as 'invite only' indicator.
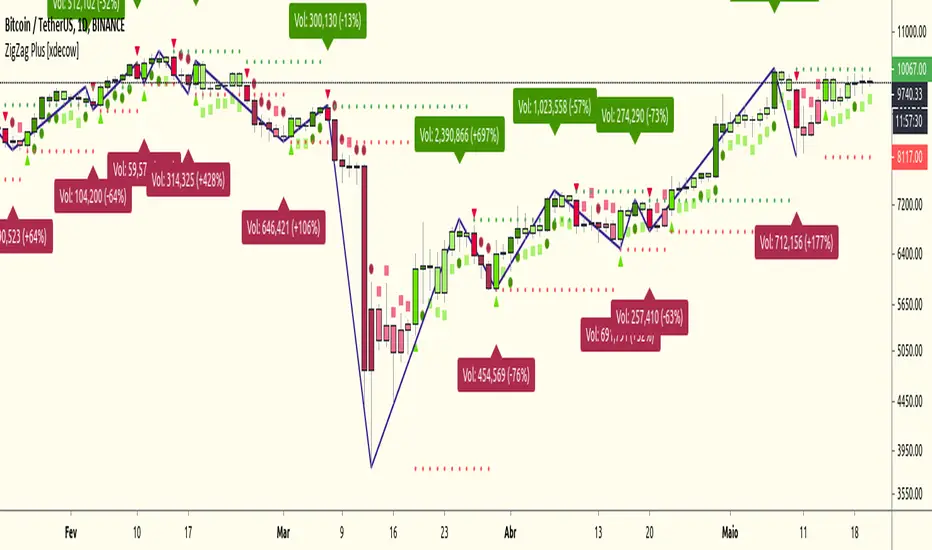
波浪分析
ZigZag Plus [xdecow]A ZigZag Like based on candle close.
A lot of options that can be hide in options.
Triangle/bright - reversal confirmation candle
Circle/dark - higher/lower candle breakout
Square/light - Insidebar
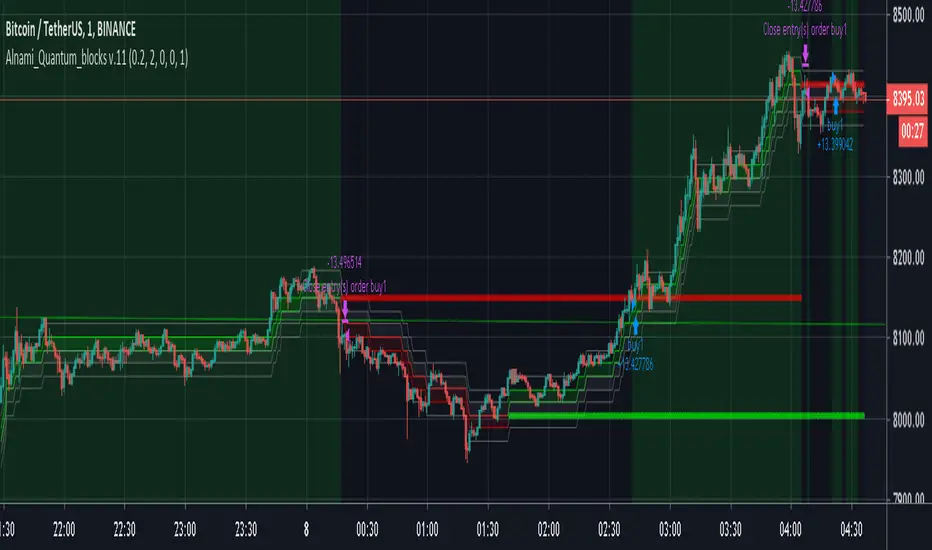
Alnami_Quantum_blocks v.11The (Al Nami Quantum Blocks v.11) script is based on Renko chart that is based on % move of the selected symbol. This is different from the traditional or ATR based Renko charts..
box size = user selected percentage x current price
Alnami Quantum Blocks Channel is composed of 5 levels that are calculated based on the box size:
1- Base
2- Green Box High (GBH) = Base + box size
3- Next Green Box trigger (GBN) = base + (box size x 2)
4- Red Box Low ( RBL ) = Base - box size
5- Next Red Box trigger ( RBN ) = base - (box size x 2)
Those levels will appear in the chart with the following order:
------GBN-------
------GBH-------
------BASE------
------RBL-------
------RBN-------
Usually when prices are trending up, the price will stay above the base for most of the time,, when it trending downwards, price stays below base most of the time..
Now how to time your entries based on the channel?
This strategy draws two levels, breakout level (top red line) and stop level (bottom green line).
If the price is above red line, place a buy order
If the price is below the green line, place a sell order
In version 11 of the Quantum blocks, you can choose to make the those two lines drawn using:
recent/near term price actions (less accurate) and fast - set the number of Legs to low value
or
wider term price actions (more accurate) and slow - set the number of Legs to high value
This version also tracks the last three changes for the red and green lines as following:
1- Above, Above, Above = 3
2- Above, Above, Below = 2
3- Above, Below, Below = 1
4- Below, Below, Below = 0
I did run full optimization for the settings of this strategy on Bitcoin (Binance:BTCUSDT) for the following multiple time frames using Amibroker scrips and data downloaded from Binance through a REST API call. The TFs were for 1min, 15min, 30min, 45min, 90min, 120min, 180min, and 240min.
pair Input Settings
btc TF Profit% Sys DD% Trade DD% sharpe% # Trades Win% Wave% # of Legs up lo
1 204 40.16 15.04 1.33 132 40.15 1.5 4 3 3
15 249 35 14.3 2.96 35 51.43 1.8 3 1 3
30 469 28.95 14.04 3.82 34 67.65 1.4 3 1 3
45 712 54.48 23.3 2.49 46 54.35 1.7 3 3 3
90 1114 40.51 21.41 3.3 48 54.17 1.4 2 3 3
120 602 25.32 16.8 2.82 51 43.14 1.2 2 3 3
180 960 35.9 20.09 3.33 42 52.38 0.9 2 2 3
240 819 46.84 28.27 3.48 46 65.22 0.6 2 3 3
I spent a lot of time and resource in providing the above, If this script/back tests helped in making some profits, then kindly express your appreciation and support to this work by sending some altcoins to any of the following wallets, this will encourage me sharing more stuff with the public:
BTC : 15VLCLZRkEhhZn6E4gNjMLVYnmCcUzKvWU
LTC : LN6mE6aZhEqVVfssmaQ3kk8PPspWQ5wToy
ETH : 0x7901035f2b6f334fa404d0ceb187d7bfcfdb72ce
Straightened Price CurveThis is another among zillions of attempts at a moving average of a security. More precisely, two attempts at one go). The zzoid function generates a zigzag-like MA that can adopt different forms. The stepline function creates, sure enough, a stepline.

Voss Predictive Filter█ OVERVIEW
The Voss Predictive Filter (VPF) is a negative group delay (NGD) filter that anticipates cyclical price movement through phase compensation. The VPF isolates band-limited cyclical components via a bandpass filter, then applies negative group delay to shift the signal's phase forward, causing the output to lead the input by a fraction of the cycle period.
Based on Dr. John F. Ehlers' "Voss Predictive Filter" article in Technical Analysis of Stocks & Commodities (TASC) magazine, the VPF displays a predictive oscillator with optional dynamic threshold bands for identifying significant cycle behavior. The indicator is timeframe-agnostic - the mathematics work identically from tick charts to monthly bars, though shorter timeframes require more careful parameter selection due to noise.
█ CONCEPTS
Bandpass Filtering
A bandpass filter isolates price activity within a specific frequency range, removing both high-frequency noise and low-frequency trend drift. The VPF uses a second-order IIR (Infinite Impulse Response) bandpass filter characterized by the center frequency (the Bandpass Period input) and bandwidth. The center frequency determines which cycle period the filter emphasizes, while bandwidth controls the damping coefficient - how tightly the filter focuses around that frequency. Before filtering, the source is debiased via 2-bar momentum to remove DC offset, ensuring the filter operates around a true zero centerline.
Negative Group Delay Filtering
The predictive capability stems from negative group delay (NGD) - a filter characteristic where output appears to "lead" the input. Most causal filters introduce lag (positive group delay), but by combining the bandpass filter output with appropriately weighted past values, the VPF achieves negative group delay characteristics.
This is a universal NGD filter application for band-limited signals: the bandpass filter isolates the cyclical component of interest, then the NGD stage advances the phase within this limited frequency range to create an anticipatory output. This isn't statistical forecasting; it's phase compensation that shifts the signal's timing forward, causing peaks and troughs to appear before they occur in the bandpass output.
Negative Group Delay Stage
The NGD stage combines the current bandpass output with weighted historical values to produce an output that leads the input. By subtracting a weighted average of past deviations from a scaled version of the current filter value, the algorithm advances the signal's phase: peaks and zero-crossings in the voss output appear before the corresponding events in the bandpass filter.
The prediction order (`3 * Prediction Multiplier`) controls how many past values contribute to the phase advance. Higher orders provide smoother output but reduce the leading effect; lower orders maximize anticipation at the cost of stability.
█ INTERPRETATION
Zero-Line Crossovers
Crossings above zero suggest bullish momentum in the filtered cycle; below zero suggests bearish momentum. Crossings from near-zero regions are most reliable, as extreme excursions need time to return to equilibrium.
Threshold Bands
Threshold bands define "significant" deviation. Breaches indicate unusually strong behavior and can serve as:
• Trend confirmation when aligned with price direction
• Overbought/oversold warnings at extremes
• Trade entry filters (requiring threshold breach in the intended direction)
Threshold Mode affects sensitivity: MAD (outlier-resistant), Standard Deviation (volatility-sensitive), Percentile Rank (fixed probability bands).
Alert Conditions
Four built-in alerts trigger on bar close (no repainting): Above +Threshold (strong bullish cycle), Below -Threshold (strong bearish cycle), Above Zero (bullish phase shift), Below Zero (bearish phase shift).
█ SETTINGS & PARAMETER TUNING
Voss Predictive Filter
• Source : Price series to filter.
• Bandpass Period (1-100): Primary tuning parameter determining which cycle length the filter emphasizes. Short periods (8-15) are more responsive but noisier; medium periods (16-30) balance responsiveness and smoothness; long periods (31-100) focus on longer cycles with more smoothing.
• Bandwidth (0.01-0.45): Controls filter selectivity. Narrow bandwidths (0.01-0.15) isolate specific cycle periods precisely; medium (0.16-0.30) tolerate cycle irregularity; wide (0.31-0.45) capture broader cycle ranges. Shorter periods pair well with narrower bandwidths.
• Prediction Multiplier (2-10): Controls how many past values contribute to the phase advance. Higher values provide smoother output but reduce the leading effect; lower values maximize anticipation at the cost of stability.
Display Settings
Control visibility and colors of the Voss output, bandpass filter, and zero reference lines.
Diagnostics - Dynamic Thresholds
Three methods identify significant signal deviation:
• MAD (Median Absolute Deviation) : Robust, outlier-resistant measure using `k * MAD` where `MAD ≈ 0.6745 * stdev`.
• Standard Deviation : Volatility-sensitive, calculated as `k * stdev` of Voss over the lookback period.
• Percentile Rank : Fixed probability bands using the percentile of |Voss| (e.g., 90% means only 10% of values exceed threshold).
Settings:
• Dynamic Threshold : Toggle threshold bands and set colors.
• Threshold Mode : Select MAD, Standard Deviation, or Percentile Rank.
• Period (2-200): Lookback for threshold calculations. Default 50.
• Multiplier (k) : Scaling for MAD/Standard Deviation modes. Default 1.5.
• Percentile (%) (0-100): For Percentile Rank mode only. Default 90%.
█ LIMITATIONS
Inherent Characteristics
• Residual lag : Despite negative group delay design, some lag remains relative to price action.
• Cyclical markets required : Performs best on instruments with clear cyclical components. Strongly trending markets with little cyclicality produce less useful signals.
• Signal interpretation : Absolute Voss values are instrument-specific. Always interpret relative to adaptive threshold bands, not fixed levels.
Market Conditions to Avoid
• Sudden news events/gaps : Major discontinuities disrupt cycle continuity, causing erratic signals. Requires 1-2 full cycle periods to re-stabilize.
• Low volume/illiquid markets : Sporadic trading produces false cycles from liquidity artifacts. Use only on actively traded instruments during liquid hours.
• Regime changes : During cyclical ↔ trending transitions, watch for persistent extremes without mean reversion, increasing price/indicator divergence, or unresolved threshold breaches.
Parameter Selection Pitfalls
• Mismatched period : If Bandpass Period doesn't match actual market cycles, the filter produces weak signals. Use cycle measurement tools (FFT, autocorrelation, Dominant Cycle) to identify appropriate periods first.
• Overoptimization : Perfect historical fits typically fail forward. Choose robust parameters that work across multiple instruments and timeframes.
█ NOTES
Credits
This indicator is based on concepts from Dr. John F. Ehlers' work on predictive filters and bandpass techniques for technical analysis. Dr. Ehlers has published extensively on applying digital signal processing methods to financial markets in Technical Analysis of Stocks & Commodities (TASC) magazine. His articles on bandpass filters and predictive techniques, particularly the Voss Predictive Filter concept, provided the theoretical foundation for this implementation.
For those interested in the underlying mathematics and DSP concepts:
• Ehlers, J.F. (2001). Rocket Science for Traders: Digital Signal Processing Applications . John Wiley & Sons.
• Various TASC articles by John Ehlers on bandpass filters, cycle analysis, and predictive filtering techniques.
• Ehlers, J.F. "Voss Predictive Filter" - Technical Analysis of Stocks & Commodities magazine.
by ♚@e2e4

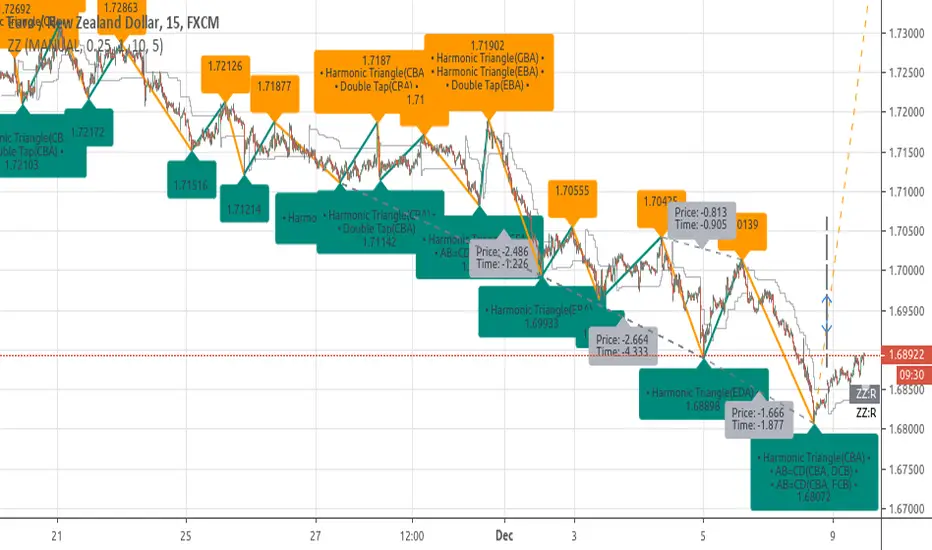
[RS]ZigZag Percent Reversal - Forecast - patterns - labels description:
• Zig Zag indicator plots points on the chart whenever prices reverse
by a percentage greater than a pre-chosen variable.
• Forecasts area based on zigzag statistics.
• Displays labels with detected patterns.
• Displays slope information rate of price, time diferentials and angle(experimental)
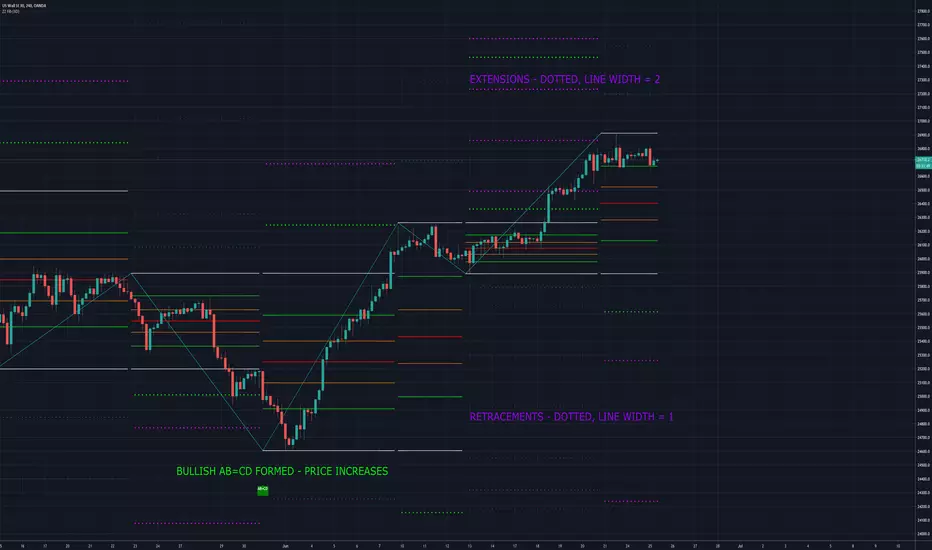
MoT - ZigZag Fibonacci + Ext./Ret. (Extended Ver.)The Indicator plots ZigZags and then overlays Fibonacci Levels (With Extension and Retracement Levels).
W have also programmed the indicator to search for Bullish/Bearish chart patterns in the form of ABC's, ABCD's, 3 Drives , BAT etc etc.
We have also added multiple time frame (MTF) options so the script will search for swing Highs/Lows over a larger period.
Please Note - This Version is with Extended lines of the most current Fib Levels. Which can make the charts look very busy. The other Indicator (No Extensions - Cleaner) is here:

MoT - ZigZag Fibonacci w/Extensions + Chart Pattern RecognitionOne of my favourite indicators we have created over an extremely creative weekend while also watching Bitcoin keep pushing on! The Indicator plots ZigZags and then overlays Fibonacci Levels (With Extensions). I have also programmed the indicator to search for Bullish/Bearish chart patterns in the form of ABC's, ABCD's, 3 Drives, BAT etc etc. This evening we have also added multiple time frame (MTF) options.

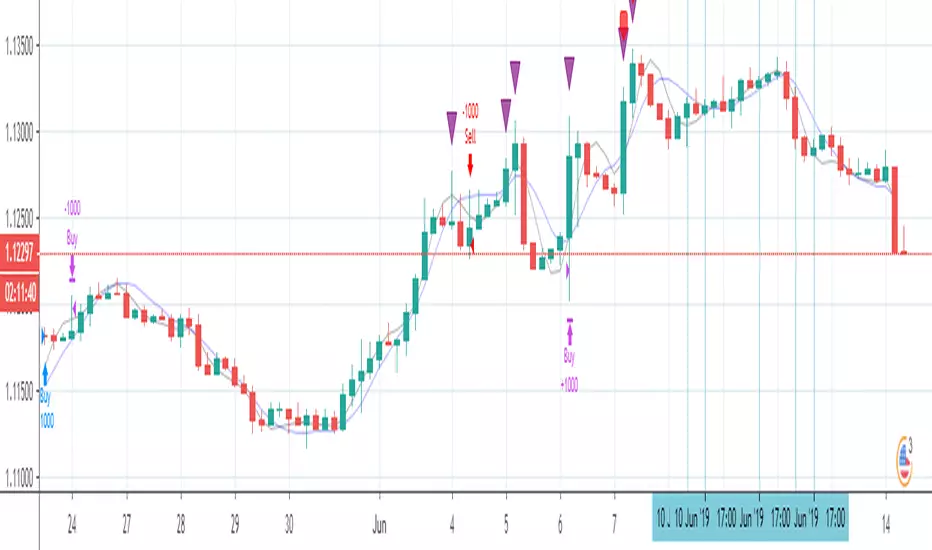
Peaks ReversalThis is a script request by trader @liquidentourage
This script analyses the market at high or low peaks and uses price action to enter the trade
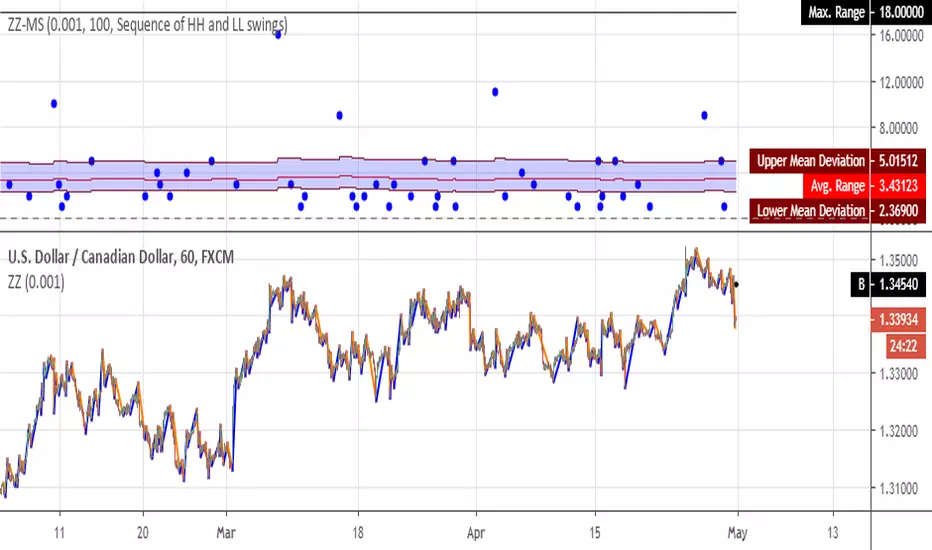
[RS]ZigZag Percent Reversal(Multiple) - Forecast Areasnaive level forecasting of multiple zigzag's
based on this principle:
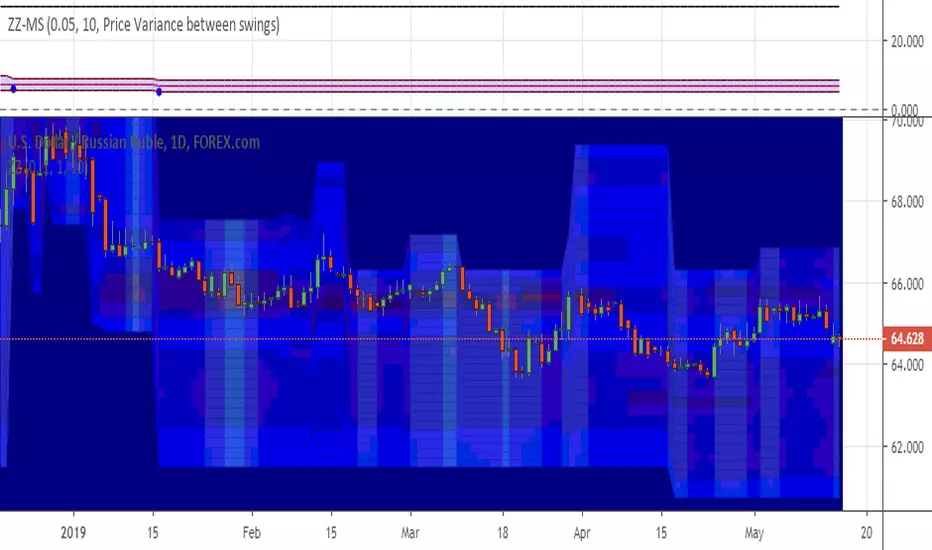
[RS]ZigZag Percent Reversal - Multiple StatisticsMultiple Statistics from zigzag:
• Price range between swings.
• Bar range between swings.
returns maximum value, avg value and mean deviation.
if you find something missing, please leave a message bellow.
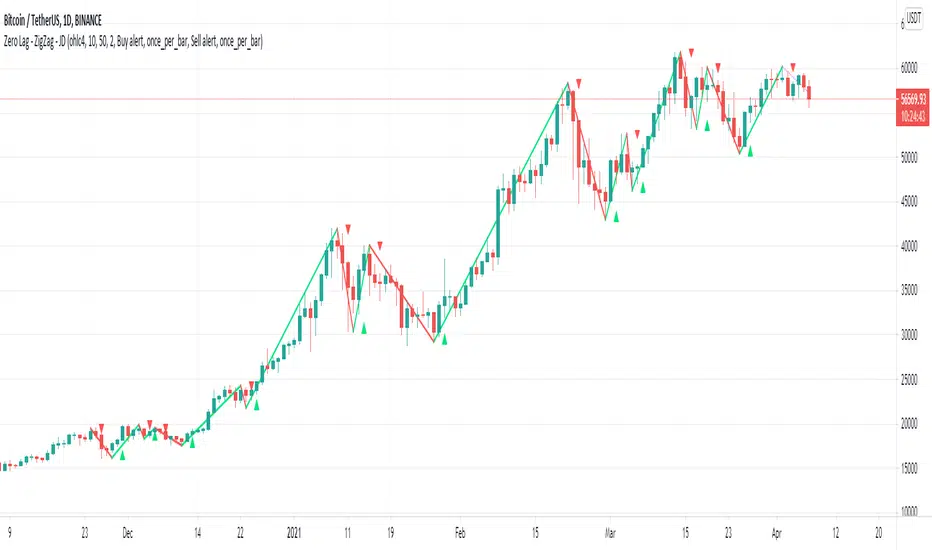
Zero Lag - ZigZag - JDThis is a alternative version of the well known "ZigZag indicator" but it uses turning points of the Jurik ma
instead of the traditional "pivot points" that are by definition lagging by a large lookback period, the (almost-) Zero Lag ZigZag lags by about 2 bars on average (depending on the candles forming)
The ZigZag pattern can be used to draw trendlines and S/R lines
It can also be used for "wave counting" in a way that reduces interpretation.
If you find other uses, please leave your ideas in the comments!
Shoutout to Everget for the awesome Jurik code!!
JD.
#NotTradingAdvice #DYOR
Simple LinesIntroduction
Making lines is great in technical analysis since it can highlights principal movements and make the analysis of the price easier when using certain methodologies (Elliott Waves, patterns).
However most of the indicators making lines (Zig-Zag, simple linear regression) are non causal (repaint), this is the challenge i tried to overcome, making an indicator capable of making lines in a smart way (able to follow price without loosing a linear approach) and with the least lag possible, i inspired myself from the behaviour of the renko when using a small brick size. This indicator does not repaint .
The code is short and i hope, understandable for all of you, making lines is not a difficult task and its important to know that when a problem appear complex it does not mean that the code used to solve this problem must be complex. Lets see the indicator in details.
The indicator
The indicator have 4 parameters, the length parameter who control the length of lines, the emphasis parameter who control the stability and also the ability to make lines closer to the price (thus minimizing the sum of squares) , the mult parameter which is similar to emphasis and a point option that we will discuss later.
When emphasis and mult are both equal to 1 the indicator will sometimes draw a perfect line, however this line will try to follow the price and thus can create a noisy result.
This is where emphasis and mult will correct this behaviour. The emphasis parameter give a more periodic look as well as some control to the lines but can also destroy them.
This should not happen with mult , this parameter also give more predictability to the lines. Overall it correct the drawbacks of the parameters combinations mentioned earlier.
Its also possible to mix both the emphasis and mult parameter, but take into account that when both are equals the result consist of less reactive lengthy lines with low accuracy. Its better to only use one of them and let the other stay to 1.
Point Option
The indicator can sometimes have a weird look, appearing almost flat or just dont appearing at all. When such thing happen use the point option.
XPDUSD without point option.
with point option :
Time Frame Problem and Its Fix
When using higher time-frames the result of the indicator can appear different, in general the higher the time frame the lengthier are the lines. In order to fix this you can use decimals in the length parameter
length and mult both equal to 5.5, emphasis cant use decimals.
Conclusion
I have highlighted a simple way to make use of the small renko box size method in order to return reactive lines without making the indicator repaint. However Its ability to be close to the price as well as being always super reactive is not a guarantee.
For any suggestion/help feel free to pm me, i would be happy to help you :)

Double Top Pattern IdentifierHello friends,
This script is a powerful, non-repainting detector for the classic Double Top pattern — one of the most widely recognized bearish reversal setups. The indicator automatically identifies and tracks developing 'M'-shaped formations in real-time, confirming valid entries once the neckline is broken and providing complete trade management features. No manual configuration for detection is needed — it works out of the box.
🛠 How It Works
It uses advanced techniques that involve pivot points analysis and do not rely on other indicators, ensuring robustness and adaptability across different market conditions. When a potential Double Top is detected, the indicator marks the pattern points, draws the neckline, and waits for confirmation.
Once confirmed, it generates a 'Short' signal with calculated Take Profit (TP) and Stop Loss (SL) levels.
The script includes a statistics table summarizing performance metrics — such as number of patterns, trade results, bar distances, and top differences — all dynamically updated on your chart.
🔥 Key Features
Pine Script V6 — optimized logic and performance
Works out of the box — no manual configuration required
Non-repainting detection
Fully visualized structure — points, neckline, TP, and SL plotted automatically
Multiple TP/SL modes: R/R ratio, ATR-based, percent, points, pips, ticks, or top-to-neckline distance
Trailing Stop Loss support
Interactive statistics table with pattern count, trade outcomes, profit ratio, and structural measurements
Smart alert system
Customizable alert messages with placeholders (price, ticker, timeframe, etc.)
Clean, updated UI with improved layout and organization
If you'd like access or have any questions, feel free to reach out to me directly via DM.
👋 Good luck and happy trading!
付費腳本

Elliott strategyIt uses Elliott teory to shift two moving averages 8 positions (based on 5-3 fractal), and the crossing is close to reversions. And it keeps an eye on RSI level to be sure it is on hot level to sell/buy

Double Bottom Pattern IdentifierHello friends,
This script is a powerful, non-repainting detector for the classic Double Bottom pattern — one of the most widely recognized bullish reversal setups. The indicator automatically identifies and tracks developing 'W'-shaped formations in real time, confirming valid entries once the neckline is broken and providing complete trade management features. No manual configuration is needed — it works right out of the box.
🛠 How It Works
It uses advanced techniques involving pivot point analysis and does not rely on other indicators, ensuring robustness and adaptability across different market conditions. When a potential Double Bottom is detected, the indicator marks the pattern points, draws the neckline, and waits for confirmation.
Once confirmed, it generates a 'Long' signal with calculated Take Profit (TP) and Stop Loss (SL) levels.
The script also includes a statistics table summarizing performance metrics — such as the number of patterns, trade results, bar distances, and bottom differences — all dynamically updated on your chart.
🔥 Key Features
Pine Script V6 — optimized logic and performance
Works right out of the box — no setup required
Non-repainting detection
Fully visualized structure — points, neckline, TP, and SL plotted automatically
Multiple TP/SL modes: R/R ratio, ATR-based, percent, points, pips, ticks, or bottom-to-neckline distance
Trailing Stop Loss support
Interactive statistics table with pattern count, trade outcomes, profit ratio, and structural measurements
Smart alert system
Customizable alert messages with placeholders (price, ticker, timeframe, etc.)
Clean, updated UI with improved layout and organization
If you'd like access or have any questions, feel free to reach out to me directly via DM.
👋 Good luck and happy trading!
付費腳本

Divergences for many indicators v2.0A gift from me to all.
This script is developed to find Divergences for many indicators. it analyses divergences and then draws line on the graph. red for negatif, lime for positive divergences.
Currently script checks divergence for RSI, MACD, MACD Histogram, Stochastic, CCI, Momentum, OBV, Diosc, VWMACD and CMF indicators. You can use some or all of these indicators to check divergences as you wish by choosing them on the menu. Also you can add/remove many other indicators to the script to check if there is divergence.
The script first calculates tops/bottoms by using higher time frame zig zag and then finds divergences.
Higher Time Frames are
if currend period 1 min => HTF = 5 mins
if currend period 3 mins => HTF = 15 mins
if currend period 5 mins => HTF = 15 mins
if currend period 15 mins => HTF = 1 hour
if currend period 30 mins => HTF = 1 hour
if currend period 45 mins => HTF = 1 hour
if currend period 1 hour => HTF = 4 hours
if currend period 2 hours => HTF = 4 hours
if currend period 3 hours => HTF = 4 hours
if currend period 4 hours => HTF = 1 day
if currend period 1 day => HTF = 1 week
if currend period 1 week => HTF = 1 week
future plan : script finds regular divergences, soon I will add hidden divergences and also I plan to add alert ;)

Elliott wave strategy (lirshah)Elliott wave strategy has been written based on Elliott oscillator.
the strategy has good results on crypto pair at H1 time frame..

Fractal FramerThis indicator constructs dynamic high/low price range levels, based on 3 point fractals. Trend lines are drawn (zigzag style) at fractal points when trend direction is clearly established.
This is a lagging indicator: fractals lag by one bar and trend lines can lag by many bars. However, its strength lays in objectively defining historic price action: e.g. support/resistance levels and waves within a trend.
See the comments at the beginning of the script for a complete description.

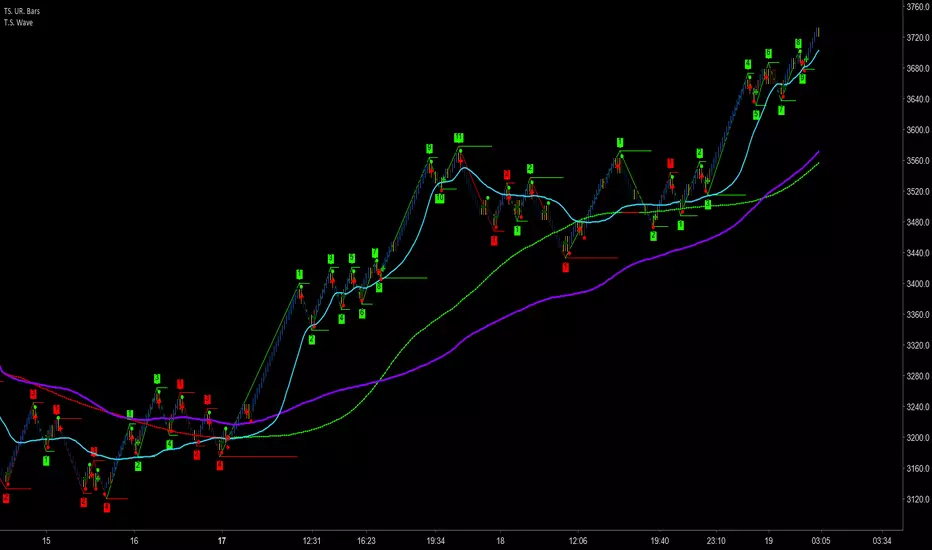
Trader Set - Wave CountThis is a wave counting tool for my methodology with little addition of drawing high low sections of wave reversal as local support / resistance.
Please don't contact me for getting access, these tools are only available for my students. The English version of website and learning materials are under development and soon they will be ready. I will announce it under every script related to my methodology so that you get informed and participate in the course if you want to.
Market Compass [yoxxx]For all markets and all timeframes,
based on Constance Brown's observation, that rsi bull range is 40 to 80 and bear's 20 to 65 (almost strictly).
The histogramm tells you which longer term market you#re in.
The short term curves identify the wave within the trend (similat to EW impulse / corrective) incl. overdoing action
Example: longterm= green, wave =red--> Bullmarket, corrective wave etc.
(I locked this one to remind you that the length of the indicators are essential)
