[blackcat] L5 Whales Jump Out of Ocean XLevel: 5
Background
I have been working on developing indicators on how to track the banker funds or whales. In my open source indicators published, you can search for the keywords "Banker" or "Whale" to find and use these indicators. After three years of development and hard work, I have perfectly combined the banker fund/whale mathematical model and the unique Fibonacci space-time indicators. This is named as "L5 Whales Jump Out of Ocean X" indicator that I will introduce today.
Function
This indicator introduces three independent judgment standards. They are whales & waves, Fibonacci time windows and dynamic Fibonacci retracement arrows. Whales and waves are banker fund/ whale behavior modeling based on my unique moving average technology. Fibonacci time and space indicators are a unique improvement I made to traditional indicators of the same kind to make them more powerful.
This indicator is basically applicable to all markets, but requires traders to choose the most suitable trading pair to operate. This indicator is used for multiple periods. Because the smaller the period, the more unstable the data, the larger the period, the more stable the Fibonacci space-time indicator. I use this indicator for the operation of cryptocurrency, commodities, forex, local stocks and ETFs. When this indicator is combined with the candle patterns of Japanese candlesticks, it will often produce higher quality signals, so I suggest that people who use this indicator should have the basic knowledge of Japanese candlesticks in order to better use this indicator.
Key Signal
Long Whales / Banker Pump--> fuchsia and red stick bars (Motive waves with fuchsia color; corrective waves with red color)
Short Whales / Banker Dump --> yellow and red green stick bars (Motive waves with yellow color; corrective waves with green color)
Long Waves --> fuchsia and red areas (Motive waves with fuchsia color; corrective waves with red color)
Short Waves --> yellow and red green areas (Motive waves with yellow color; corrective waves with green color)
Fibonacci Top Time Window --> red background color
Fibonacci Bottom Time Window --> green background color
Dynamic Fibonacci Retracement Support Arrows --> green arrows with "SUP" text; the brighter color, the stronger support.
Dynamic Fibonacci Retracement Resistance Arrows --> red arrows with "RES" text; the brighter color, the stronger resistance.
Ready for Support Cross --> green crosses with "*SUP" text on zero axis.
Ready for Resistance Cross --> red crosses with "*RES" text on zero axis.
Pros and Cons
ONLY suitable for discretionary trading, and does NOT support automatic trading system/bots with alerts.
Intuitive and effective, the output signal is more reliable after multi-indicator resonance
Remarks
My first L5 indicator published
Closed-source
Invite-only
Redeem Fee Life Lock Guarantee
Although I take the efforts to inform the script requesters that the best way to promote trading skills is to learn from the open source scripts I released by themself and to improve their PNIE script programming skills, there are still many people asking how to obtain or pay to use BLACKCAT L4/L5 private scripts. In fact, I do not encourage people to use Tradingview Coins (TVC) / Cryptocurrency to redeem the right to use BLACKCAT L4/L5 scripts. However, redeeming private script usage rights through TV Coins/ Cryptocurrency may be an effective way to force more people to learn PINE script programming seriously. And then I can concentrate on answering more valuable community questions instead of being overwhelmed by L4/L5 scripting permission reqeusts.
I would like to announce a ‘Redeem Fee Lock Guarantee’ program to further simplify the L4/L5 indicator/strategy utility offering and distinguish itself from the competition. ‘Redeem Fee lock guarantee’ is one of the major initiatives by BLACKCAT as a part of overall value packaging designed to guard BLACKCAT’s followers’ against cost-overruns and operational risks usually borne by them when it comes to PINE script innovation ecosystem. The TVCs redeemed for L4/L5 a follower signs up for with BLACKCAT is their guaranteed lifetime locked in TVC Quantity/ cryptocurrency, with no special conditions, exclusions and fine print whatsoever. Based on this scheme, I can constantly refine, expand, upgrade and improve PINE script publishing to ensure the very best experiences for my followers. The 'Redeem Fee Lock Guarantee' is a step in the direction of rewarding the valuable followers. NOTE: Every L4/L5 script redeeming service is ONLY limited to TVC or Cryptocurrency ("Win$ & Donate w/ This" Addresses displayed on script page) redeeming which the 1st signed up TVC Qty/ equivalent cryptocurrency is the lifetime offered TVC Qty/ equivalent crypto.
How to subscrible this indicator?
The script subscription period only has two options of one month or one year, and its price is floating. The latest price of the script subscription is proportional to the number of likes/agrees this script has already received. Therefore, the price of subscribing to this script shows an increasing trend, and the earliest subscribers can enjoy the price of lifetime lock to this script. As the number of likes / agrees of this script increases, the subscription fee for one month and one year will also increase linearly. Whatever, the first subscription price of the use will be locked for life.
Monthly subscription and annual subscription can be done either by tradingview coins (TVC) or by converting into equivalent cryptocurrency at the exchange rate (1TVC=0.01USD) for redeem.
TVC payment needs to pay TVC directly in the comments under this script. Every time I authorize a new user, I will update the latest number of subscribed users and latest price for next subscription under the script comment. If there are any conflicting scenario happened to the rules and my update. My updated price based on the rule will be the final price for next subscription. The following subscribers need to pay the corresponding amount of TVC or cryptocurrency in accordance with the latest number of users and price announced by me in accordance with the rules published.
TVC redemption is the method I strongly recommend, and I hope you can complete the redemption in the comment area of this script. This is like a blockchain structure, each comment is a block, each subscription is a chain, which is conducive to open and transparent publicity and traceability to avoid unnecessary disputes.
Monthly Subscription Charges
500TVC <50 Agrees (A)
50A<850TVC<100A
100A<1000TVC<150A
150A<1350TVC<200A
200A<1500TVC<250A
250A<1850TVC<300A
300A<2000TVC<350A
350A<2350TVC<400A
400A<2500TVC<450A
450A<2850TVC<500A
500A<3000TVC<550A
550A<3350TVC<600A
600A<3500TVC<650A
650A<3850TVC<700A
700A<4000TVC<750A
750A<4350TVC<800A
800A<4500TVC<850A
850A<4850TVC<900A
900A<5000TVC<950A
950A<5350TVC<1000A
1000A<5500TVC<1050A
And so on...
Annual Subscription Charges
5000TVC <50 Agrees (A)
50A<8500TVC<100A
100A<10000TVC<150A
150A<13500TVC<200A
200A<15000TVC<250A
250A<18500TVC<300A
300A<20000TVC<300A
350A<23500TVC<400A
400A<25000TVC<450A
500A<28500TVC<550A
500A<30000TVC<550A
550A<33500TVC<600A
600A<35000TVC<650A
650A<38500TVC<700A
700A<40000TVC<750A
750A<43500TVC<800A
800A<45000TVC<850A
850A<48500TVC<900A
900A<50000TVC<950A
950A<53500TVC<1000A
1000A<55000TVC<1050A
And so on...
Whales

[blackcat] L1 Bitcoin Guppy Whale Pump Dump OscillatorLevel: 1
Background
The Guppy Multiple Moving Average (GMMA) is a technical indicator that identifies changing trends, breakouts, and trading opportunities in the price of an asset by combining two sets of moving averages (MA) with different time periods. There is a short term group of MAs and a long term group of MAs.
One of the biggest differences between cryptocurrency and traditional financial markets is that cryptocurrency is based on blockchain technology. Individual investors can discover the direction of the flow of large funds through on-chain transfers. These large funds are often referred to as Whale. Whale can have a significant impact on the price movements of cryptocurrencies, especially Bitcoin . Therefore, how to monitor Whale trends is of great significance both in terms of fundamentals and technical aspects.
Function
L1 Bitcoin Guppy Whale Pump Dump Oscillator is innovative because it was moved from main chart to aux chart and the input source of Guppy moving average was changed in to bias rate of key EMAs. This makes it work as a Guppy oscillator. This Guppy oscillator was designed and optimized to detect whale pump and dump behavior for BTCUSD or BTCUSDT trading pairs. When whale pump is detected, yellow candles appear; when whale dump is detected, fuchsia candles appear.
Key Signal
di,d1~d8 ---> Guppy oscillator lines
pump --> whale pump detector
dump --> whale dump detector
Pros and Cons
Pros:
1. easy observe price trend
2. it detects whale pump and dump
Cons:
1. no explicit entries are disclosed
2. only optimized for Bitcoin usd/usdt trading pairs
Remarks
Courtesy of @LunaOwl " Rainbow Color Gradient" for colorful Guppy oscillator lines in this script
Readme
In real life, I am a prolific inventor. I have successfully applied for more than 60 international and regional patents in the past 12 years. But in the past two years or so, I have tried to transfer my creativity to the development of trading strategies. Tradingview is the ideal platform for me. I am selecting and contributing some of the hundreds of scripts to publish in Tradingview community. Welcome everyone to interact with me to discuss these interesting pine scripts.
The scripts posted are categorized into 5 levels according to my efforts or manhours put into these works.
Level 1 : interesting script snippets or distinctive improvement from classic indicators or strategy. Level 1 scripts can usually appear in more complex indicators as a function module or element.
Level 2 : composite indicator/strategy. By selecting or combining several independent or dependent functions or sub indicators in proper way, the composite script exhibits a resonance phenomenon which can filter out noise or fake trading signal to enhance trading confidence level.
Level 3 : comprehensive indicator/strategy. They are simple trading systems based on my strategies. They are commonly containing several or all of entry signal, close signal, stop loss, take profit, re-entry, risk management, and position sizing techniques. Even some interesting fundamental and mass psychological aspects are incorporated.
Level 4 : script snippets or functions that do not disclose source code. Interesting element that can reveal market laws and work as raw material for indicators and strategies. If you find Level 1~2 scripts are helpful, Level 4 is a private version that took me far more efforts to develop.
Level 5 : indicator/strategy that do not disclose source code. private version of Level 3 script with my accumulated script processing skills or a large number of custom functions. I had a private function library built in past two years. Level 5 scripts use many of them to achieve private trading strategy.

[blackcat] L1 Whale Jumping out of the OceanLevel: 1
Background
One of the biggest differences between cryptocurrency and traditional financial markets is that cryptocurrency is based on blockchain technology. Individual investors can discover the direction of the flow of large funds through on-chain transfers. These large funds are often referred to as Whale. Whale can have a significant impact on the price movements of cryptocurrencies, especially Bitcoin . Therefore, how to monitor Whale trends is of great significance both in terms of fundamentals and technical aspects.
We often see whales suddenly jump out of the ocean and then set off huge waves. What we need to do is to surf the wave according to the trend after the whale jumps out of the sea. This is really an exciting sport!
Function
By modeling the behavior of Whale and individuals (Surfers), L1 Whale Jumping out of the Ocean can not only simply describe the behavior trends of Whale and individuals, but also describe the shape of waves generated by the whale jump. Individual traders need to follow the wave trend to take profit.
NOTE: white line and yellow candles represent whale appears but it CANNOT indicate the direction as PUMP or DUMP. This indicator is one of the whale series. It is featured by vividness. A technical indicator is drawn as ocean (momentum in blue and aqua), whale (whale PUMP/DUMP in white,yellow, red, fuchsia and green), huge wave (mid-term trend or swing trend in aqua and blue).However, it does not accurately generate buying and selling points.
Key Signal
var01 --> huge wave caused by whale jump. it is used to confirm whale jump and describe the trend of wave for surfers.
var02 --> whale move signal
var12 --> whale move signal
var28 --> high confidence level of huge whale move
dynabot --> deep ocean (dynamic bottom)
Pros and Cons
Pros:
1. Detect Whale pump and dump and the strength of huge wave.
2. Vividly compare the market movement to a huge wave caused by a whale jumping out of the sea.
3. When it resonante with buy or sell signal from other independent indicators, it has higher confidence level.
Cons:
1. No exact long and short entries.
2. It is sensitive and may have noise inside and generate fake entry signal.
Remarks
Please do not think that this is just a technical indicator, this is a documentary about whales.
Readme
In real life, I am a prolific inventor. I have successfully applied for more than 60 international and regional patents in the past 12 years. But in the past two years or so, I have tried to transfer my creativity to the development of trading strategies. Tradingview is the ideal platform for me. I am selecting and contributing some of the hundreds of scripts to publish in Tradingview community. Welcome everyone to interact with me to discuss these interesting pine scripts.
The scripts posted are categorized into 5 levels according to my efforts or manhours put into these works.
Level 1 : interesting script snippets or distinctive improvement from classic indicators or strategy. Level 1 scripts can usually appear in more complex indicators as a function module or element.
Level 2 : composite indicator/strategy. By selecting or combining several independent or dependent functions or sub indicators in proper way, the composite script exhibits a resonance phenomenon which can filter out noise or fake trading signal to enhance trading confidence level.
Level 3 : comprehensive indicator/strategy. They are simple trading systems based on my strategies. They are commonly containing several or all of entry signal, close signal, stop loss, take profit, re-entry, risk management, and position sizing techniques. Even some interesting fundamental and mass psychological aspects are incorporated.
Level 4 : script snippets or functions that do not disclose source code. Interesting element that can reveal market laws and work as raw material for indicators and strategies. If you find Level 1~2 scripts are helpful, Level 4 is a private version that took me far more efforts to develop.
Level 5 : indicator/strategy that do not disclose source code. private version of Level 3 script with my accumulated script processing skills or a large number of custom functions. I had a private function library built in past two years. Level 5 scripts use many of them to achieve private trading strategy.

Neglected Volume by DGTVolume is one piece of information that is often neglected, however, learning to interpret volume brings many advantages and could be of tremendous help when it comes to analyzing the markets. In addition to technicians, fundamental investors also take notice of the numbers of shares traded for a given security.
What is Volume?
The volume represents all the recorded trades for a security that occurs in a given time interval. It is a measurement of the participation, enthusiasm, and interest in a given security. Think of volume as the force that drives the market. Volume substantiates, energizes, and empowers price. When volume increases, it confirms price direction; when volume decreases, it contradicts price direction.
In theory, increases in volume generally precede significant price movements. However, If the price is rising in an uptrend but the volume is reducing or unchanged, it may show that there’s little interest in the security, and the price may reverse.
A high volume usually indicates more interest in the security and the presence of institutional traders. However, a rapidly rising price in an uptrend accompanied by a huge volume may be a sign of exhaustion.
Traders usually look for breaks of support and resistance to enter positions. When security break critical levels without volume, you should consider the breakout suspect and prime for a reversal off the highs/lows
Volume spikes are often the result of news-driven events. Volume spike will often lead to sharp reversals since the moves are unsustainable due to the imbalance of supply and demand
note : there’s no centralized exchange where trades are recorded, so the volume data represents what happens at a particular exchange only
In most charting platforms, the volume indicator is presented as color-coded bars, green if the security closes up and red if the security closed lower, where the height of the bars show the amount of the recorded trades
Within this study, Relative Volume , Volume Weighted Bars and Volume Moving Average are presented, where Relative Volume relates current trading volume to past trading volume over long period, Volume Weighted Bars presents price bars colored based on short period past trading volume average, and Volume Moving Average is average of volume over shot period
Relative Volume is presented as color-coded bars similar to regular Volume indicator but uses four color codes instead two. Notable increases of volume are presented in green and red while average values with back and gray, hence adding ability to emphasis notable increases in the volume. It is kind of a like a radar for how "in-play" a security is. Users are allowed to change the threshold, default value is set to Fibonacci golden ration standard deviation away from its moving average.
Volume Weighted Bars, a study of Kıvanç Özbilgiç, aims to present if price movements are supported by Volume. Volume Weighted Bars are calculated based on shot period volume moving average which will reflect more recent changes in volume. Price actions with high volume will be displayed with darker colors, average volume values will remain as they are and low volume values will be indicated with lighter colors.
Volume Moving Average, Is short period volume moving average, aims to display visually the volume changes. Please not that Relative Volume bars are calculated based on standard deviation of long volume moving average.
What Else?
Apart from the volume itself, your ability to assess what volume is telling you in conjunction with price action can be a key factor in your ability to turn a profit in the market. It makes little sense to analyze the volume alone. To correctly interpret the volume data, it shall be seen in the light of what the price is doing. there are a lot of other indicators that are based on the volume data as well as price action. Analysing those volume indicators has always helped traders and investors to better understand what is happening in the market.
Here are the ones adapted with this study. Some of them used as a source for our aim, some adapted as they are with slight changes to fit visually to this study and please note that the numerical presentation may differ from their regular use
• On Balance Volume
• Divergence Indicator
• Correlation Coefficient
• Chaikin Money Flow
Shortly;
On Balance Volume
The On Balance Volume indicator, is a technical analysis indicator that relates volume flow to changes in a security’s price. It uses a cumulative total of positive and negative trading volume to predict the direction of price. The OBV is a volume-based momentum oscillator, so it is a leading indicator — it changes direction before the price
Granville, creator of OBV, proposed the theory that changes in volume precede price movements in a measurable way. He believed that volume was the main force behind major market moves and thought of OBV’s prediction of price changes as a compressed spring that expands rapidly when released.
It is believed that the OBV shows the interactions between the institutional and retail traders in the market
If the price makes a new high, the OBV should also make a new high. If the OBV makes a lower high when the price makes a higher high, there’s a classical bearish divergence — indicating that only the retail traders are buying. Another type of bearish divergence occurs when the price remains relatively quiet and fails to make a higher high but the OBV soars higher than the previous high — indicating that the institutional traders are accumulating short positions. On the other hand, if the price makes a lower low and the OBV makes a higher low, there is a classical bullish divergence, showing that the institutional traders don’t believe in that move
With this study, Momentum and Acceleration (optional) of OBV is calculated and presented, where momentum is most commonly referred to as a rate and measures the acceleration of the price and/or volume of a security. It is also referred to as a technical analysis indicator and oscillator that is able to determine market trends.
Additionally, smoothing functionality with Least Squares Method is added
Divergences especially, should always be noted as a possible reversal in the current trend, so the divergence indicator is adapted with this study where the Momentum of OBV is assumed as Oscillator with similar usages as to RSI. Divergence is most often used to track and analyze the momentum in an asset’s price and the odds of a price reversal within the current trend. The divergence indicator warns traders and technical analysts of changes in a price/volume trend, oftentimes that it is weakening or changing direction.
Correlation Coefficient
The correlation coefficient is a statistical measure of the strength of the relationship between the relative movements of two variables. A correlation of -1.0 shows a perfect negative correlation, while a correlation of 1.0 shows a perfect positive correlation. A correlation of 0.0 shows no linear relationship between the movement of the two variables. In other words, the closer the Correlation Coefficient is to 1.0, indicates the instruments will move up and down together as it is mostly expected with volume and price. So the Correlation Coefficient Indicator aims to display when the price and volume (on balance volume) is in correlation and when not. With this study blue represent positive correlation while orange negative correlation. The strength of the correlation is determined by the width of the bands, to emphasis the effect horizontal lines are drawn with values set to 0.5 and -0.5. the values above 0.5 (or below -0.5) shows stronger correlation.
Chaikin Money Flow , provide optionally as a companion indicator
The Chaikin money flow indicator (CMF) is a volume indicator that measures the money flow volume over a chosen period. The money flow volume is a measure of the volume and where the price closed relative to the trading session’s range. It comes from the idea that buying pressure is indicated by a rising volume and recurrent closes in the upper part of the session’s price range while selling pressure is demonstrated by an increasing volume and repeated closes in the lower part of the price range.
Both buying and selling pressures are accompanied by an increase in volume, but the location of the closing prices are in accordance with the direction of price
Special thanks to @InvestCHK and @hjsjshs , who have enormously contributed while preparing this study
related studies:
Disclaimer:
Trading success is all about following your trading strategy and the indicators should fit within your trading strategy, and not to be traded upon solely
The script is for informational and educational purposes only. Use of the script does not constitute professional and/or financial advice. You alone have the sole responsibility of evaluating the script output and risks associated with the use of the script. In exchange for using the script, you agree not to hold dgtrd TradingView user liable for any possible claim for damages arising from any decision you make based on use of the script

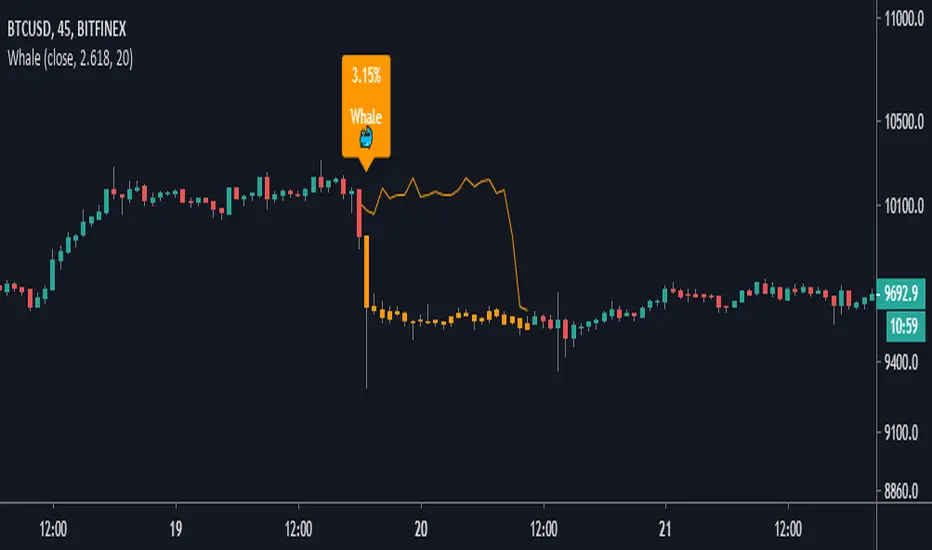
Whale Hunter [Gu5]Indicator to show a big change (Whale) in the same candle
The candles change color, until the Momentum returns to zero
After the movement of a whale, the market is usually on range, and there may be false entries
The default values (2.618% and 20 lenght), are optimized for BTCUSD 15m
---
Spanish
Este indicador muestrar un gran cambio porcentual (ballena) en la misma vela
Las velas cambian de color, hasta que el Momentum vuelve a cero
Luego de el movimiento de una ballena, el mercado suele quedar en lateral, y puede haber falsas entradas
Los valores por defecto (2.618% y 20 lenght), están optimizados para BTCUSD 15m
🐳 Whales 🆚 Little Fish 🐟THIS INDICATOR DETERMINES WHAT THE STRONG HANDS AND WEAK HANDS ARE DOING, BASED ON THE FAMOUS INDICATOR "KONCORDE", OBTAINED FROM THE PERCENTARY VARIATION OF THE INDICATOR IVP (POSITIVE VOLUME INDEX) AND IVN (VOLUME INDEX). ANYONE READING THE AVAILABLE DOCUMENTATION ON THESE TWO SMALL MATHEMATICAL JEWELRY WILL DISCOVER THAT THE ATTRIBUTED VOLUMES NEGOTIATED TO STRONG HANDS (IVN) OR WEAK HANDS (IVP).
NOTE: USE THIS INDICATOR ONLY IN INSTRUMENTS WITH REAL VOLUME.

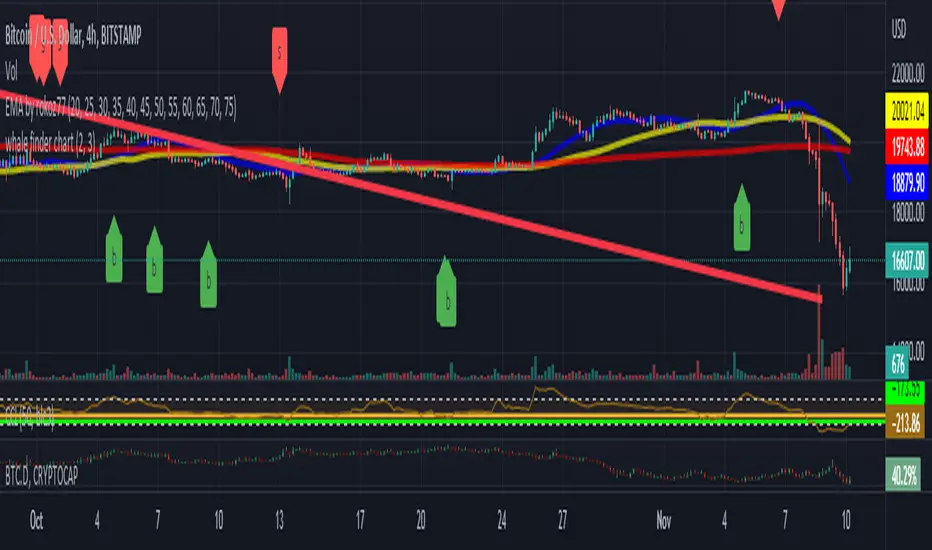
WhaleExperimental #Whale Indicator for those Fish That like to become a WHALE 🐳
Base on Price Action Volatility vs Volume (V vs V)

whale finder work very good on BTC 4hour chart
detect the hidden moves in the chart
it give a sell and buy signals and put it on the chart
do not get last candle signal till it close
WhaleCandlesWhale Candles represent trend from the perspective of:
Strong Hands (i.e. Pro Traders)
Weak Hands (i.e. Average Joe)
This is the meaning of each candle color:
Blue : Confirmed start of Bullish Trend controlled by Strong Hands
Bright Green : Strong Hands lead the Buys
Dark Green : Weak Hands lead the Buys
Fuchsia : Confirmed start of Bearish Trend controlled by Weak Hands
Bright Red : Strong Hands lead the Sells
Pale Red : Weak Hands lead the Sells
