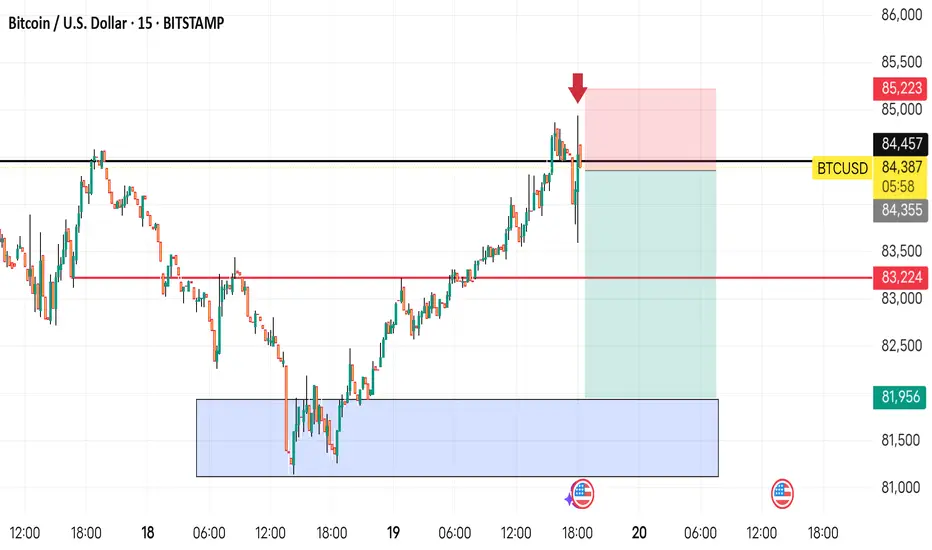
This is a Bitcoin (BTC/USD) 15-minute chart from TradingView, showing a trade setup. Here’s what it means:
1. Resistance Level (Black Line at $84,355-$84,457): Price tested this zone but failed to break above it.
2. Short Trade Setup:
The red arrow indicates a sell entry at the resistance level.
The red box above represents the stop-loss area ($85,223), meaning if the price moves above this, the trade would be invalidated.
The green box below is the take-profit area, with a target around $81,956.
3. Price Rejection: BTC/USD attempted to break resistance but was rejected, suggesting a potential move lower.
4. Liquidity Zone (Blue Box): A previous demand zone where buyers stepped in, indicating a possible support level.
Overall, this chart suggests a bearish trade setup, where the trader expects Bitcoin to decline from the resistance zone.
免責聲明
這些資訊和出版物並不意味著也不構成TradingView提供或認可的金融、投資、交易或其他類型的意見或建議。請在使用條款閱讀更多資訊。
免責聲明
這些資訊和出版物並不意味著也不構成TradingView提供或認可的金融、投資、交易或其他類型的意見或建議。請在使用條款閱讀更多資訊。