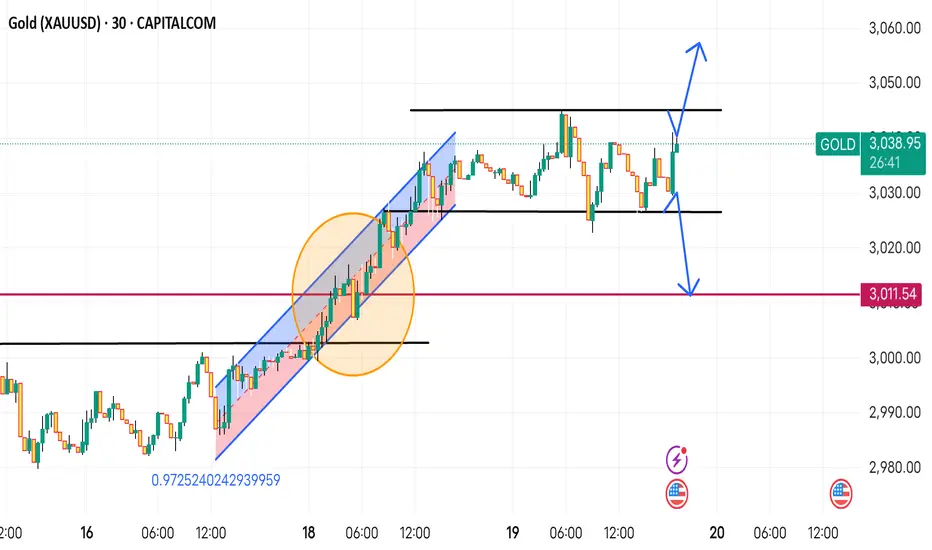
This is a Gold (XAU/USD) 30-minute chart from TradingView, showing a potential trade setup. Here’s what it means:
1. Range Formation:
The price is moving between two key levels (black horizontal lines), indicating consolidation.
2. Breakout or Rejection Scenario:
The blue arrows suggest two possible outcomes:
A break above resistance, leading to further upside.
A rejection at resistance, causing a drop toward the lower support zone.
3. Support Levels:
If the price falls, the next key support is around 3,011.54 (marked in pink).
4. Previous Trend:
The highlighted blue channel (ascending) shows a past bullish move, but now price is in consolidation.
Conclusion: The chart suggests waiting for a breakout or rejection from resistance to decide the next trade direction. If resistance holds, a short trade is possible. If it breaks, a buy setup is confirmed.
免責聲明
這些資訊和出版物並不意味著也不構成TradingView提供或認可的金融、投資、交易或其他類型的意見或建議。請在使用條款閱讀更多資訊。
免責聲明
這些資訊和出版物並不意味著也不構成TradingView提供或認可的金融、投資、交易或其他類型的意見或建議。請在使用條款閱讀更多資訊。