XTIUSD (WTI Crude Oil)
Timeframe: 4H
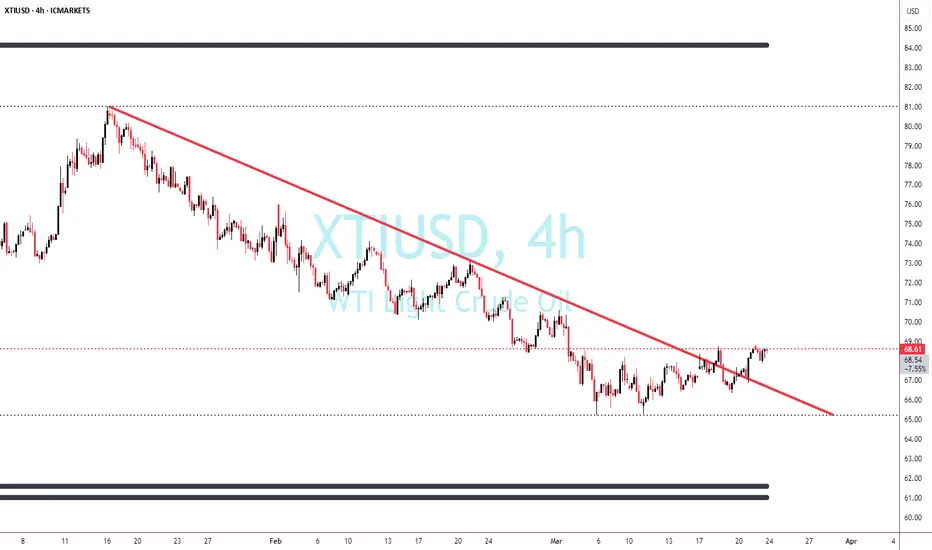
1. Mak Method
Price recently broke above the descending trendline, indicating a potential bullish shift.
Key 369 Level: Price is hovering around $68.61, aligning with my levels.
If price maintains above $67.50, we could see continued bullish movement.
2. Fibonacci, Gann Levels & Elliott Wave
Fibonacci Retracement:
61.8% level at $72.50, making it a critical upside target.
Gann Levels:
Major support at $66.00, which aligns with institutional buying zones.
Elliott Wave Count:
Potential Wave 3 underway, with a break above $70 confirming bullish momentum.
3. Key Technical Levels (Support & Resistance)
Support Levels:
$67.50 - $66.00 → Strong demand zone, potential bullish retest.
$61.50 - $60.00 → Major institutional support (if breakdown occurs).
Resistance Levels:
$69.50 - $70.00 → Short-term resistance, possible liquidity grab.
$72.50 - $75.00 → Next bullish target, aligning with Fibonacci & order blocks.
4. Probable Scenarios with Probability %
Scenario Probability
Bullish Breakout: Retest of $67.50, then continuation to $70-$72.50. 65%
Fake Breakout & Rejection: Price rejects $69.50 and retraces to $66.00. 25%
Bearish Breakdown: Failure to hold $66.00, leading to a drop to $61.50-$60.00. 10%
5. Conclusion & Trading Strategy
Bias: Bullish above $67.50, bearish below $66.00.
Entry Areas:
Long Entry → Retest of $67.50 with confirmation.
Short Entry → Breakdown below $66.00, targeting $61.50.
Stop Loss:
Long trades → Below $65.80.
Short trades → Above $70.50.
Final Thoughts:
Watch for false breakouts at $69.50 before confirming bullish moves.
If price consolidates above $68.50 - $69.00, we could see a rally toward $72.50 - $75.00.
Volume Confirmation: Institutional buying at $67.50 could trigger a strong bullish move.
Timeframe: 4H
1. Mak Method
Price recently broke above the descending trendline, indicating a potential bullish shift.
Key 369 Level: Price is hovering around $68.61, aligning with my levels.
If price maintains above $67.50, we could see continued bullish movement.
2. Fibonacci, Gann Levels & Elliott Wave
Fibonacci Retracement:
61.8% level at $72.50, making it a critical upside target.
Gann Levels:
Major support at $66.00, which aligns with institutional buying zones.
Elliott Wave Count:
Potential Wave 3 underway, with a break above $70 confirming bullish momentum.
3. Key Technical Levels (Support & Resistance)
Support Levels:
$67.50 - $66.00 → Strong demand zone, potential bullish retest.
$61.50 - $60.00 → Major institutional support (if breakdown occurs).
Resistance Levels:
$69.50 - $70.00 → Short-term resistance, possible liquidity grab.
$72.50 - $75.00 → Next bullish target, aligning with Fibonacci & order blocks.
4. Probable Scenarios with Probability %
Scenario Probability
Bullish Breakout: Retest of $67.50, then continuation to $70-$72.50. 65%
Fake Breakout & Rejection: Price rejects $69.50 and retraces to $66.00. 25%
Bearish Breakdown: Failure to hold $66.00, leading to a drop to $61.50-$60.00. 10%
5. Conclusion & Trading Strategy
Bias: Bullish above $67.50, bearish below $66.00.
Entry Areas:
Long Entry → Retest of $67.50 with confirmation.
Short Entry → Breakdown below $66.00, targeting $61.50.
Stop Loss:
Long trades → Below $65.80.
Short trades → Above $70.50.
Final Thoughts:
Watch for false breakouts at $69.50 before confirming bullish moves.
If price consolidates above $68.50 - $69.00, we could see a rally toward $72.50 - $75.00.
Volume Confirmation: Institutional buying at $67.50 could trigger a strong bullish move.
交易結束:目標達成
免責聲明
這些資訊和出版物並不意味著也不構成TradingView提供或認可的金融、投資、交易或其他類型的意見或建議。請在使用條款閱讀更多資訊。