XBT波段分析!XBT在沖擊8500後有了主力出貨跡象,其實在上漲創新高時就有出貨跡象,假創新高吸引散戶接盤。
在8500短暫上下掃單後,早間快速放量下跌。
現在我們等待價格達到結構性和需求性重合的支撐位,關註壹下量價關系,如果出現下跌減弱,或有波段多頭可以收獲!
等價格突破這個支撐區域後我們再考慮做空,不要急於空頭進場!
在想法中搜尋"VOLUME"

一飞冲天,哀鸿遍野!!從縮量到突然放量,主力意圖明顯,就是在關鍵的壓力位吸引更多空頭進場,然後突然拉升吃掉散戶的單子。
希望看到我上壹篇文章的朋友,有接受我的建議,設置保本止損。
本次放量突破關鍵結構位後,已經確定了中期多頭底部的形成,我們現在只有等待回調找機會做多,如果能回調下方強支撐最好,但是可能性較小,所有現在等待搭建新結構位,擇機介入多頭,後續持續關註!

BTC空結束了嘛?在上一篇分析中我們成功捕捉到了一段空頭行情,但是行情沒有來到我們理想的第二止盈位,在觸及結構性支撐和需求支撐後就出現了階段性反彈。
這是否意味著空頭行情結束呢?或許回答這幾個問題就知道了?
1.多頭的力量上體現了嘛?
2,空頭衰竭的表現是什麽?
3,上方壓力位展現了什麽?
所以大概率依然是空頭,除非底部展現多頭吸籌迹象,我特別關注反彈的多頭力量。特別注意反彈的多頭接下來的表現!!!! 字,點擊轉換按鈕,就能轉換為繁體字。

BTC--空空如也!BTC在多頭的夢想化為灰燼後,迎來的就是空頭的盛宴!
上方的兩座大山就是多頭的屍體堆積而成,壹道都都難以突破,更何況兩道!!
現在我們應該擔心的是有沒有上車的機會,而不是空不空的問題!(依然要等優勢位置出現)
特別提醒:
永遠把控制損失放在第壹位!!巨大虧損不是重倉就是得意忘形!

BTCUSD如果有機會回調不要猶豫---空我們看到如此大的放量下跌,這麽大的放量通常需要再次積蓄能量,所以價格很有可能在這個地方階段震蕩或者回調。當然我們不要去參與1號位的回調,因為這種回調的不確定性太大,首要還是要等到價格回調到2號位再考慮介入空頭。除非價格在底部展現明顯吸籌跡象,且已經有多頭發力跡象才考慮介入多頭。

回測 VWAP 為何屢屢奏效?這套策略的秘密在細節裡無論你是操作股票還是外匯日內交易,「回測 VWAP」策略都是歷久不衰的技術之一。乍聽之下,它或許像是簡單地「拉回買在 VWAP」,但就像大多數交易策略一樣,真正的優勢藏在細節中。
若執行得當,這可以是一種結合結構、時機與市場心理的高效交易方式。但若缺乏幾項關鍵過濾條件,它也可能只是圖表中隨意的一次嘗試。
什麼是 VWAP?
VWAP 是「成交量加權平均價格」(Volume Weighted Average Price),它代表當日開盤以來所有成交價位的加權平均價格。與單純以價格計算的移動平均線不同,VWAP 融合了「價格」與「成交量」,因此能更有效地反映市場的真實交易重心與公平價格區。
在盤整時段,VWAP 常成為價格的磁石;在趨勢行情中,它則是多空爭奪的戰場。
策略核心:5 分鐘圖的 VWAP 拉回交易
這套策略以 5 分鐘圖為主,最適用於當日已有明確方向的行情。理想情況是順著當日早盤趨勢操作,而非去摸頂抄底。
核心概念為:當價格自 VWAP 發動初步趨勢後出現回測,只要在回測 VWAP 處出現清晰的反轉形態,便是進場的有效訊號。
入場條件:反轉蠟燭形態
當價格回測 VWAP 時,你需要尋找有效的進場信號,這不是猜測,而是等待明確的價格反應。
常見且有效的形態包括:
長下影線的多頭錘頭或長上影的空頭倒錘
吞噬形態(Engulfing)
雙底或雙頂結構
最佳情況是在 VWAP 處形成這些反轉形態,尤其是與前一交易日高/低點、費波南奇回檔位等共振的位置。
停損設置:邏輯為先
當反轉形態確立後,停損可設在該蠟燭影線之外,略微超過 VWAP 水準。
這麼做能防止價格稍微探穿 VWAP 時被提前洗出。若影線過長導致風報比不佳,則應考慮避開或改用更短週期(如 1 分鐘圖)進行微調進場點。
目標設定:前波高/低為參考
第一個合理的獲利目標是稍早一波的前高(做多)或前低(做空),這些是價格技術面上的關鍵節點,可讓你在市場進入震盪前鎖定部分利潤。
若行情明顯順勢推進,則可將初步價格推升幅度自 VWAP 開始測量,並向上投射當作第二目標。
實例分析:
EUR/USD(5 分鐘圖)
此例中,當日主趨勢為空頭。價格回測 VWAP 後出現小型雙頂反轉形態,成為清晰的空頭入場點。
過往表現並非未來結果的可靠指標
ARM(5 分鐘圖)
此例中,ARM 開盤強勢上攻,隨後在 VWAP 處築底。注意價格開始出現長下影的反轉蠟燭,形成多頭入場機會。
過往表現並非未來結果的可靠指標
兩個不可忽略的進階條件
1. 時間點很重要
不要在開盤前 10 分鐘或收盤前 10 分鐘操作這策略。VWAP 需要時間發展出意義,市場也需有足夠波動空間來展現趨勢。
最佳交易時間通常落在盤中中段——早盤波動已消化完畢,方向初步明朗。避免於重大數據或央行消息前後操作,除非這是策略的一部分。
2. 日線結構的確認
在進行日內操作前,先拉回看日線圖。你是否在一個剛跌破支撐的日線空頭趨勢中尋找做多的 VWAP 拉回?或是在明確多頭趨勢中找回測做多?
強勢的 VWAP 拉回策略往往出現在與日線趨勢一致、並接近市場關鍵位置的情境中。切記:順著市場阻力最小的方向走,成功率更高。
這套策略操作簡潔,執行有據,是日內交易者穩定操作的有力工具。
免責聲明:本資料僅供信息和學習用途。提供的信息不構成投資建議,也未考慮任何投資者的個人財務狀況或目標。任何涉及過去表現的信息均不可靠地指示未來結果或表現。社交媒體渠道對於英國居民不適用。差價合約和差價交易是複雜的金融工具,因杠桿效應而伴隨著快速虧損的高風險。82.67%的零售投資者在與本提供者交易差價合約和差價交易時虧損。 您應考慮您是否了解差價合約和差價交易的運作方式,並且是否能夠承擔高風險以避免資金損失。

BTC日內交易短線交易週末交易日內交易規劃
關鍵價格H6-KEYPRICE(102335.3)
沒有支撐偏見空
帶量反轉有機會長多
其餘時機PDH或PDL拿掉後觀察反應做短單
Day trading planning
Key price H6-KEYPRICE(102335.3)
No support bias
There is a chance for a long-term reversal with volume
At other times, take out PDH or PDL and observe the reaction to make short orders

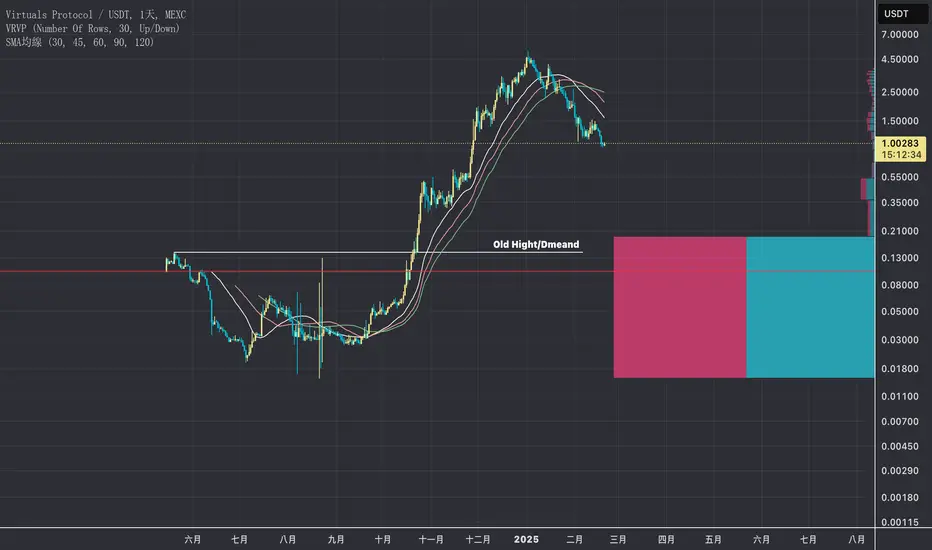
Virtuals走勢與未來嗨嗨 大家好啊
Virtuals由高點下跌近百趴 市場熱度迅速下降
今天小弟斗膽跟大家討論一下 Virtuals還有沒有繼續上漲的可能
那我們就開始吧
首先先由大的週期開始瞧瞧
在上篇文章中有探討過 山寨季還會不會到來 (歡迎看官參閱)
這裡直接講結論 小弟認為 山寨季仍然會到來
而25年主敘事是AI恰巧Virtuals可以搭上這班順風車
再來由技術線圖來觀看
均線由多頭排列後迅速下降 不過由於處在較為早期的回調階段
因此透過均線型態目前無法得知太多
所以這次我們改透過VP(Volume Profile)觀查(紅線處)
POC剛好處在OH(Old Hight)附近 因此可以得知價格確實是積累後噴出
不過由於 處在早期回調 因此僅能粗略的先將此處視為潛在的回調末端點位
最後聊聊催化劑
Virtuals是一支AI敘事的標的 最近還跨足NBA
催化劑的重點會在於上交易所以及AI相關的發展影響
以及在運動相關的領域發酵
最後當然是跟著山寨季一同爆發
文末做個小總結
大週期:仍偏向看多
技術線圖:初期回調僅能大概猜測回調末端為下方POC及Demand
催化劑:AI相關領域再爆發/上所/山寨季
最後跟大家聊聊對於這種暴漲幣的看法
通常在FOMO階段價格會快速飆漲 隨後進入回調段 最後進入冷靜期(盤整)再快速飆漲
這種幣的迷人之處在於倘若你沒有在對的位置耐心等待 後續通常只有跟著FOMO的份
市場始終如一 機會也永遠都在
上述都是小弟的看法 (所以當然不是投資建議!)
隨時有可能被市場啪啪打臉
我也相信沒有任何人可以真正的預測市場
發表這篇希望拋磚引玉 可以藉此引出更多的看法
感謝看到最後的你 歡迎底下留言彼此討論
要回牛了嗎? Turn Back yet?
Target still there~
傳統的看跌9月過了
說實話 我這波沒有賺到上升的波段
主要除了對於股市市場過熱感到憂慮
另外就是看走眼
The traditional bearish September has passed.
To be honest, I didn’t make any profit from this upward trend.
Mainly because, aside from concerns about the market being overheated, I misjudged the situation.
不過對於沒有做到這個上升波段
其實我並沒有後悔
因為清空的小幣在這段時間沒有太大的漲幅外
其實很多都是跌多於漲
而幸運的是 我有在預估的高點成功開空 目前還在盈利中
這波的跌幅
有幾個關鍵位置及型態需要關注
分別是
However, I don’t regret missing out on this upward movement.
Most of the smaller coins I cleared out didn’t experience significant gains, and in fact, many dropped more than they rose.
Fortunately, I successfully opened a short position at a predicted high point, and I’m still in profit.
As for this downward trend, there are a few key levels and patterns to watch:
60000 這個是傳統上 我們會說的整數關卡 但是對我來說引力不強 只是會停頓一下 繼續選擇方向 這邊注意一下RSI(橘色箭頭) 跌破就往下繼續看 如果能守住 並且帶有量能上攻 那這段跌幅應該就可以安全度過 (注意62418這邊附近有沒有突破)
60,000: This is a psychological level, but it doesn’t have a strong pull for me. It might just pause here before choosing a direction. Pay attention to the RSI here (orange). If it breaks below, continue looking downward. However, if it holds and shows volume on the upward move, this drop should be safely overcome. (Pay attention to whether there’s a breakout around the 62,418 level)
58161 這邊要注意 如果沒有守住 可能會加速下跌 這邊要配合 BT line 這邊也是很多大V看的位置 我個人會在這個位置也有所操作 但不會是我主要操作目標
51000/52730 這裡是我預期比較有可能會到的位置 一方面是通道底部(破底) 一方面跟之前預估(綠)的位置剛好可以形成雙底 另外注意橘色虛線
注意到了嗎。這個是這波上漲的底部
Pay attention to the 58,161 level. If it doesn’t hold, the decline could accelerate. This level should be considered along with the BT line. It’s also a key level that many major analysts are watching. Personally, I will take some action at this level, but it won't be my primary target for trading.
51,000/52,730: I expect it to reach this level, as it's the bottom of the channel (a potential breakdown). Additionally, it aligns with the previously estimated level (green), which could form a double bottom. Also, take note of the orange dashed line—this marks the bottom of the recent rally.
而按照這段時間 比較大型的回調都不會到底 所以我預估應該到這邊為止
Based on recent larger corrections, they usually don’t reach the bottom, so I predict this movement will stop around here.
47000 假如不幸 51000這個位階沒有守住 接下來或許就是要走一個比較大級別的路徑
47,000: If unfortunately, the 51,000 level doesn’t hold, then the next step might be to follow a larger trajectory.
大型通道
破底後45000~46000左右拉回 然後往上攻到通道上緣
破底後沒有拉回 很有可能就是30000見
In the larger channel, if it breaks down, there might be a pullback to around 45,000–46,000 before attempting to push up to the upper edge of the channel.
If there’s no pullback after breaking down, it could possibly drop to 30,000.
47000這個位置我認為可以參考 但是會發生的機會性目前不高
只是當下如果真的發生 可能會發生什麼情況先說明一下
I think 47,000 is a reference level, but the chances of it happening are currently low.
However, if it does occur, this is what I foresee happening.

BTC Bear Attack?
這個是之前的規劃
現在來複習一下
上次最後一段我提到
”目前規劃大致上有4個路徑規格 可以參考
而機率上 紫色路徑的機率很高
原因是這個路徑符合了4個測量方式
但是也因為太過符合分析
是否有可能是一個陷阱?
不管如何依然按照紀律執行即可
而現在有沒有機會只是超跌 馬上要進行反轉
這個可能性不能說沒有
但是需要時間去消化情緒
個人是有在今天進場買入
主要是因為這邊算是一個潛在反轉區
但是如果情況持續惡化或者是無法有效突破下降趨勢線(橘色)
我會在跌破下降通道後暫時離場避險
“
回到圖面上
我在7-4號 買入後
隔日又殺一根 後開始反彈
這時我觀察的是黃色及白色預測線
但是量能上明顯對不上
所以我很幸運的在進入三角區間後
設立了一個停損位置 7-25號的低點
到此
我們可以先拿掉黃白色
This was the previous plan.
Let's review it now.
In the last section, I mentioned:
"Currently, there are roughly four path scenarios to consider.
Statistically, the probability of the purple path is high because it matches four measurement methods.
However, because it fits the analysis too well, could it be a trap?
Regardless, we should still execute according to discipline.
Is there a chance that this is just an overshoot and a reversal is imminent?
This possibility cannot be ruled out, but it will take time to digest the sentiment.
Personally, I entered the market today because this is considered a potential reversal area.
However, if the situation continues to deteriorate or if it fails to effectively break through the descending trendline (orange),
I will temporarily exit to hedge when it breaks below the descending channel.
"
Back to the chart: On 7/4, after I bought in, there was another drop the next day, followed by a rebound. At this point, I was observing the yellow and white prediction lines, but the volume clearly did not match. So I was fortunate enough to set a stop-loss position at the low point of 7/25 after entering the triangle zone.
At this point, we can remove the yellow and white lines.
接下來原則上 我們剩下
1.我之前偏向的紫色(紅色)
2.綠色 (現在的位置)
3.藍色
有鑑于綠色目前看起來有機會
我也另外把這個劇本的目標放上來
時間點沒錯剛好就是11月大選前
這也是為什麼我會在今天買進的原因之一
當然 我也會關注是否會在下探
走到紫色及藍色的劇本內
看下圖 你就會懂我的顧忌
Next, we are left with:
1 The purple (red) path I previously favored
2 The green path (current position)
3 The blue path
Given that the green path currently seems promising, I have also included the target for this scenario. The timing is just right before the November election, which is one of the reasons I bought in today.
Of course, I will also be watching for potential downturns into the purple and blue scenarios.
Looking at the chart below, you will understand my concerns:
另外 主圖這邊 我提供一個有可能出現的走勢
當然 這個只是一個臆測
但是依照時間推算 很有可能發生
Additionally, in the main chart here, I am providing a possible trajectory that might occur. Of course, this is just speculation, but based on the time calculation, it is very likely to happen.

Weekly Bias 2020428日線bias:
1. 下方有Volume imbalance流動性缺口,有機向下向取流動性
2. 當取完流動性後,看是否有站穩中線缺口位置,再往上突破
Bias 先空再多,挑戰前高

DJI/DXY b4 the electionContinuation of the previous analysis:
Stopping when hitting the bottom is not a bad thing. The worst scenario is continuously pushing, resulting in a heavier fall without a bottom line. Short-term consolidation or a small decline may provide an opportunity for rotation and increased momentum. However, it still depends on the short-term trend.
Especially with the election at the end of the year, an endless upward trend is not realistic. Therefore, some volatility in the short term is necessary for a healthy market.
Possible scenarios before the election: ABC
Starting with the simplest, MODEL C. If, inadvertently, even the Last Line of Defense is breached, it's almost time to meet C, especially when even the orange line cannot be held. Of course, there are still some defensive lines in between, but the chances of holding them are slim.
This is the worst-case estimate and currently the least likely scenario. However, it's important to take precautions against expecting a rebound and stubbornly holding on, leading to unnecessary losses.
Model A/B:
The pullback point is the first respective box, then moving upward to touch the upper side, and then downward to touch the lower side. This needs time for verification. These are the operational paths I am preparing for before the election, with Model B being the scenario I consider more likely to occur.
In the short term, I won't enter the market. I cleared most of my positions last week. Unless next week consolidates with a certain volume release, I will at least wait until touching A before taking action. Additionally, it depends on whether DXY can continue to move downward.
延續上篇的解析
碰到底就停 不算壞事
最怕的是一直衝 反而跌的更重及沒有底線
短期盤整或小跌反而可能換手 增加動能
但是還是要看短線的走勢
尤其是大選在年底
要無止境的上攻是不現實的
所以短線上還是需要一定的波動才健康
選前可能走勢
ABC三種
先從簡單的來說 MODEL C
如果不小心連 Last Line of Defense
都破 那差不多要去見C
尤其是連橘線都守不住的時候
當然中間還是有些防線
但是能守住的機會不大
這是最差的預估 也是目前比較不可能會發生的事情
但是要先打個預防針
怕有預期反彈 而死抱不放 造成不必要的損失
Model A/B
回調點就是第一個各自方框
然後在向上去摸上方
再接下去摸下方
有待時間驗證
不過這些就是我未來到大選前預備的操作路徑
而ModelB會是我預期比較可能會發生的情況
短線內 我暫時不會入場
我在上禮拜已經出清了絕大部分倉位
除非下禮拜能盤整且有一定的量能釋出
不然最起碼我會等到觸碰到A才會有所動作
另外就是要看DXY是否能繼續向下
DXY:
The previous Route 1 is clearly not viable; there's a chance of Route 2. Currently, it seems like a short-term rebound, but there is pressure from the previous low, and these days it has shown weakness. Therefore, it seems likely to move towards 99, and it might even reach the previously estimated 97. If DXY continues to move downward next week, it can generally be inferred that there is a higher chance of the stock market continuing to rise.
DXY
之前的Route 1 明顯不是
看來有機會走Route 2
目前看短期回彈
不過看起來前低有壓力 且這幾天呈現弱勢
所以看來還是會邁向99
甚至有可能會去到之前預估的97
如果下禮拜DXY果真繼續向下
那大致上可以判斷股市能續漲的機會比較大

BTC fake new bull好久沒有特別寫一篇BTC
今天來寫一下為什麼我上一篇寫到有機會到38000
特別是經歷了昨天的fake new bull
先說一下我的觀點 很有機會再上攻 但是要配合美股
而且攻完後很有機會像我先前說的 到點立即瀑布
另外一個滿足的條件是我認為需要再回測一波
it's been a long time since I wrote a special piece about BTC.
Today, I'll talk about why in my previous article, I mentioned the possibility of it reaching 38,000, especially after experiencing the fake news bull market yesterday.
First, let me express my viewpoint. There is a good chance for another upward move, but it would likely require alignment with the performance of the U.S. stock market. Furthermore, after this potential upward move, there is a high likelihood of a rapid decline, similar to what I previously mentioned as an BNC:BLX abrupt 'waterfall' scenario
Another fulfilling condition is that I believe there needs to be another round of retesting
“前情提要” "Previously"
BTC
最近上下插針的很嚴重
主要是流動性問題
中長期來說分歧很大
建議是短線操作
因為在流動性不足的情況下
我認為所謂的牛要回來很困難
因為連股市都不好了 要資金進來更難
會有所謂的小瘋牛我同意
但是目前情況真牛不可能
我個人估計 +-38500 大約是可能潛在的頂部
但是時間上有點難達成了
尤其是目前情勢上有困難
Lately, there has been a lot of volatility.
Mainly due to liquidity issues.
In the medium to long term, there is a lot of divergence.
My recommendation is short-term trading
because in the absence of liquidity,
I believe it's very difficult for the so-called bull market to return.
Even a small "crazy bull" I agree with,
but currently, a true bull market is unlikely.
I personally estimate around +-38500 is a possible potential top,
but it's a bit difficult to achieve, especially given the current situation.
我先來肢解一下我的方式
先設定一下POE 2020/11/26-今天
然後設置水平線標記
First, let me break down my approach. I'll start by setting a timeframe for POE from November 26, 2020, to today, and then I'll place horizontal line markers.
接下來/And
2020/11/26-2022/05/12
2022/05/12-Today
做完後可以得到一份完整的POE圖表
接下來就是畫趨勢線
我個人一直認為2021-9到12月是假突破
所以我的趨勢線可能會不一樣
但是請你慢慢看下去
另外前底部我是2021-1-4號為起點 連到5-19底部
After completing all step, you can get a complete chart of POE. Next is to draw a trendline. Personally, I've always believed that September to December 2021 was a false breakout, so my trendlines might be different. Please take your time to look at it. Additionally, for the previous bottom, I use January 4, 2021, as the starting point and connect it to the bottom on May 19.
趨勢線完成後 請使用Fib 阻力扇
沿著趨勢線畫一道
After completing the trendline, please use the Fibonacci retracement fan along the trendline
然後在底部 (量最大)
連上2023-3月回測的底部
在一道阻力扇
Then, at the bottom (with the highest volume), connect it to the bottom from the March 2023 retest and draw another Fibonacci retracement fan
之後先把阻力扇關掉 留下趨勢線
我們知道通常三角收斂表態後 開口等於力道
請看白線
Next, turn off the Fibonacci retracement fans and keep the trendline. We know that usually, after a triangular convergence, the opening signifies strength. Please see the white line
這邊證明了 教科書是有用的 (笑)
This demonstrates that textbooks are useful (chuckles).
那是否可以用來推論 2021/7月的上漲幅的 (藍線)
同時可以把之前的POE打開一起看
是否發現這個區域 (38317-40151)
非常的糾結
配合上傳統11-12美股轉強加上選舉因素
我才會認為有一個漲幅空間
Can we use this to infer the upward movement in July 2021 (the blue line)? You can also open the previous POE chart and see if you notice this range (38317-40151). It's quite tangled, combined with the traditional strength in the U.S. stock market during November-December and election factors. This is why I believe there is room for an upward movement.
接下來在打開阻力扇
通常上下趨勢交界的時候都有比較大的波幅 只是沒想到會是fake news
但是這證明了一件事情
這個市場目前是被嚴重操作
以目前的情況我認為年底前
配合美股還有 機會 上漲
區域範圍就如我上篇提到的38500 (38317-40151)
但是壞新聞來了
如果局勢繼續走低 尤其是美國情況無法短時間轉向
國際紛爭無法有共識
最壞情況請看下圖
尤其如果真的走向我提到的失落10年
(話說 最近華爾街也開始有人提到這個觀點)
However, this proves one thing: the current market is heavily manipulated. Given the current situation, I believe there is a chance for an upward movement by the end of the year, in the range as mentioned in my previous article, 38,500 (38317-40151).
But here comes the bad news. If the situation continues to worsen, especially if the U.S. situation doesn't turn around quickly and there is no consensus on international disputes, please see the worst-case scenario in this chart. Especially if it truly leads to the 'Lost Decade' as I mentioned. (By the way, recently, even Wall Street has begun to discuss this possibility.)
當然這個會是很極端的情況下
需要很多情況配合
只是單純分享一下
最壞可能會到什麼程度
Of course, this is an extremely extreme scenario that requires a lot of conditions to align. I'm just sharing what the worst-case scenario might look like."

DXY/DJI/SPX/NDQ/CryptoDXY
之前預估的價位很靠近了
目前有想反彈的跡象
大方向預測兩個可能性
看下禮拜情況再調整
DXY
The previously estimated price is very close now.
Currently, there are signs of a potential rebound.
In terms of overall direction, there are two possibilities.
We will assess the situation next week and make adjustments accordingly.
3大
FOMO
都逼近甚至突破臨界值
需注意
The 3 majors (FOMO) are approaching or even breaking critical levels.
Caution is advised.
DJI
再度要來挑戰測試 一般普遍市場算起來應該是9次
不過我個人認為一次都還沒 (虛線4)
個人看法這次有機會攻過4
配合市場量能或許能看2
但是接近3應該會短暫回調
3721這條還是很好用 跌破後都可以嘗試做空
但是最好不要跌過1
DJI
Once again, it is about to test and challenge a level. Generally, it should be the 9th time in the broader market perspective, but personally, I don't think it has even tested it once (dashed line 4).
In my opinion, there is a chance of surpassing 4, and with market volume, we might see 2. However, near 3, there might be a temporary pullback. The 3721 level is still effective, and shorting can be attempted if it breaks below. But it is best not to drop below 1.
SPX
上次給的線都算準
不過還沒到預估價格範圍
來個小回調再上攻也是合理
但是大原則還是不過1
然後小牛結束
(甚至摸不到)
SPX
The previous lines provided were accurate, but the price range hasn't been reached yet. A small pullback followed by an upward move would be reasonable. However, the main principle is not to go below 1, and then the minor bull run ends (or maybe doesn't even touch it).
NDQ
預測區域上下緣看來蠻有效的
下禮拜關注是否能再區域中徘徊
雖然不排除能續攻破新高
但是現實面上有困難
破1見橘色區域
再看情況操作
NDQ
The predicted range's upper and lower boundaries seem quite effective. Next week, we will observe whether it can hover within the range.
Although it is not ruled out that it may continue to break new highs, there are practical difficulties. Breaking 1 would lead to the orange zone, and then we will assess the situation for further actions.
Crypto
最近牛回來的氣息非常濃烈
說實話我也fomo抓了一些單
不過居高思危
目前上方頂部普遍有幾個預測點 我列出來給大家參考
35000/38000/45000
我個人是看 橘線1是一個關卡
2是頂部
3如果運氣好事回調線
反義詞就是下去就好笑
如果跌破4
很有可能就是小牛結束
Crypto
Recently, there is a strong sense of the bull market returning. Honestly, I also succumbed to FOMO and entered some positions. However, caution is necessary when the market is at a high level.
Currently, there are several projected levels at the top. I have listed them for your reference: 35000/38000/45000.
From my perspective, the orange line 1 is a checkpoint, 2 is the top, and if lucky, 3 could be a pullback line. The opposite scenario would be humorous if it goes down. If it falls below 4, it is highly likely that the minor bull run is over.
總論
目前金融市場一片欣欣向榮
但是有在一些主要國家走跳的人
應該不難發現或許金融遊戲走的有點快
問題並沒有解決
只是被忽略
是否真能向以往一樣
讓時間沖淡一切
如果一樣
現在的確是一個入場點
但是如果只是一個短暫的煙火秀
那接下來的底會在那裡?
Overall
Currently, the financial markets are thriving, but those who observe major countries closely may realize that the financial game is progressing rapidly. The underlying problems have not been resolved; they are simply being ignored.
Whether it can follow the same pattern as before and let time heal everything remains to be seen.
If it does, then now is indeed an entry point. But if it turns out to be just a short-lived fireworks show, where will the bottom be next?

縱橫幣海:比特幣以太坊行情分析2022.8.20投資上只有壹個方向,不是做多,也不是做空,只有做對的方向。
我是縱橫幣海,壹個願陪妳東山再起的朋友。
自創《MA30戰法》,擅長BTC,ETH日內短線打板,結合趨勢中線布局
壹個人能有多大的成就,要看他有誰指點。希望我能是妳的伯樂,與妳共進退。
消息面:
8月20日消息,本周末比特幣和以太坊價格大幅下跌,BTC已損失超過7%的價值,以太坊則損失了8%左右的價值。加密分析平台Crypto quant社區經理兼分析師@JA_Maartunn表示,之所以出現這種情況,或是因爲市場出現巨額主動賣單導致。 Taker Sell Volume是市場賣出訂單量指標,包括清算、止損和手動市場賣出量的總和,本周末比特幣這項指標值達到70.09億美元,以太坊達到60.45億美元
趨勢分析:
比特幣日線價格已經確定在MA30下方,後續日內級別反彈做空就是順趨勢,周線即將迎來收線,周線上要關注22300壹線的壓制突破,後續多空力量還有扳手腕力量。沒有展望妳基本多頭大勢已去,所以BTC想要做空穩健的位置可以在22358美元做空。但就目前這個小時級別的行情來講基本上後續只會持續陰跌,激進短線現價21293可以直接空進去,看壹下行情繼續下破的情況。
以太坊上目前沒有太多的機會來講,日線上行壓制1714。昨天的1730空單沒有給到也是比較可惜,所以目前四小時當下的環境做多未滿,做空位置不佳,行情比較雞肋。若行情後續再次試探1664美元的時候布局空單可嘗試進場。今天周六就先說到這裏!
——我是縱橫幣海,壹個專注于分析的老師。有任何操作或者趨勢上有問題的朋友,都可以和我壹起交流學習操作!共同交流,共同獲利!


BTC四小時級別上升三角#BTC 四小時級別上升三角 密切觀注上升三角 15.8k 壓力區
若能順著bullish volume突破此壓力區 則新目標將能上探至 16.4k
若再次被reject 則有機會下探至 14k 區域測試此區的支撐

新冠肺炎疫情明顯刺激網上醫療需求,平安好醫生(SEHK:1833)備受注目。歐美疫情有見頂跡象,惟死亡數字仍驚人,打擊生產及消費情緒。全球經歷封城封關呆在家後,線上經濟模式於將來更被看重,線上服務成為未來增長股的主要收入模式,線上遊戲及手遊、網購包括新鮮食品、物流配送、線上醫療行業者等蓄勢待發,拆解短期受惠線上服務三隻股份。
1.騰訊手遊業務狀態回勇
受惠「宅經濟」模式,騰訊(SEHK:700)的社交平台及遊戲業務獨善其身,根據AppAnnie數據,全球首季手遊收入榜首兩位為騰訊旗下《和平精英》及《王者榮耀》。另外,調查機構Sensor Tower公布,騰訊旗下(PUBG Mobile)3月收入居全球首位,達2.32億美元,按年增長逾三倍。
有關數據反映騰訊手遊業務表現理想。騰訊年內前景仍看好,今年有更多新遊戲於內地推出,包括兩款DnF Mobile (Nexon公司) 及Brawl Stars (Supercell公司)並已獲審批。由於射擊遊戲PUBG Mobile於國際市場表現成功,催生三款新遊戲推出,當中包括League of Legends: Wild Rift (LOL)在內,以 DnF 及LOL較受注目。
除了手遊業務被看好之外,集團網路廣告收入料續增,雖然疫情令集團的媒體廣告受阻,而有關業務又需要同媒體分成收入。但社交及其他廣告收入增長空間最大,毛利水平更高,去年末季社交廣告收入更增長37%,由於微信及WeChat活躍用戶己高達11.6億,在微信朋友圈及小程序支持下,相關社交廣告收入可望提升,不受疫情影響。
透過社交平台、電商生態圈(包括朋友圈、微信公號、小程序)集團讓更多商戶加入直播內容,不單增推廣費收入,更推高社交及手機網絡廣告收入。集團早前斥2.6億美元入股虎牙成控股股東,強化直播廣告收入。
2.阿里網購以外三大增長點不容忽視
今年1、2月內地爆發新冠肺炎疫情打擊線下零售業,雖然阿里巴巴─W(SEHK:9988)的主打網購包括淘寶及天貓自然因利成便,但亦因封城影響物流配送。
根據內地數據,主要的電商的包裹付運量於3月仍有增長,於2月底內地全國物流配送已大部分回復,於3月內地網購遇到物流問題大多已解決,對電商影響有限。淘寶於2月網上瀏覽時間只按月輕微下跌;天貓於三八婦女節銷售有增長。而新推出淘寶特價版App,帶有正面刺激。
經過是次疫情,內地的消費模式更大改變,未來一定更倚靠線上服務及數字經濟,有利阿里巴巴的網購以外其他發展,旗下的盒馬、菜鳥物流及雲計算可望成為疫下的贏家。
以盒馬鮮生為例,以創新數據及技術銷售生鮮食品,網絡及實體店並存,去年底有197分店,年底料增加逾100間店。疫情改變消費模式有利菜鳥及零售新投資。
至於雲業務,阿里巴巴的「釘釘」為智能移動溝通工作平台,有關溝通工具已於內地企業及學校廣泛使用,每日活躍用戶達1億,有利拓展企業終端服務,而目前集團的雲業務已處內地市場領導地位。
雖然去年12月底止第三季度雲計算只佔集團總收入7%,但收入按年大升62%。菜鳥物流佔收入5%,收入按年激增67%(3),以網購為主的零售商業業務仍佔收入68%(4)。即使創新零售及雲計算未有盈利貢獻,但長線發展後盈利潛力巨大,收入佔比料向上。畢竟股票投資是投資前景。
3.平安好醫生受惠在線醫療需求大增
新冠肺炎疫情明顯刺激網上醫療需求,平安好醫生(SEHK:1833)備受注目。集團於今年2月公布全年業績,非通用會計經調整淨虧損收窄至6.96億元人民幣。不過由於市場憧憬前景向好,目前股價較招股價54.8港元高出逾6成。
集團有兩大業務焦點是在線醫療及消費醫療。最被看好的是由AI系統推動的在線醫療業務,並與線下服務如醫院到診及藥店有協調合作。去年有關業務收入急升逾1倍,毛利率升4個百分點至44.2%,表現突出,佔收入比重為17%,反映未來有很大增長空間。
而毛利率水平第二高的是消費型醫療,為個人及企業客戶提供體檢、醫美、口腔及基因檢測等健康服務,亦為用戶提供檢查報告解讀、線下覆檢等增值服務,有關業務毛利率達36%,佔收入比重約22%。
集團健康商城業務仍為最大收入來源佔57%,去年網站成交總額(Gross Merchandise Volume, GMV)有44.5億元人民幣,升50%。
平安好醫生一站式家庭醫療服務生態圈有獨特經營模式,同行已難以加入去競爭,除了因為有平保(SEHK:2318)的2億個客戶基礎支持外,主要是因為平安好醫生的強項──在線醫療佔收入比重約17%,競爭對手阿里健康(SEHK:241)暫時未能追上。有行內人士料,以線上問診個案計算,平安好醫生於去年市佔率已達48%,已掌握領導優勢。
不過,投資該公司有數點要留意,公司極受內地醫療政策左右,雖然近期內地藥物的線上銷售政策可能放寬,而線上問診或獲醫保支持,不過政策可以是兩刃劍,轉變可帶來不利。同時該股仍未有盈利,而運營費用巨大,去年佔收入45%,需要提升效率改善。而月費用戶於去年底有近300萬,對比註冊用戶3.1億比重仍低,付費用戶轉化率為4%,變現率有改善空間。
結語
要於市場找出「避疫股」,新經濟股顯然是不錯的選擇,兩隻龍頭騰訊及阿里巴巴是穩健之選,而騰訊預測市盈率超過30倍,如何於市況不穩時,令騰訊市盈率跌至30倍以下是趁低吸納良機。而騰訊及阿里巴巴的業務亦較平安好醫生為穩健,因平安好醫生需時利潤化。
- Fool

做一名交易員,而不是一名繪圖者現有倉位更新 - 在$6800 – $7300之間買入的長期投資倉位目前浮盈40%,而在$8450買入的1小時級別倉位現在浮盈17%。無論您做的是哪一筆交易,您現在都應該已經平倉了至少30%的頭寸。
剩下的倉位建議止損仍設在$9077。為什麼$9077? 因為是在價格創新高以後的近期拐點下方 (請參見上圖)。如果不幸碰到$9077,則下一個我會有興趣的買入價約在$7700。
當存在趨勢時(例如高點和低點都越來越高),您不應該預測並假設市場將發生逆轉,除非價格”已經”逆轉。這意味著,直到近期的低點($9080)被突破之前,上升趨勢依然完好無損。許多人說,比特幣從6500開始的上漲並沒有相對應的volume,因此,這段上漲是機構所做的誤導散戶進場的行為。但是,當我們都已經鎖定了我們的利潤,上漲真假與否跟我們又有什麼關係呢?
我看到許多圖表專家畫出了以下的下降趨勢線(下圖)。與往常一樣,他們不會告訴你他們的進場和止損位,就好像交易只需要知道如何繪圖,如何使用波浪理論和價格預測。與其讓市場來告訴他們價格怎麼走,他們總是試著找出看漲/看跌的理由來解釋他們早已存在的先入為主的對虛擬貨幣市場的看法。不幸的是,新手交易者總是被那些圖表所吸引住,因為他們需要有人告訴他們什麼時候買,什麼時候賣,而這些圖表對他們來說是最容易理解的。
顯然,這條下降趨勢線尚未成熟(除非價格反彈並開始遠離趨勢線)。如果您想知道如何畫一條可靠的趨勢線,歡迎查看我月初發表的文章- “我如何畫趨勢線”。
有些人說比特幣將會從目前的價格跌到$6000以下。我的問題是,如果價格從這裡開始下跌,機構在$6500左右買進的倉位出貨了嗎?自從最近的$6500上漲以來,您能看到任何機構出貨的痕跡嗎?如果市場現在開始橫盤整理或是價格很緩慢的一直下降,那麼,可能是機構正在出貨,而比特幣可能在不久的將來跌至$6000以下。但是直到出現機構出貨的跡象,您都只是在預測市場而不是交易市場。
如果您想在金融市場上取得成功 – 請做一名交易員,而不是一名繪圖者
之前的文章
比特幣, 買在$3,500低點 (300%利潤)
比特幣, 買在$6,800 - $7,300 (40%利潤)
比特幣, 完美預測$12,000阻力
比特幣, 照預期從$12,000跌到$7,000 (40%下跌)
比特幣, 照預期從$6,500跌到$3,500 (40%下跌)
比特幣, $6,220買入, 目標$8,480 (36%利潤)
比特幣, 完美重新購入
免費教學
2618型態
從上而下的分析
我如何畫趨勢線

[BTC/USD] Last Ditch of BTC Price 比特幣的終極保衛戰Last week (9/3-9/9) BTC price experienced a huge decline, due to too many negative news was released. Observed from the weekly price trend, the highest point of each wave is getting lower and lower and simultaneously the trading volume does not decrease. This means some bullish investors might have lost confidence. Besides, the price formation has become a triangle. The support point still locates on 5800, which is the last ditch for BTC price. If the support is broken, the next support point will be 4000. Then it will have negative influence on BTC price. Thus, the next two weeks will be a key moment to keep an eye on.
1. 本周(9/3-9/9) 受到眾多負面消息影響,比特幣價格大跌許多,就週線線型而言,高點越來越低,但成交量卻沒有縮減,量價沒有配合,多方信心有鬆動的跡象,對於未來發展並不是一件好事。
2. 週線線型而言,儼然成為三角旗型,兩周內發展是關鍵,支撐位置在5800,如果5800跌破,將使線型完全轉空,直到4000才會有另一個支撐。
