Functions
Can I use a variable length in functions?
Many built-in technical analysis (TA) functions have a length parameter, such as ta.sma(source, length).
A majority of these functions can process “series” lengths, i.e., lengths that can change from bar to bar.
Some functions, however, only accept “simple” integer lengths, which must be known on bar zero and not change during the execution of the script.
Check the Reference Manual entry for a function to see what type of values a function can process.
Additional resources
User-defined functions
How can I calculate values depending on variable lengths that reset on a condition?
To calculate certain values that are dependent on varying lengths, which also reset under specific conditions, the ta.barssince() function can be useful. This function counts the number of bars since the last occurrence of a specified condition, automatically resetting the count each time this condition is met. There are, however, some considerations to take into account when using this function for this purpose.
Firstly, before the condition is met for the first time in a chart’s history, ta.barssince() returns na. This value is not usable as a length for functions and can cause errors, especially during execution on a chart’s early bars. For a more robust version, use nz() to replace the na return of ta.barssince() with zero for early bars.
Secondly, when the condition is met, ta.barssince() returns zero for that bar, since zero bars have elapsed since the condition was last true.
Since lengths cannot be zero, it is necessary to add one to a returned value of zero, ensuring that the length is always at least one.
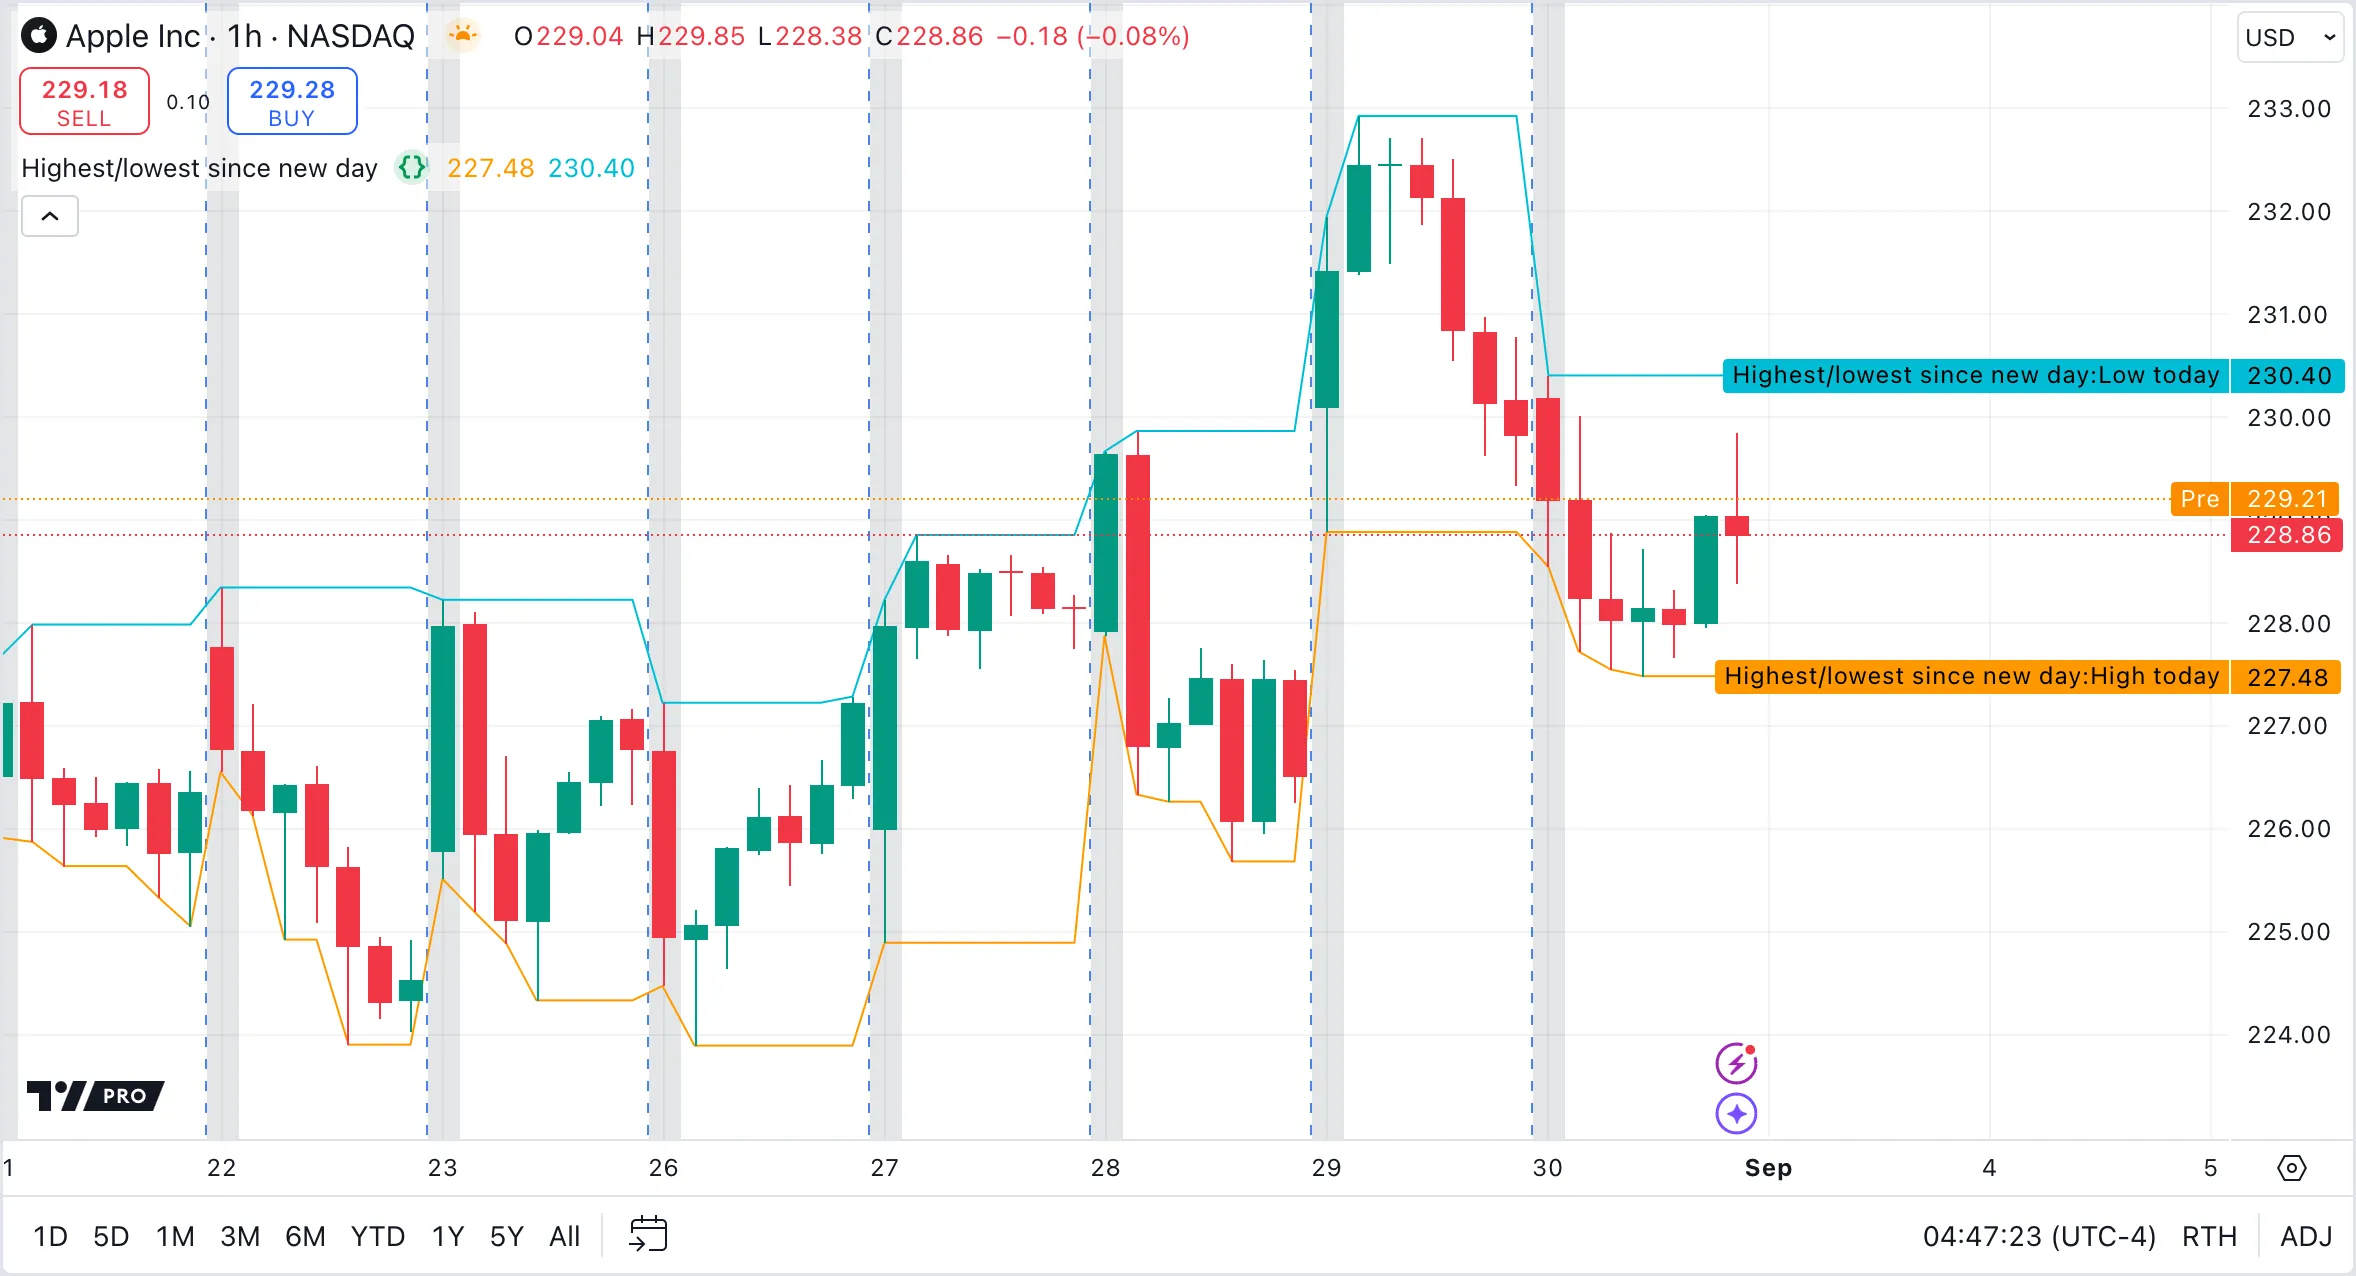
Here’s an example of how to use these principles for a practical purpose. The following example script calculates the highest and lowest price points since the start of a new day. We use timeframe.change() to detect the start of a new day, which is our condition. The ta.barssince() function calculates the number of bars that elapsed since this condition was last met. The script passes this number, or “lookback”, to the ta.lowest() and ta.highest() functions, which determine the highest and lowest points since the start of the new day:

How can I round a number to x increments?
Rounding numbers to specific increments is useful for tasks like calculating levels for grid trading, dealing with fractional shares, or aligning trading parameters to specific pip values.
In this example, the roundToIncrement() function accepts a value and an increment as parameters. It divides the value by the increment, rounds the result, then multiplies it by the increment to give the rounded value.
To demonstrate the function, the closing price is rounded to the nearest increment defined in the user menu:
How can I control the precision of values my script displays?
The precision and format arguments in the indicator() or strategy()
declaration statement control the number of decimals in the values that a script displays.
By default, scripts use the precision of the price scale. To display more decimal places, specify a precision argument that exceeds the value of the current price scale.
How can I control the precision of values used in my calculations?
The math.round(number, precision) variation of the math.round() function rounds values according to a specified precision.
Alternatively, the math.round_to_mintick() function rounds values to the nearest tick precision of the chart’s symbol.
How can I round to ticks?
To round values to the tick precision of a chart’s symbol, use the function math.round_to_mintick().
To convert the resulting number to a string, use str.tostring(myValue, format.mintick) to first round the number to tick precision and then return its string representation, where myValue is the number to convert into a rounded string.
How can I abbreviate large values?
There are different ways to abbreviate large numerical values, such as volume. For instance, the number 1,222,333.0 can be simplified to 1.222M. Here are some methods to accomplish this:
Apply a global setting
format = format.volume within either the indicator() or strategy() statements. Using this setting, displays all values in the script in their abbreviated forms.
Abbreviate specific values
str.tostring(value, format.volume) function.
Use a custom function
abbreviateValue() divides the value by a power of ten based on its magnitude, and adds an abbreviation letter (K, M, B, or T) to represent the magnitude of the original value.
The function also adds a subtle space between the value and the magnitude letter. The print() function displays the value on the chart for visualization.
How can I calculate using pips?
You can use the custom function calcBaseUnit() in the following example script to retrieve the expected pip value for Forex symbols, or the minimum tick size for other symbols:
How do I calculate averages?
The method of calculating averages depends on the type of values to average.
Distinct variables
Bar prices
Series values
Custom datasets
How can I calculate an average only when a certain condition is true?
The usual methods of calculating averages, which were discussed in the calculating averages section above, apply across all data points in a range. To calculate averages of only those values that occur under specific conditions, calculate conditional averages using custom functions.
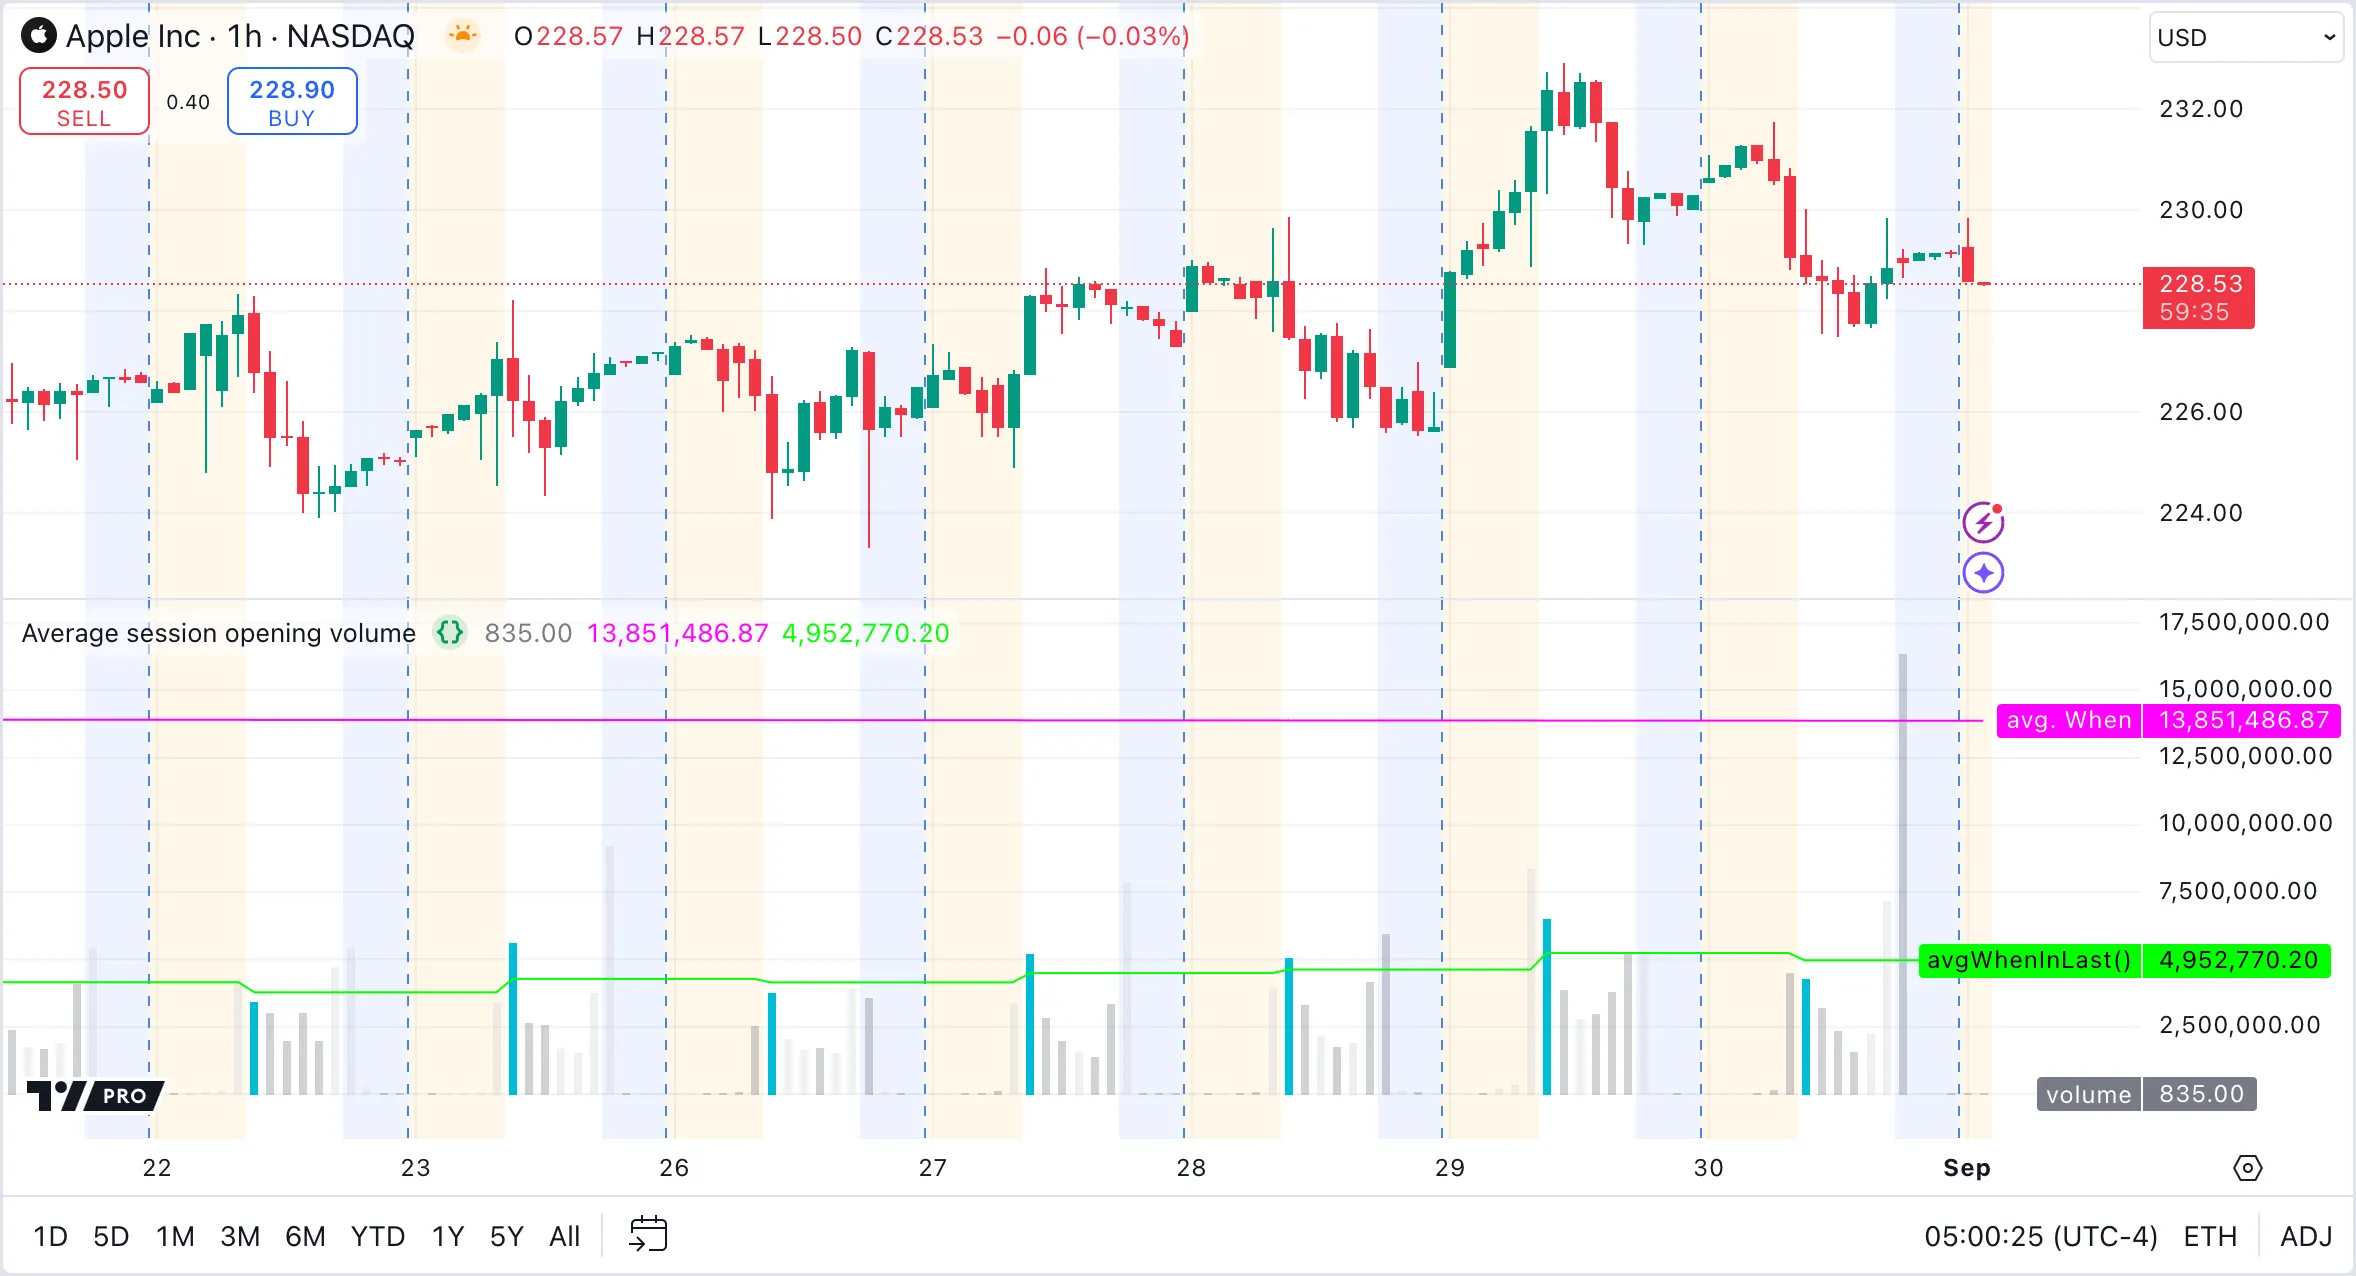
The example script below imports a library called ConditionalAverages and uses two of its functions:
- The
avgWhen()function calculates the average volume of session opening bars across the entire dataset. - The
avgWhenLast()function averages the opening volumes for the last five session opening bars.
The condition for these conditional averages is session opening bars, which we determine using the session.isfirstbar_regular variable.

How can I generate a random number?
Use the math.random() function to generate pseudorandom numbers. This example script creates a circle plot with random RGB color values and a random y value between 0 and 1:
How can I evaluate a filter I am planning to use?
To evaluate a filter, insert your filter code into the Filter Information Box - PineCoders FAQ script. This script conducts an impulse response analysis and shows the filter’s characteristics in a label on the chart.
For further details and a guide on integrating your filter into the code, refer to the publication’s description.
What does nz() do?
The nz() function replaces any na values with zero, or with a user-defined value if the replacement argument is specified. This function helps to prevent na values from interfering with calculations.
The following example script shows an exaggerated failure as a result of a single na value. The barRangeRaw variable is na only once, on the first bar, because it references a bar that does not exist, using the history-referencing operator. The alternative variable barRangeWithNz uses nz() to prevent an na value from ever occurring.
The dependentCalculation variable takes one of these values and uses it to calculate a crude average of the bar range.
If the input to this calculation is ever na, the series will be na forever after that.
Choose between the two values for bar range using the input setting, and the range either displays or not. In the latter case, the Data Window shows that the value of dependentCalculation is ϴ, meaning na.
The nz() function is also useful to protect against any potential divide-by-zero errors. It guarantees a return value even when an equation unintentionally features a zero in the denominator. Consider the following code snippet that intentionally creates a divide-by-zero scenario by setting the denominator to zero. Without the nz() function, this expression would return na, instead of zero: