Using Pine Script® strategy scripts, users can test simulated trades on historical and realtime data, to backtest and forward test trading systems. Strategies are similar to indicators, but with added capabilities such as placing, modifying, and canceling simulated orders and analyzing their results. Scripts that use the strategy() function as their declaration statement gain access to the strategy.* namespace, which contains functions and variables for simulating orders and retrieving strategy information.
Strategies support various types of orders including market, limit, stop, and stop-limit orders, allowing programmers to simulate different trading scenarios. Strategy order commands can send alerts when order fill events occur. An order fill event is triggered by the broker emulator when it executes a simulated order in realtime.
For a thorough exploration of strategy features, capabilities, and usage, refer to the Strategies section in the User Manual.
To convert an indicator to a strategy, begin by replacing the indicator() declaration with the strategy() declaration. This designates the script as a strategy.
Add order placement commands for simulating orders. Use logical conditions from the initial indicator to trigger the commands in the converted strategy.
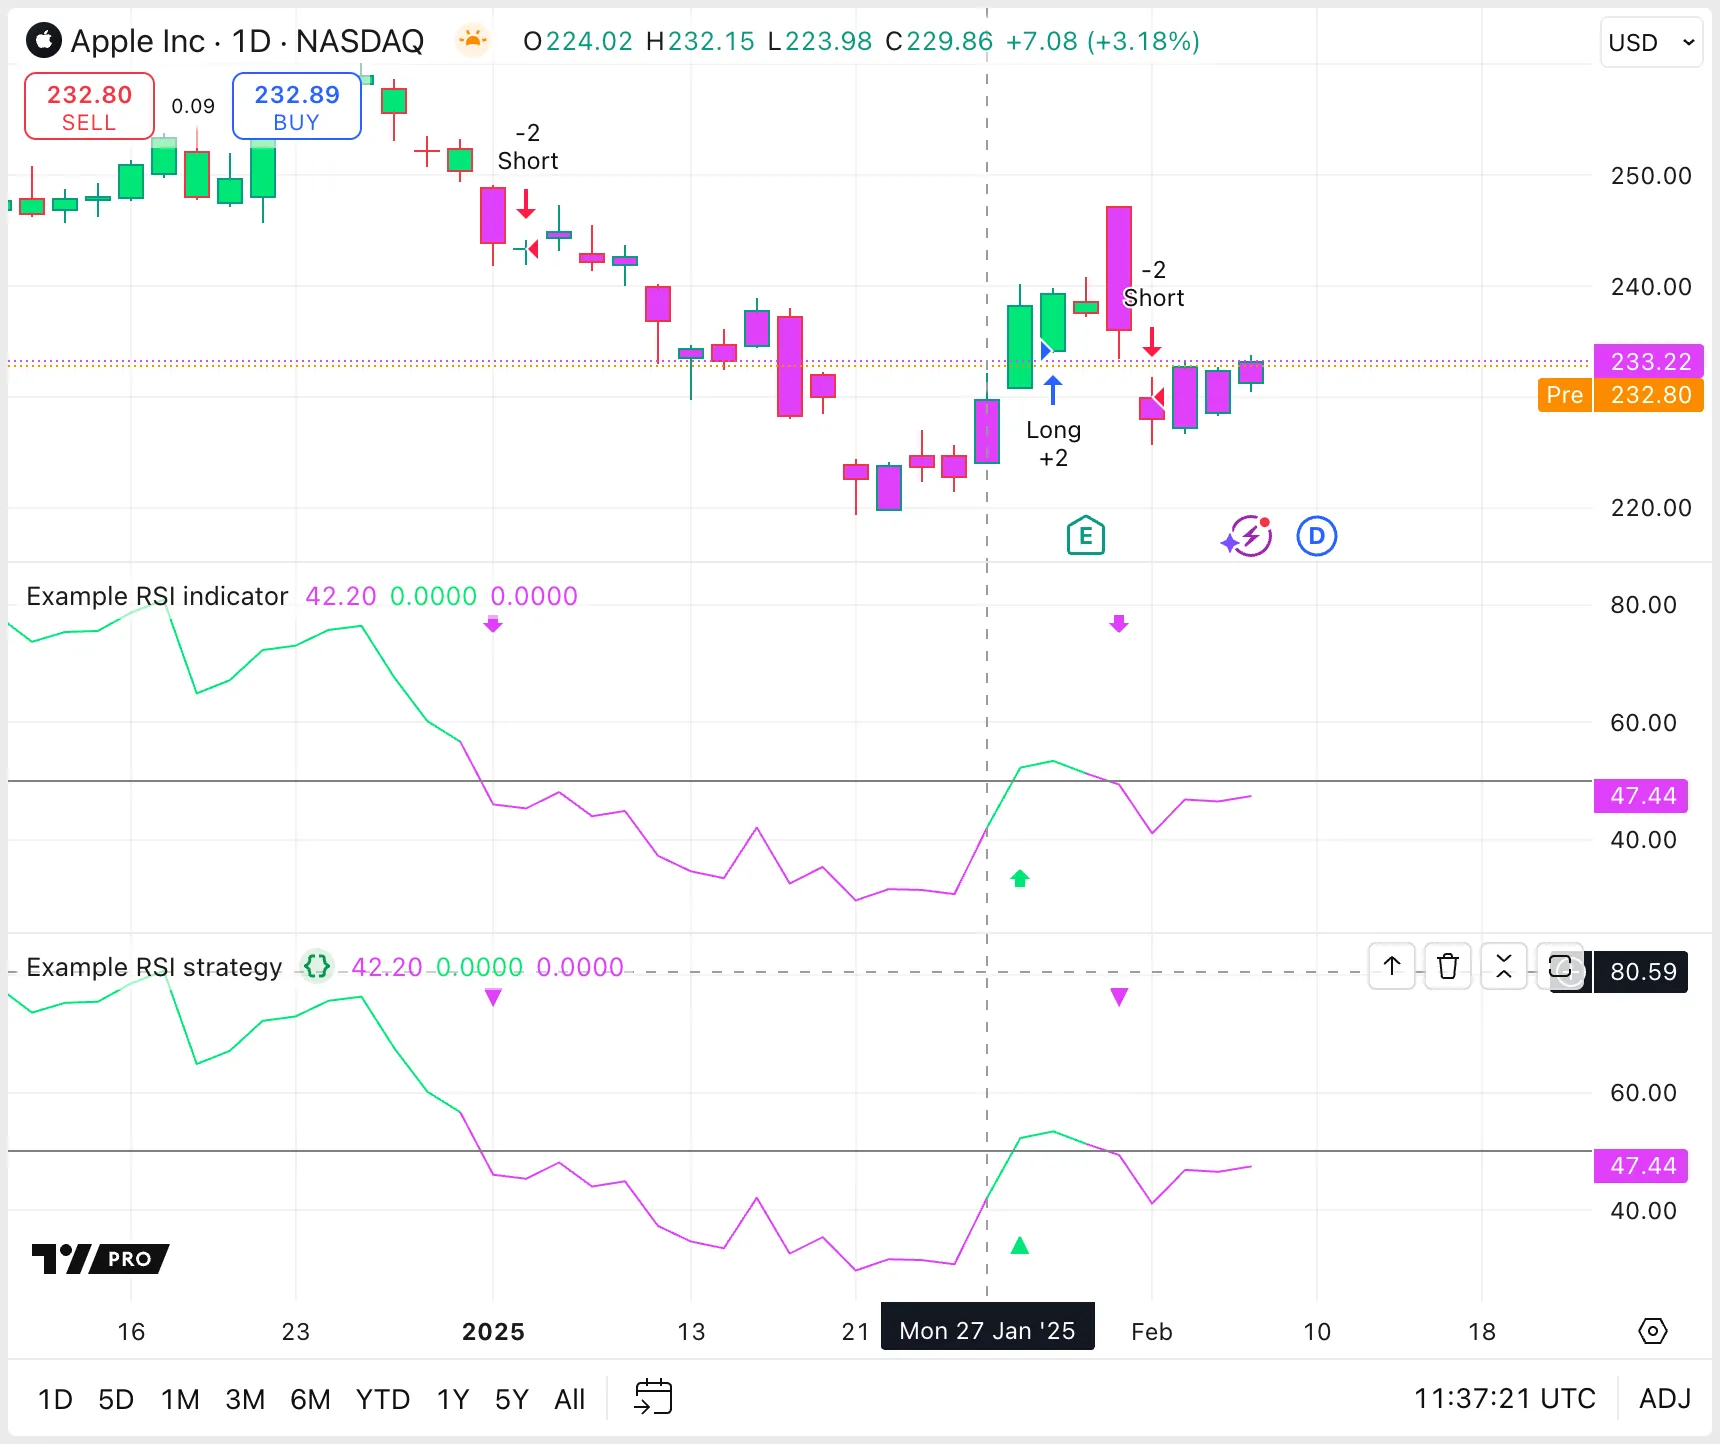
The following example includes two scripts: an initial indicator script and a strategy script converted from the indicator. We use a simple RSI oscillator as a momentum indicator to gauge the direction of a market’s momentum, with values above 50 indicating an upward (bullish) trend and values below 50 signaling a downward (bearish) trend:
The initial indicator colors the plot line and the bars on the chart in a lime color when the RSI is greater than 50 and fuchsia when less than 50. We use plotshape() to plot triangles at the top and bottom of the oscillator on bars where the RSI crosses over or under the 50 level.
In the converted strategy version, we maintain the same RSI crossover and crossunder conditions used in the indicator script. These conditions, which previously only drew the plotshape() triangles, now also trigger entry orders for long and short positions using the strategy.entry() function. A long entry is called when the RSI crosses over 50, and a short entry is initiated when it crosses under 50. A long entry cancels a short trade, and vice-versa.
Stop losses are a risk management method that traders use to limit potential losses. The strategy.exit() function sets an order to exit a trade once it hits a specified price, thus preventing the loss from exceeding a predetermined amount.
To implement a basic stop loss in Pine Script, use the strategy.exit() function with either the stop or the loss parameter. The stop parameter specifies the price for the stop loss order, while the loss parameter sets the stop loss a certain number of ticks away from the entry order’s price. Similarly, to set a take-profit level, use either the limit parameter, specifying the exact price for taking profit, or the profit parameter, defining the profit
size in ticks from the entry price.
If a strategy.exit() call includes both the stopandloss parameters, or both the limitandprofit parameters, the function uses the price level that is expected to trigger an exit first.
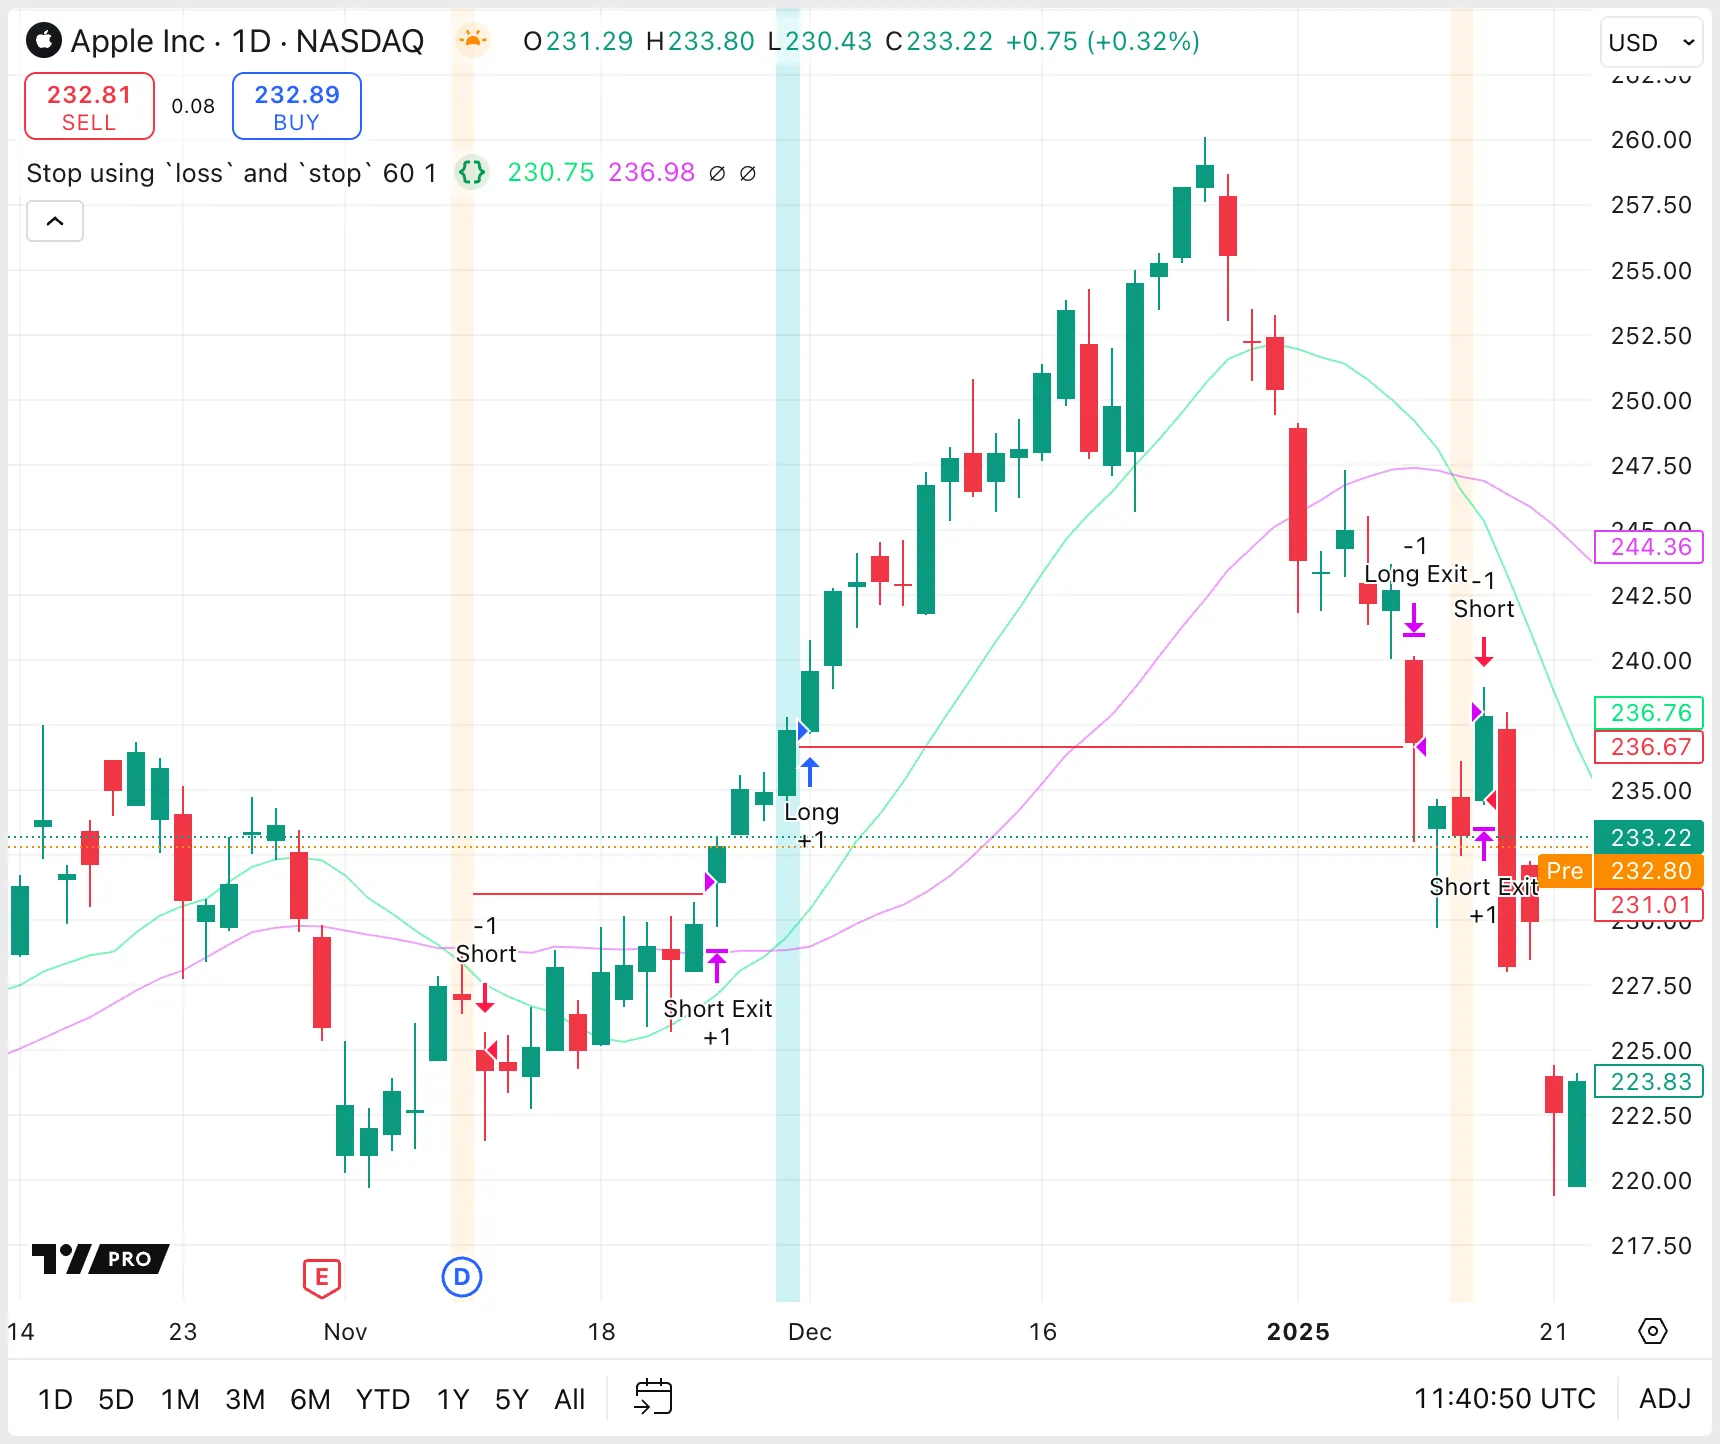
The following example script uses the tick-based loss parameter for long positions and the price-based stop parameter for short positions, and plots these stop levels on the chart.
The script enters positions on the crossover or crossunder of two simple moving averages.
//@version=6
strategy("Stop using `loss` and `stop`", overlay = true)
int lossTicksInput = input.int(60, "Stop loss in ticks (for longs)")
float atrMultInput = input.float(1.0, "ATR multiplier (for shorts)", minval = 0)
// Calculate the ATR value, adjusted by the multiplier, for setting dynamic stop loss levels on short positions.
float atr = ta.atr(14) * atrMultInput
// A persistent short stop loss level, updated based on short entry signals.
var float shortStopLevel = na
// Define conditions for entering long and short positions based on the crossover and crossunder of two SMAs.
float ma1 = ta.sma(close, 14)
float ma2 = ta.sma(close, 28)
bool longCondition = ta.crossover(ma1, ma2)
bool shortCondition = ta.crossunder(ma1, ma2)
// On detecting a long condition, place a long entry.
if longCondition
strategy.entry("Long", strategy.long)
// For a short condition, place a short entry and set the stop loss level by adding the ATR value to the closing price.
if shortCondition
strategy.entry("Short", strategy.short)
shortStopLevel := close + atr
// Apply a fixed-size stop loss for long positions using the specified input tick size in the `loss` parameter.
strategy.exit(id = "Long Exit", from_entry = "Long", loss = lossTicksInput)
// For short positions, set the stop loss at the calculated price level using the `stop` parameter.
strategy.exit(id = "Short Exit", from_entry = "Short", stop = shortStopLevel)
// Calculate the long stop loss price by subtracting the loss size from the average entry price.
// Set the price to `na` if the strategy is not in a long position.
float longStopPlot = strategy.position_size > 0 ? strategy.position_avg_price - lossTicksInput * syminfo.mintick : na
// The short stop price is already calculated. Set to `na` if the strategy is not in a short position.
float shortStopPlot = strategy.position_size < 0 ? shortStopLevel : na
// Plot the moving averages and stop loss levels.
plot(ma1, "MA 1", color.new(color.lime, 50))
plot(ma2, "MA 2", color.new(color.fuchsia, 50))
plot(longStopPlot, "Long Stop", color.red, style = plot.style_steplinebr)
plot(shortStopPlot, "Short Stop", color.red, style = plot.style_steplinebr)
// Color the background when long or short conditions are met.
bgcolor(longCondition ? color.new(color.aqua, 80) : shortCondition ? color.new(color.orange, 90) : na)
Note that:
In this example, we include from_entry arguments in the strategy.exit() calls so that each exit order closes only open trades with the corresponding entry ID. Without this argument, the exit intended for long positions would apply to both long and short positions, and the exit intended for short positions would likewise attempt to close any open position.
For more information, see the entry in the User Manual on strategy.exit().
Scripts can use different types of exits that are more advanced than simply closing the position at a predetermined level.
Bracket orders
A bracket order is a pair of orders that close the position if price moves far enough in either direction. Scripts can combine a stop-loss and take-profit order within a single strategy.exit() function call. See the FAQ entry about bracket orders for more details.
Trailing stop losses
A trailing stop loss is a stop loss that moves with price, but in the profitable direction only. To create a trailing stop, either adjust the stop price with each new bar, or use the built-in trailing stop parameters in the strategy.exit() function. Refer to the FAQ on implementing a
trailing stop loss for information and examples.
Scaled exits
Scaled exits use multiple exit orders at varied price levels. When using tiered exit strategies, which progressively scale out of a position, ensure that the total quantity of all exit orders does not surpass the size of the initial entry position. Consult the FAQ on multiple exits for more information.
Moving a stop loss to breakeven
Adjusting a stop loss to the breakeven point once a specific condition is met can help in risk management. Details can be found in the FAQ on moving stop losses to breakeven.
Adjusting position size based on stop loss
Modify the position size relative to the stop loss to maintain a constant risk percentage of total equity. For more insights, see the FAQ on position sizing.
Scripts can access the entry price for a specific trade, or the average entry price for a position.
Average entry price
The strategy.position_avg_price variable automatically updates to the average entry price of the current position. If the position consist of only one trade, the average price of the position is equal to the entry price of that single trade.
If a strategy closes a market position that consists of multiple trades, trades are closed in the order they were opened, by default. Since the average price of the open position changes according to which positions are still open, be aware of the order in which trades are closed, and if necessary, configure it using the close_entries_rule parameter of the strategy() declaration function.
Specific entry price
The strategy.opentrades.entry_price() function returns the entry price for a given trade ID. To find the entry price for the most recent open trade, and remembering that the trade indexes start at zero, use float entryPrice = strategy.opentrades.entry_price(strategy.opentrades - 1).
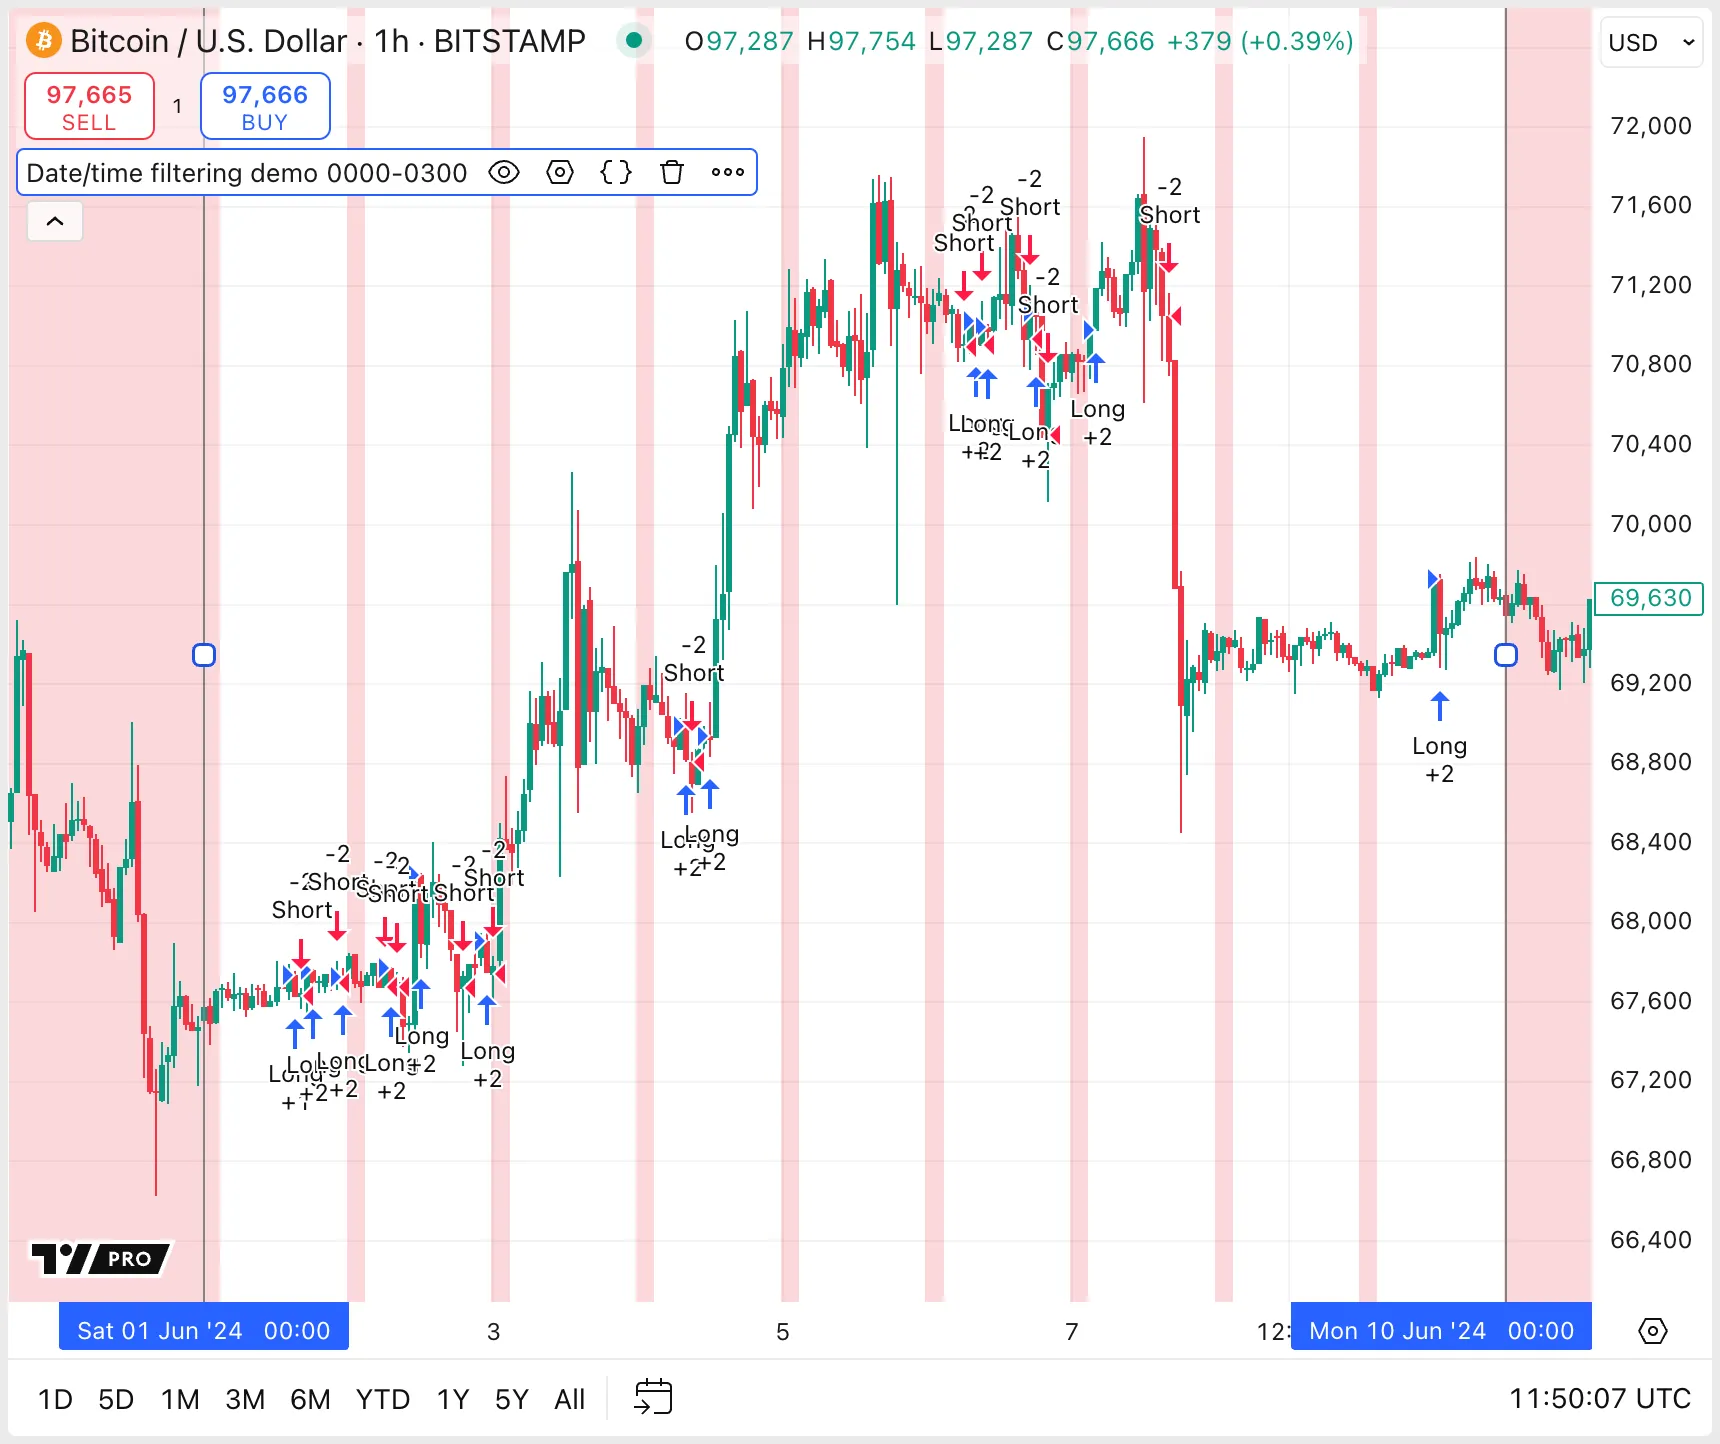
Using a date and time range filter in a strategy allows trades to be simulated only during a certain time period. Such filters can be useful to backtest specific historical periods, or to focus on particular times of the trading day.
Additionally, if the strategy sends signals for live trading, consider excluding all trades earlier than the trading start date and time, to ensure that the broker emulator starts in a neutral state.
The following example script restricts trading if a bar falls within a defined startTime and endTime, or outside of an optional intraday session window. The script colors the background red for bars that fall outside the time windows. On the screenshot, we’ve limited the trading range from June 1st 2024 to June 10th 2024, and additionally forbidden trading from 0000-0300 UTC:
//@version=6
strategy("Date/time filtering demo", "", true)
// Timezone setting for date and time calculations. Adjust to the chart timezone.
string TZ = "GMT+0"
// Define the date window, an intraday time session to exclude, and the filtering to apply.
bool useDateFilterInput = input.bool(true, "Allow trades only between the following dates (" + TZ + ")")
int startTimeInput = input.time(timestamp("01 Jan 2000 00:00 " + TZ), " Start date", confirm = true)
int endTimeInput = input.time(timestamp("01 Jan 2099 00:00 " + TZ), " End date", confirm = true)
bool useTimeFilterInput = input.bool(false, "Restrict trades during the following times (" + TZ + ")")
string sessionStringInput = input.session("0000-0300", "")
// @function Determines whether the current bar falls within a specified date and time range.
// @param startTime (int) A timestamp marking the start of the time window.
// @param endTime (int) A timestamp marking the end of the time window.
// @param useDateFilter (bool) Whether to filter between `startTime` and `endTime`. Optional.
// @param useTimeFilter (bool) Whether to restrict trades in the time session. Optional.
// @param timeSession (string) Session time range in 'HHMM-HHMM' format, used if `useTimeFilter` is true.
// @param timeZone (string) Timezone for the session time, used if `useTimeFilter` is true.
// @returns (bool) `true` if the current bar is within the specified date and time range.
timeWithinAllowedRange(
int startTime, int endTime,
bool useDateFilter = true,
bool useTimeFilter = false,
string timeSession = "0000-0000",
string timeZone = "GMT-0"
) =>
bool isOutsideTime = na(time(timeframe.period, timeSession, timeZone))
bool timeIsAllowed = useTimeFilter and isOutsideTime or not useTimeFilter
bool dateIsAllowed = time >= startTime and time <= endTime or not useDateFilter
bool result = timeIsAllowed and dateIsAllowed
// Determine if each bar falls within the date window or outside the ignored time session.
bool isWithinTime = timeWithinAllowedRange(
startTimeInput, endTimeInput, useDateFilterInput, useTimeFilterInput, sessionStringInput, TZ
)
// Calculate RSI for simple trading signals.
float rsi = ta.rsi(close, 14)
// Generate trading signals based on RSI conditions, provided they occur within the permissible date/time range.
bool enterLong = ta.crossover(rsi, 50) and isWithinTime
bool enterShort = ta.crossunder(rsi, 50) and isWithinTime
// Simulate trades only if they meet the filtering criteria.
if enterLong
strategy.entry("Long", strategy.long)
if enterShort
strategy.entry("Short", strategy.short)
// Color the background red for bars falling outside the specified date/time range.
bgcolor(isWithinTime ? na : color.new(color.red, 80), title = "Exempt times")
Note that:
We use the time() function to calculate whether bars are outside the user-defined session times. For additional details on integrating session data in Pine Script, refer to the Sessions section in the User Manual.
We set the confirm argument to true for the inputs that define the time range. When the script is first added to the chart, it prompts the user to confirm the values by clicking on the chart.
We use a constant string TZ in our script to represent the time zone (set to "GMT+0" by default). Adjust this string to the local time zone or the exchange’s time zone. We use a constant rather than an input so that we can include the time zone in input titles.
Each historical bar in a chart is composed of a single set of open, high, low and close (OHLC) data. Pine scripts execute on this data once per historical bar, at the close of the bar.
So that results are consistent between historical and realtime bars, strategies also execute at the close of realtime bars. The next possible moment for an order to be filled is the beginning of the next bar.
Users can alter a strategy’s calculation behavior by configuring strategies to process orders at the close of the signal bar instead, by selecting the “Fill orders/On bar close” setting in the “Settings/Properties” tab. Programmers can do the same by setting the process_orders_on_close parameter to true in the strategy() declaration statement:
An alternative method is to specify the immediately parameter as true in a strategy.close() or strategy.close_all function call. This setting causes the broker emulator to close a position on the same tick that the strategy creates the close order — meaning, when bar closes instead of the beginning of the next one. The process_orders_on_close parameter affects all closing orders in the strategy, whereas the immediately parameter affects only the close order in which it is used.
However, processing orders on close might not give accurate results. For instance, if an alert occurs at the close of the session’s last bar, the actual order can be executed only on the next trading day, since the bar is already closed. In contrast, the emulator would simulate the order being filled at the previous day’s close. This discrepancy can lead to repainting, where the behavior of the strategy’s simulation on historical bars differs from that seen in live trading.
Each strategy.exit() call can set a bracket order for a specific take-profit and stop-loss level.
However, if a strategy uses multiple strategy.exit() functions with the same stop level, each function call triggers a separate order (and therefore multiple order alerts). If order alerts are configured to trigger real trades, ensure that the trade system handles multiple alerts at the same stop level appropriately.
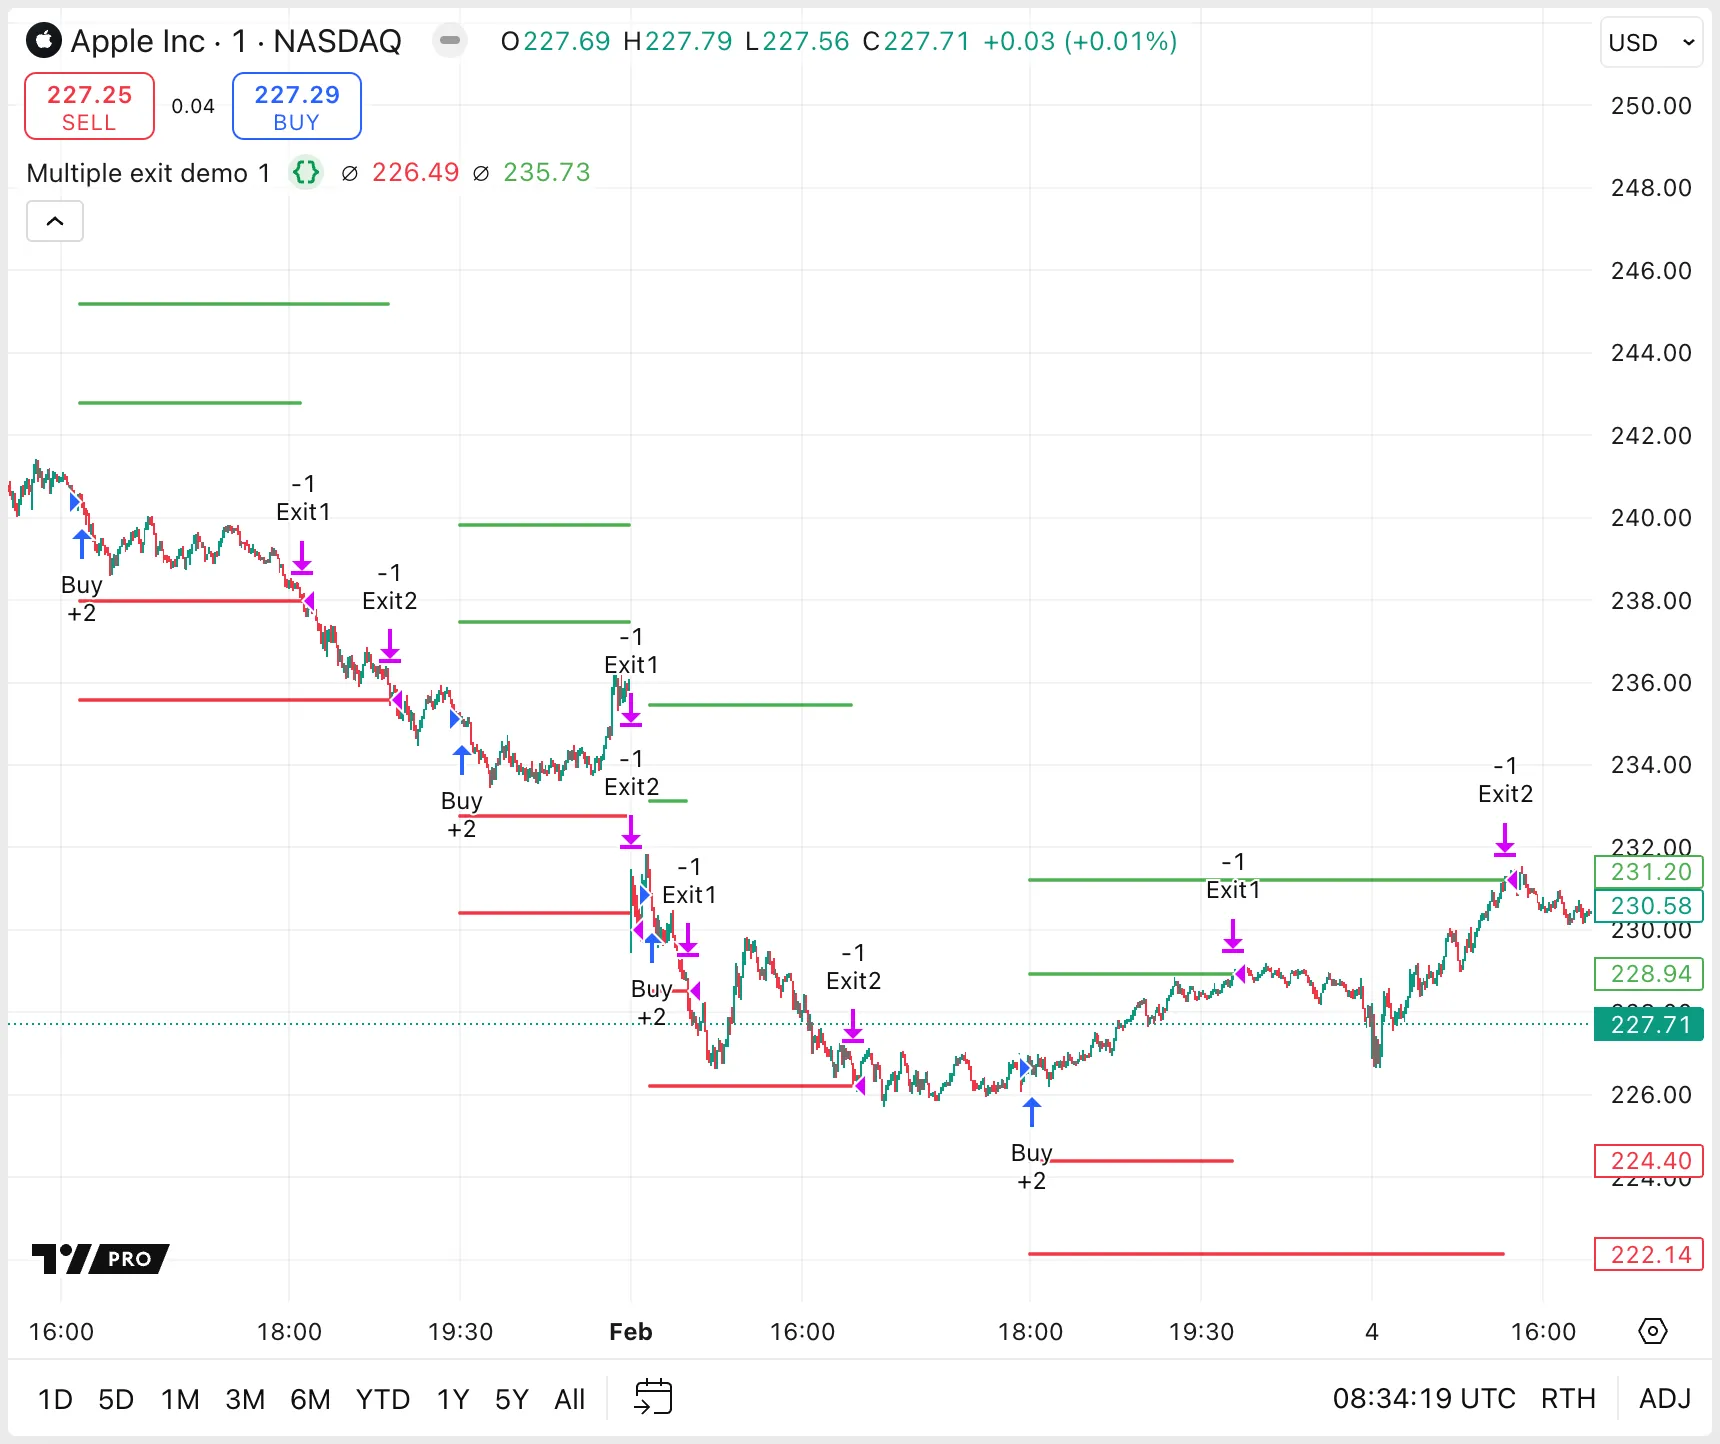
The following example script uses two separate strategy.exit() functions, each with its own stop-loss and take-profit levels. The quantity for the first bracket order is set to 50% of the total position size. This combination of orders creates a scaled exit with distinct stop levels.
//@version=6
strategy("Multiple exit demo", overlay = true)
int exitPercentInput = input.int(1, "Exit %", minval = 1, maxval = 99)
float exitPercent = exitPercentInput / 100
//@variable Is `true` on every 100th bar.
bool buyCondition = bar_index % 100 == 0
var float stopLoss1 = na, var float takeProfit1 = na // Exit levels for `Exit1`
var float stopLoss2 = na, var float takeProfit2 = na // Exit levels for `Exit2`
// Place orders when `buyCondition` is true and we are not in a position.
if buyCondition and strategy.position_size == 0.0
stopLoss1 := close * (1 - exitPercent), takeProfit1 := close * (1 + exitPercent) // Update the levels based on the current price
stopLoss2 := close * (1 - (2 * exitPercent)), takeProfit2 := close * (1 + (2 * exitPercent))
strategy.entry("Buy", strategy.long, qty = 2)
strategy.exit("Exit1", "Buy", stop = stopLoss1, limit = takeProfit1, qty_percent = 50)
strategy.exit("Exit2", "Buy", stop = stopLoss2, limit = takeProfit2)
// Set `stopLoss1` and `takeProfit1` to `na` when price touches either.
if low <= stopLoss1 or high >= takeProfit1
stopLoss1 := na
takeProfit1 := na
// Set `stopLoss2` and `takeProfit2` to `na` when price touches either.
if low <= stopLoss2 or high >= takeProfit2
stopLoss2 := na
takeProfit2 := na
plot(stopLoss1, "SL1", color.red, style = plot.style_circles)
plot(stopLoss2, "SL2", color.red, style = plot.style_circles)
plot(takeProfit1, "TP1", color.green, style = plot.style_circles)
plot(takeProfit2, "TP2", color.green, style = plot.style_circles)
Note that:
We use persistent global variables for the take-profit and stop-loss levels so that we can plot them. Otherwise, declaring the variables in the first if block would be simpler.
Creating exit orders as a group, using the strategy.oca.reduce type, ensures that when one exit order from the group is filled, the quantity of the remaining orders is reduced accordingly. This method is ideal in scripts that have an unequal number of take-profit levels to stops.
When using a group of orders whose OCA type is strategy.oca.reduce, we recommend ensuring that the total size of all exit orders, after any reductions, matches the size of the initial entry orders. Matching the sizes guarantees that the strategy closes the position entirely without leaving any part open or inadvertently opening a new position in the opposite direction.
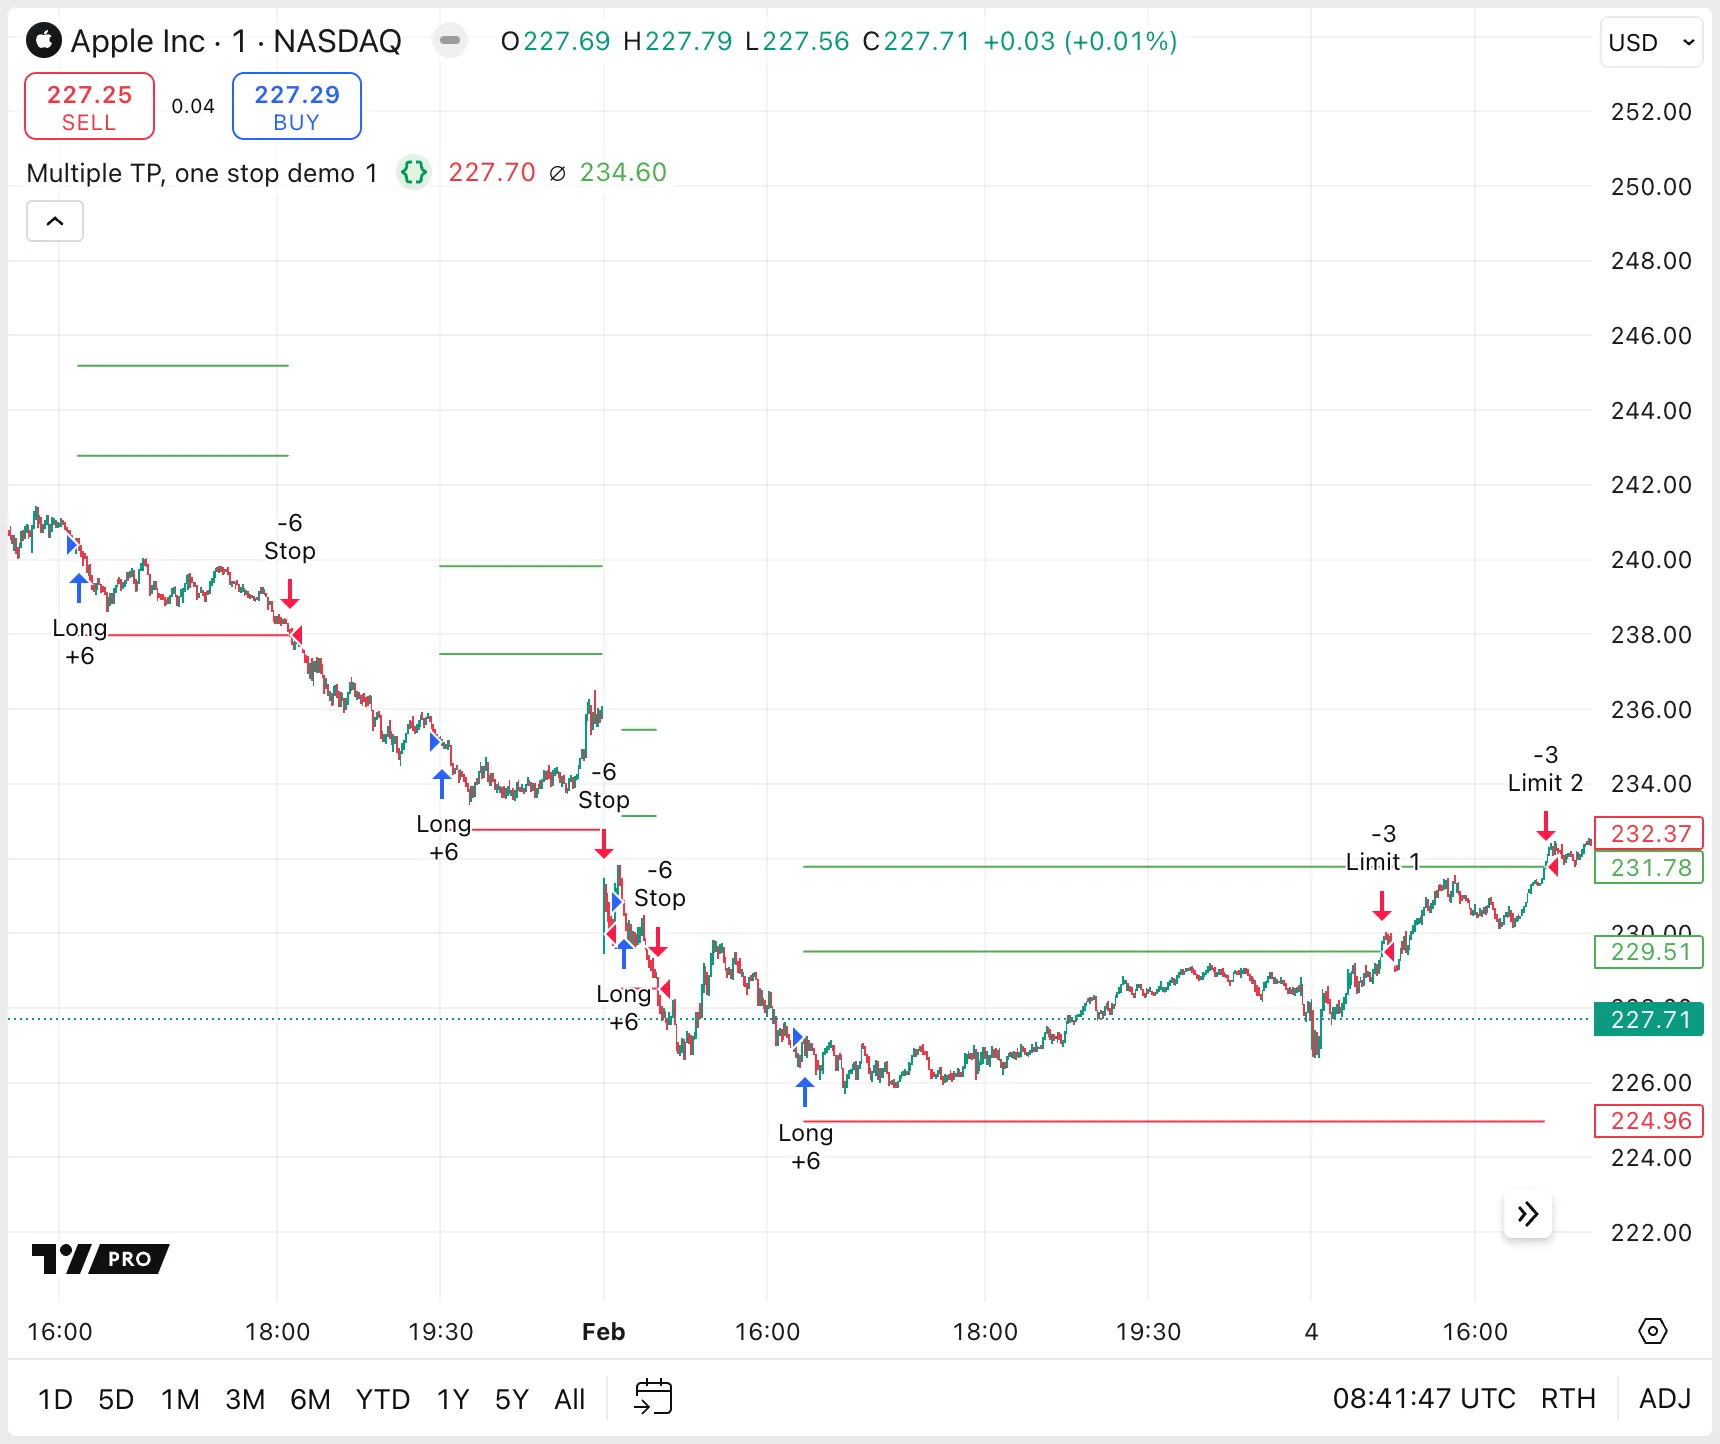
The following example script uses two take-profit levels but only one stop level. All three sell orders have the same oca_name, which means they form a group. They have oca_type = strategy.oca.reduce set, so that filling one of the limit orders reduces the quantity of the remaining orders. The total quantity of the exit orders matches the entry order quantity, preventing the strategy from trading an excessive number of units and causing a reversal.
//@version=6
strategy("Multiple TP, one stop demo", overlay = true)
int exitPercentInput = input.int(1, "Exit %", minval = 1, maxval = 99)
float exitPercent = exitPercentInput / 100
var float stop = na
var float limit1 = na
var float limit2 = na
bool buyCondition = bar_index % 100 == 0 // Is `true` on every 100th bar.
// Place orders when `buyCondition` is true and we are not in a position.
if buyCondition and strategy.position_size == 0
stop := close * (1 - exitPercent)
limit1 := close * (1 + exitPercent)
limit2 := close * (1 + (2 * exitPercent))
strategy.entry("Long", strategy.long, 6)
// All three sell orders use the "Bracket" OCA group; filling one order reduces the quantity of the remaining orders.
strategy.order("Stop", strategy.short, stop = stop, qty = 6, oca_name = "Bracket", oca_type = strategy.oca.reduce)
strategy.order("Limit 1", strategy.short, limit = limit1, qty = 3, oca_name = "Bracket", oca_type = strategy.oca.reduce)
strategy.order("Limit 2", strategy.short, limit = limit2, qty = 6, oca_name = "Bracket", oca_type = strategy.oca.reduce)
// Set `limit1` to `na` when price exceeds it.
if high >= limit1
limit1 := na
// Set `stop`, `limit11`, and `limit2` to `na` when price surpasses either the last take-profit, or the stop.
if low <= stop or high >= limit2
stop := na, limit1 := na, limit2 := na
plot(stop, "Stop", color.red, style = plot.style_linebr)
plot(limit1, "Limit 1", color.green, style = plot.style_linebr)
plot(limit2, "Limit 2", color.green, style = plot.style_linebr)
On historical bars, Pine scripts can access only a single set of open, high, low and close (OHLC) data per bar.
Consequently, strategies are calculated once, at the close of each bar. This limitation means it’s not possible to evaluate logical conditions that occur mid-bar, such as a price cross, on historical data.
Strategies running on realtime bars can simulate orders partway through a bar by enabling the calc_on_every_tick parameter. This setting allows the strategy to process each tick (incoming price update) and execute trades on the tick after a logical condition occurs.
Stop or limit orders at predefined prices can execute orders partway through a bar, even when the strategy does not enable the calc_on_every_tick parameter. This method is effective on both realtime and historical data. Even though orders are processed on the close of historical bars, the broker emulator simulates an order fill at the predefined price level, if the broker determines that price has hit that level during the bar.
For information about the assumptions that the broker emulator makes about price movements, see the Broker emulator section of the User Manual.
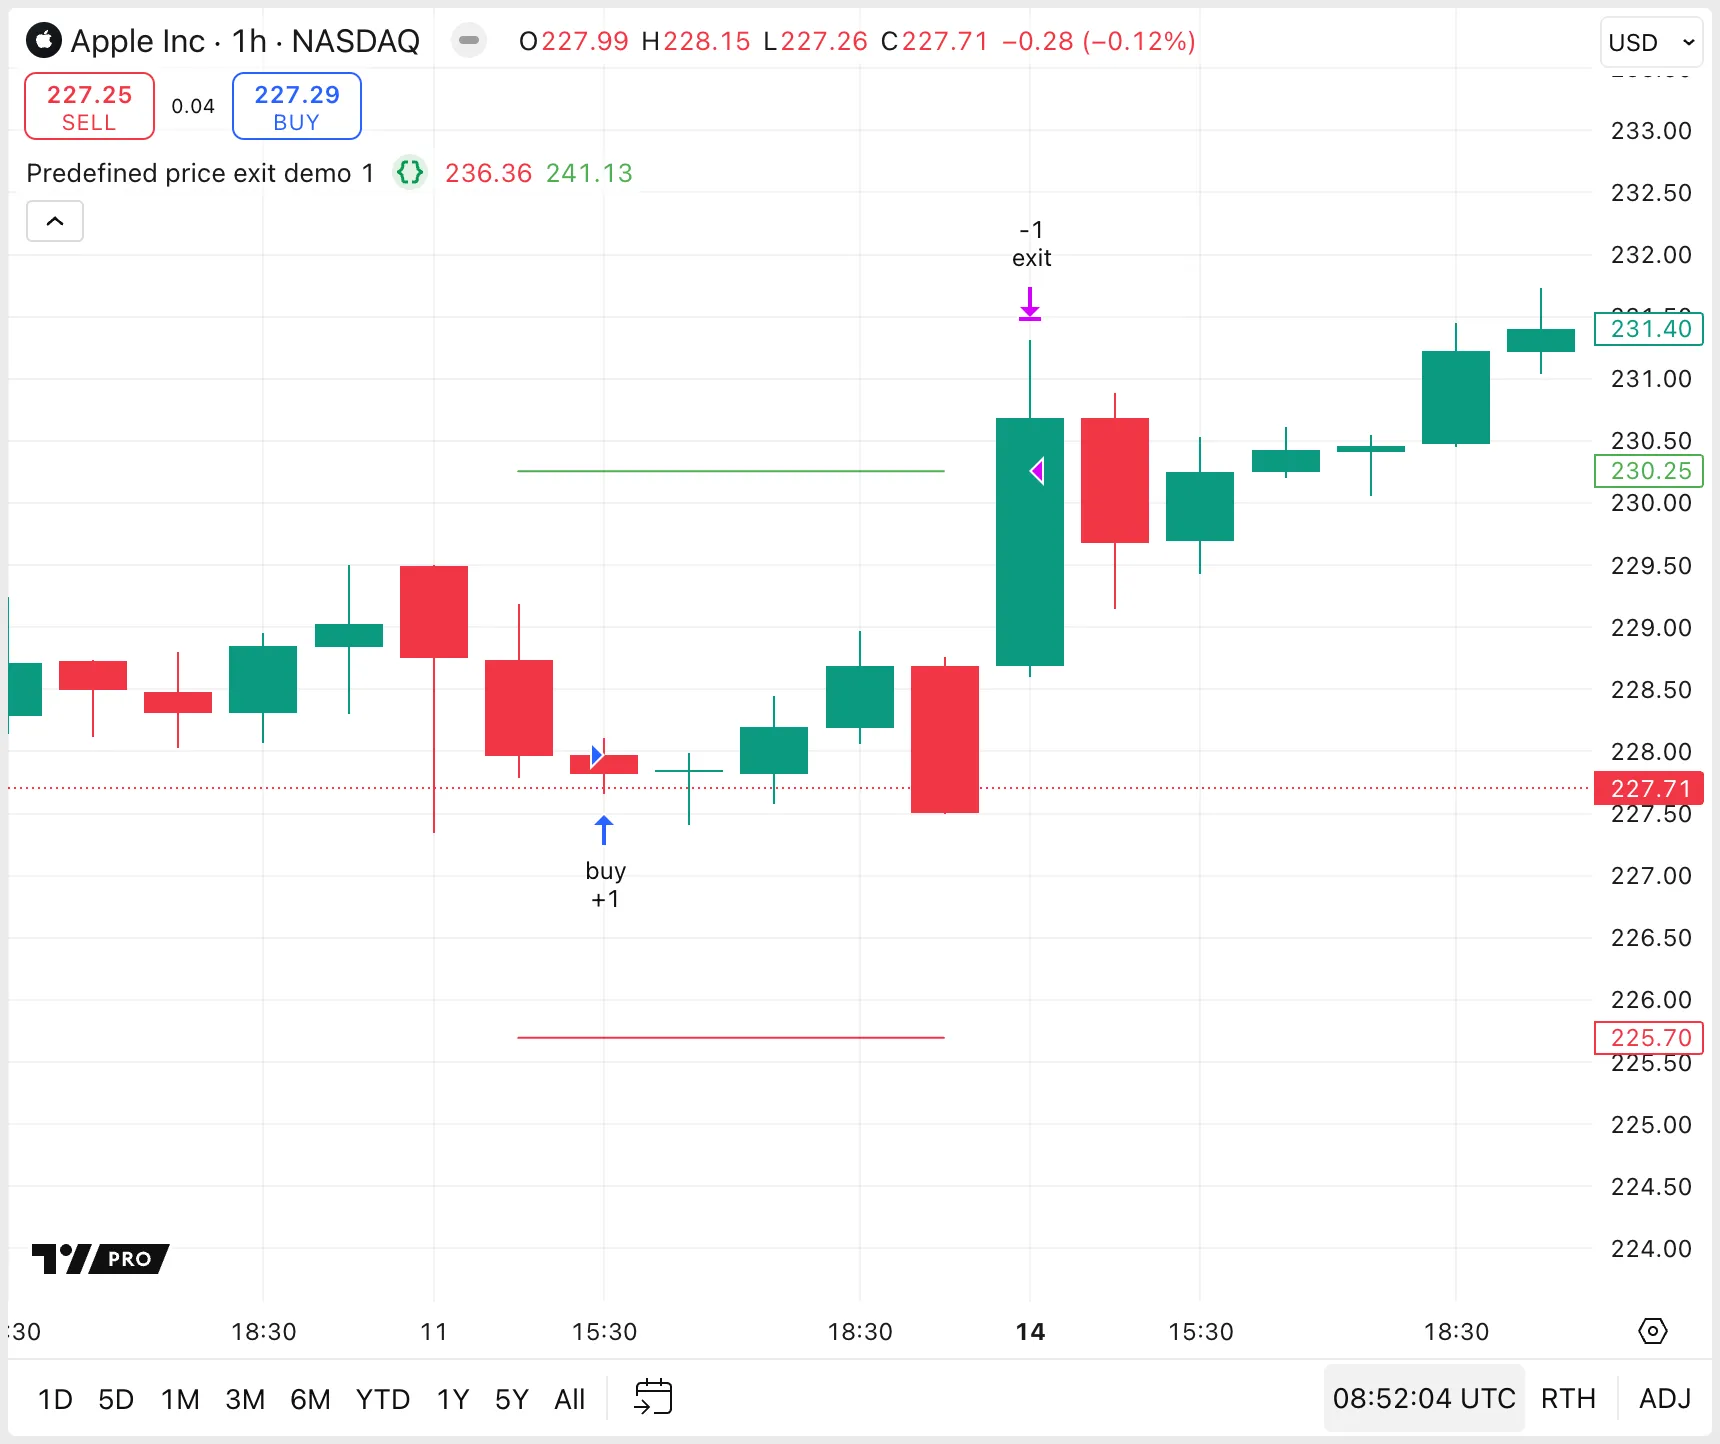
The following example script uses stop and limit orders to exit a trade partway through a bar. The script calls the strategy.exit() function with the stop and limit parameters, determining the specific price levels at which the trade will exit.
//@version=6
strategy("Predefined price exit demo", overlay = true)
int exitPercentInput = input.int(1, "Exit %", minval = 1, maxval = 99)
float exitPercent = exitPercentInput / 100
//@variable Is `true` on every 100th bar.
bool buyCondition = bar_index % 100 == 0
var float stopLoss = na
var float takeProfit = na
// Place orders when `buyCondition` is true and we are not in a position.
if buyCondition and strategy.position_size == 0.0
stopLoss := close * (1 - exitPercent)
takeProfit := close * (1 + exitPercent)
strategy.entry("buy", strategy.long)
strategy.exit("exit", "buy", stop = stopLoss, limit = takeProfit)
// Set `stopLoss` and `takeProfit` to `na` when price touches either, i.e., when the strategy simulates an exit.
if low <= stopLoss or high >= takeProfit
stopLoss := na
takeProfit := na
plot(stopLoss, "SL", color.red, style = plot.style_linebr)
plot(takeProfit, "TP", color.green, style = plot.style_linebr)
Sometimes, strategy testers want to be able to exit a trade in the same bar as the entry. By default, if an exit condition occurs during the same bar that a trade is opened, the broker emulator closes the trade at the open of the next bar. To learn why this happens, refer to this FAQ entry.
To override this default behavior, either specify exit prices, or exit with a market order at the bar close.
If the entry command also sets stop-loss or take-profit orders to trigger an exit when certain price levels are reached, then the trade can exit during the same bar that it opens.
In the following example script, the trade exits within the same bar if the price hits either of the defined profit or loss levels. Setting small profit and loss values increases the likelihood of triggering an exit within the entry bar, although the trade could hit those levels for the first time in a subsequent bar instead.
//@version=6
strategy("Exit on entry bar with specific price", overlay = true)
int exitTickSizeInput = input.int(10, "Exit if price moves this many ticks", minval = 1)
//@variable Is `true` on every 100th bar.
bool buyCondition = bar_index % 10 == 0
// Place orders when `buyCondition` is true and we are not in a position.
if buyCondition and strategy.position_size == 0.0
strategy.entry("buy", strategy.long)
strategy.exit("exit", "buy", profit = exitTickSizeInput, loss = exitTickSizeInput)
Another method to exit a trade in the same bar that it opens is to use a market order at the bar’s close, by setting the immediately argument to true in the strategy.close() function.
In the following example script, if the buy order is opened, the strategy closes the position at the end of the entry bar. Scripts can call the strategy.close() function conditionally within a local block if necessary. For simplicity, in this example we apply the command to every entry.
//@version=6
strategy("Exit on entry bar with market order", overlay = true)
//@variable Is `true` on every 100th bar.
bool buyCondition = bar_index % 10 == 0
// Place orders when `buyCondition` is true and we are not in a position.
if buyCondition and strategy.position_size == 0.0
strategy.entry("buy", strategy.long)
strategy.close("buy", immediately = true)
To set exit orders as a percentage from the entry price, the script needs the average entry price calculated by the broker emulator (which is affected by conditions including multiple entries and slippage). However, the built-in variable strategy.position_avg_price returns na until the close of the entry bar. This means that take-profit and stop-loss orders based on the entry price can only be placed during the next bar.
If programmers want strategies to be able to close trades on the same bar that they are opened, there are two workarounds, each of which have their own benefits and limitations: altering the emulator behavior and using a different, fixed value.
Setting the calc_on_order_fills argument of the strategy() declaration function to true recalculates the strategy immediately after simulating an order fill. This setting provides access to data such as the current average price of a position on an unconfirmed bar.
The following example script sets take-profit and stop-loss orders during the entry bar, based on the entry price strategy.position_avg_price. The script uses the calc_on_order_fills setting to enable this behavior.
//@version=6
strategy("Exit demo using `calc_on_order_fills`", overlay = true, calc_on_order_fills = true)
float stopSizeInput = input.float(1.0, "SL %", minval = 0.0) / 100.0
float profitSizeInput = input.float(1.0, "TP %", minval = 0.0) / 100.0
//@variable Is `true` on every 100th bar.
bool buyCondition = bar_index % 100 == 0
//@variable Stop-loss price for exit commands.
var float stopLoss = na
//@variable Take-profit price for exit commands.
var float takeProfit = na
// Place orders when `buyCondition` is true and we are not in a position.
if buyCondition and strategy.position_size == 0.0
strategy.entry("buy", strategy.long)
// If we are in a position, set the exit orders.
if strategy.position_size != 0.0
stopLoss := strategy.position_avg_price * (1.0 - stopSizeInput)
takeProfit := strategy.position_avg_price * (1.0 + profitSizeInput)
strategy.exit("exit", "buy", stop = stopLoss, limit = takeProfit)
// Set `stopLoss` and `takeProfit` to `na` when price touches either, i.e., when the strategy simulates an exit.
if low <= stopLoss or high >= takeProfit
stopLoss := na
takeProfit := na
plot(stopLoss, "SL", color.red, style = plot.style_linebr)
plot(takeProfit, "TP", color.green, style = plot.style_linebr)
Note that:
If we change calc_on_order_fills to false in this script, the exit orders are placed on the bar after the entry bar, and can fill at very different levels depending on the movement of price.
The following example script calculates the stop and limit orders based on the closing price of the signal bar. The disadvantage of this approach is that the close price might not match the average opening price exactly. The advantage is that this method doesn’t introduce potential lookahead bias like using calc_on_order_fills.
//@version=6
strategy("Exit demo using predefined prices", overlay = true)
float stopSizeInput = input.float(1.0, "SL %", minval = 0.0) / 100.0
float profitSizeInput = input.float(1.0, "TP %", minval = 0.0) / 100.0
//@variable Is `true` on every 100th bar.
bool buyCondition = bar_index % 100 == 0
//@variable Stop-loss price for exit commands.
var float stopLoss = na
//@variable Take-profit price for exit commands.
var float takeProfit = na
// Place orders when `buyCondition` is true and we are not in a position.
if buyCondition and strategy.position_size == 0.0
stopLoss := close * (1.0 - stopSizeInput)
takeProfit := close * (1.0 + profitSizeInput)
strategy.entry("buy", strategy.long)
strategy.exit("exit", "buy", stop = stopLoss, limit = takeProfit)
// Set `stopLoss` and `takeProfit` to `na` when price touches either, i.e., when the strategy simulates an exit.
if low <= stopLoss or high >= takeProfit
stopLoss := na
takeProfit := na
plot(stopLoss, "SL", color.red, style = plot.style_linebr)
plot(takeProfit, "TP", color.green, style = plot.style_linebr)
Moving a stop-loss order to breakeven can be a useful technique to manage risk.
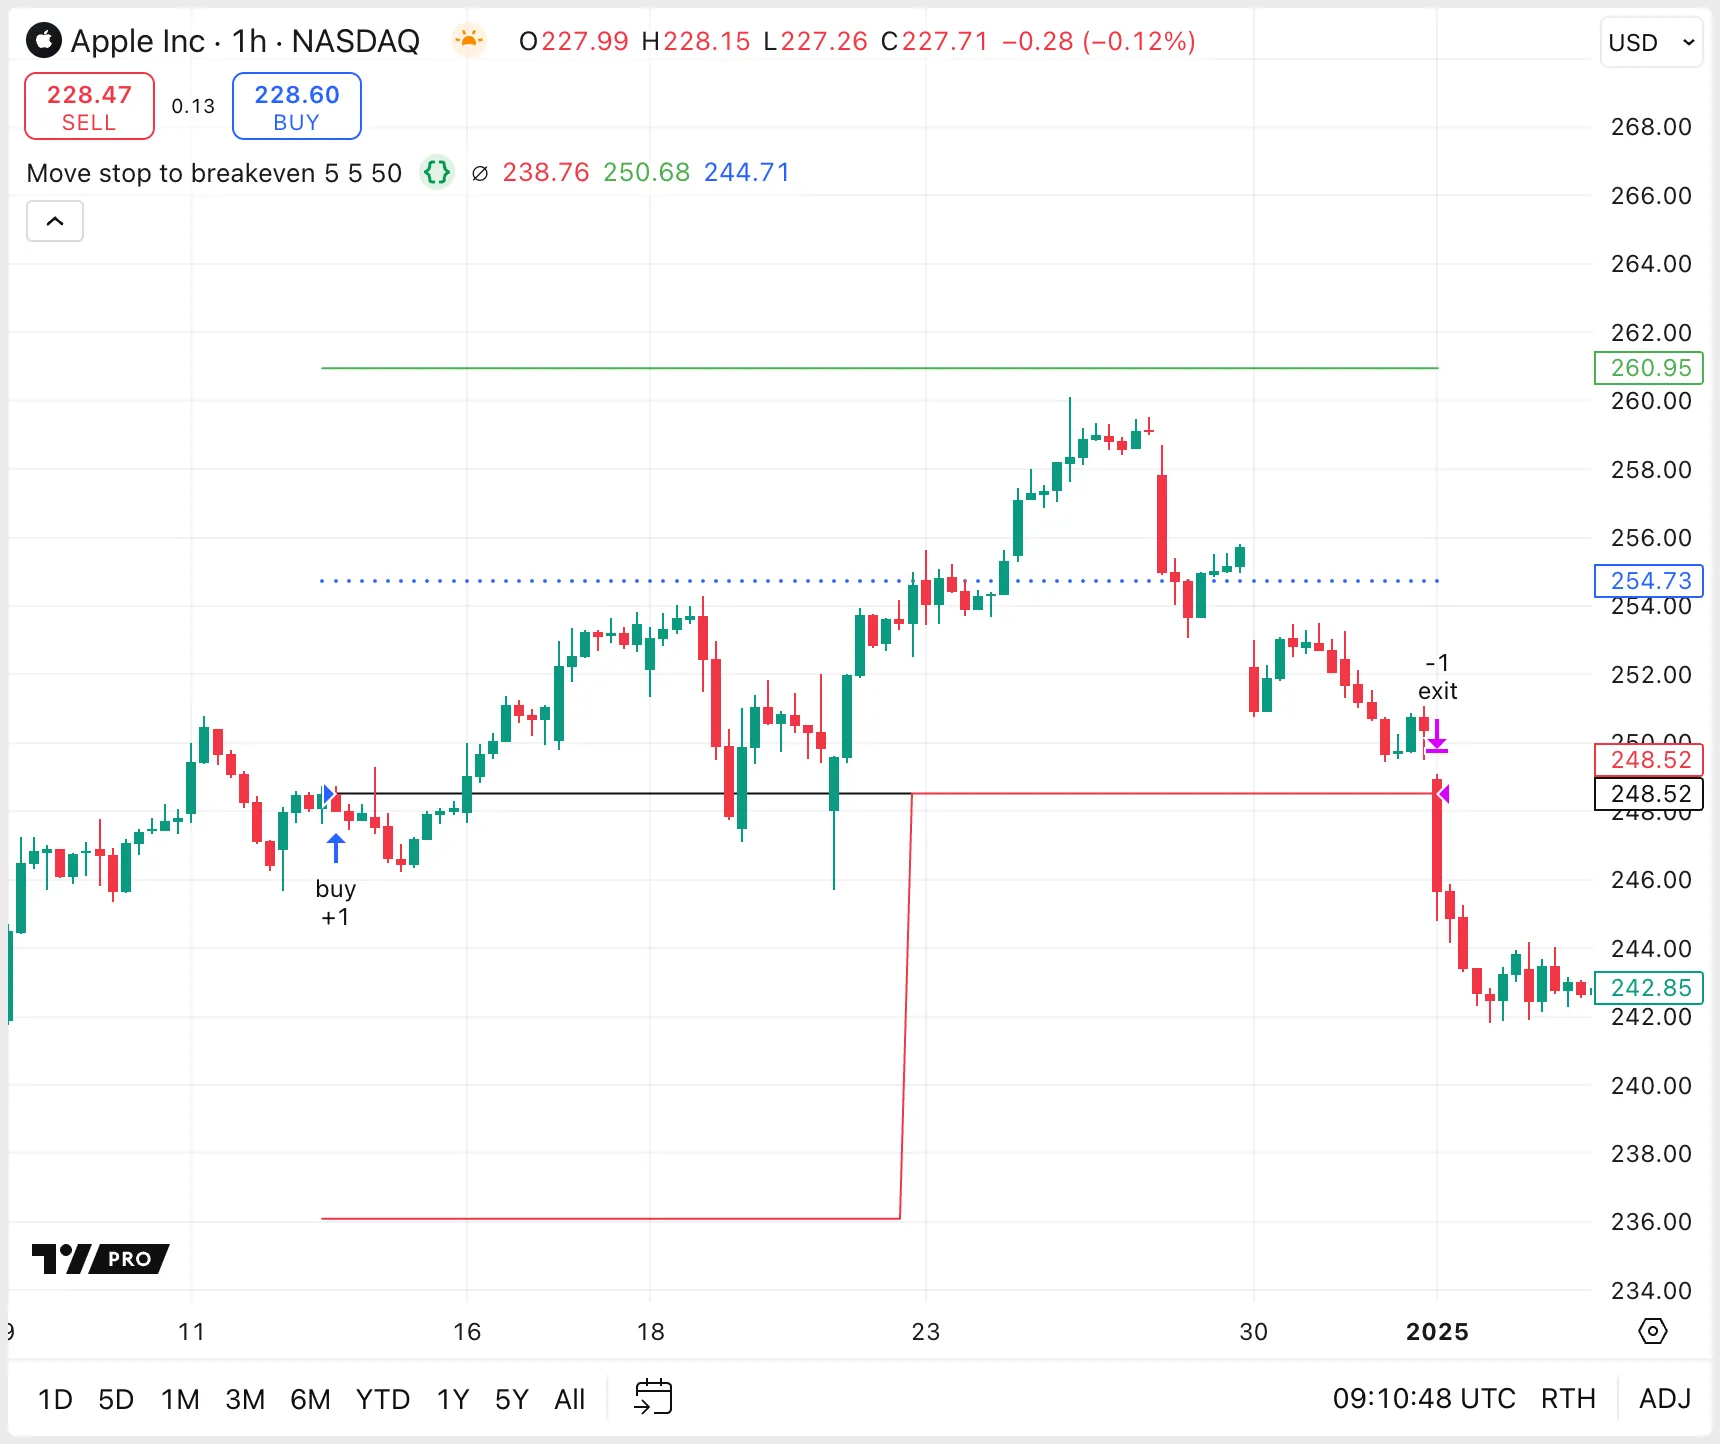
The following example script sets a persistent stopLoss variable when the strategy enters a position. The script then updates the stop price to the entry price when the market price gets halfway to the take-profit level. The script calls the strategy.exit() function on every bar to ensure that the broker emulator receives any updates made to the stopLoss value. Lastly, it plots the average price according to the strategy.position_avg_price variable for reference.
//@version=6
strategy("Move stop to breakeven", overlay = true)
float stopSizeInput = input.float(5.0, "SL %", minval = 0.0) / 100.0
float profitSizeInput = input.float(5.0, "TP %", minval = 0.0) / 100.0
float breakEvenInput = input.float(50, "BE %", minval = 0.0, maxval = 100) / 100.0
//@variable Is `true` on every 100th bar.
bool buyCondition = bar_index % 100 == 0
//@variable Stop-loss price for exit commands.
var float stopLoss = na
//@variable Take-profit price for exit commands.
var float takeProfit = na
//@variable Price that, if breached, sets the stop to breakeven.
var float breakEvenThreshold = na
// Place orders when `buyCondition` is true and we are not in a position.
if buyCondition and strategy.position_size == 0.0
stopLoss := close * (1.0 - stopSizeInput)
takeProfit := close * (1.0 + profitSizeInput) // Set the breakeven threshold.
breakEvenThreshold := close * (1.0 + profitSizeInput * breakEvenInput)
strategy.entry("buy", strategy.long)
// If the breakeven threshold is exceeded while in a position, set the stop to the entry price.
if high >= breakEvenThreshold and strategy.position_size != 0
stopLoss := strategy.position_avg_price
//@variable Is `true` on the bar on which a trade exits.
bool isExitBar = strategy.closedtrades.exit_bar_index(strategy.closedtrades - 1) == bar_index
//@variable Condition to determine when plots are displayed.
bool showPlots = strategy.position_size != 0 or buyCondition or isExitBar
// Plot the entry price, stop loss, take-profit, and the breakeven threshold.
plot(strategy.position_avg_price, "BE", chart.fg_color, style = plot.style_linebr)
plot(showPlots ? stopLoss : na, "SL", color.red, style = plot.style_linebr)
plot(showPlots ? takeProfit : na, "TP", color.green, style = plot.style_linebr)
plot(showPlots ? breakEvenThreshold : na, "TG", color.blue, style = plot.style_circles)
// Place a bracket order using the `stopLoss` and `takeProfit` values.
// We call it on every bar so that the stop level is updated when the breakeven threshold is exceeded.
strategy.exit("exit", "buy", stop = stopLoss, limit = takeProfit)
Note that:
This strategy uses strategy.position_avg_price as the breakeven level. However, the real breakeven price of a trade is affected by slippage and commission.
A trailing stop loss limits a trader’s losses while allowing a position to remain open as long as the price moves favorably.
Strategies can create trailing stops either by using the built-in functionality of the strategy.exit() function or by creating custom trailing stop-loss logic.
Trailing stops set in the strategy.exit() use live price updates in realtime but assumed price movements for historical bars. These assumptions can cause repainting. This type of trailing stop is therefore potentially more responsive but less accurate.
Custom trailing stop values are typically updated at the close of each bar, and so do not capture realtime intrabar price movements with the same responsiveness. This delay helps to avoid repainting strategy results.
To set a trailing stop in the strategy.exit() function, specify both when the trail should activate and how far behind price it should trail.
Activation level
When price crosses this level, the trailing stop activates. The activation level can be set as a number of ticks past the entry price via the trail_points parameter, or as a price value via the trail_price parameter.
Trail offset
After it activates, the stop loss trails behind the bar’s high or low price by this distance, defined in ticks using the trail_offset parameter.
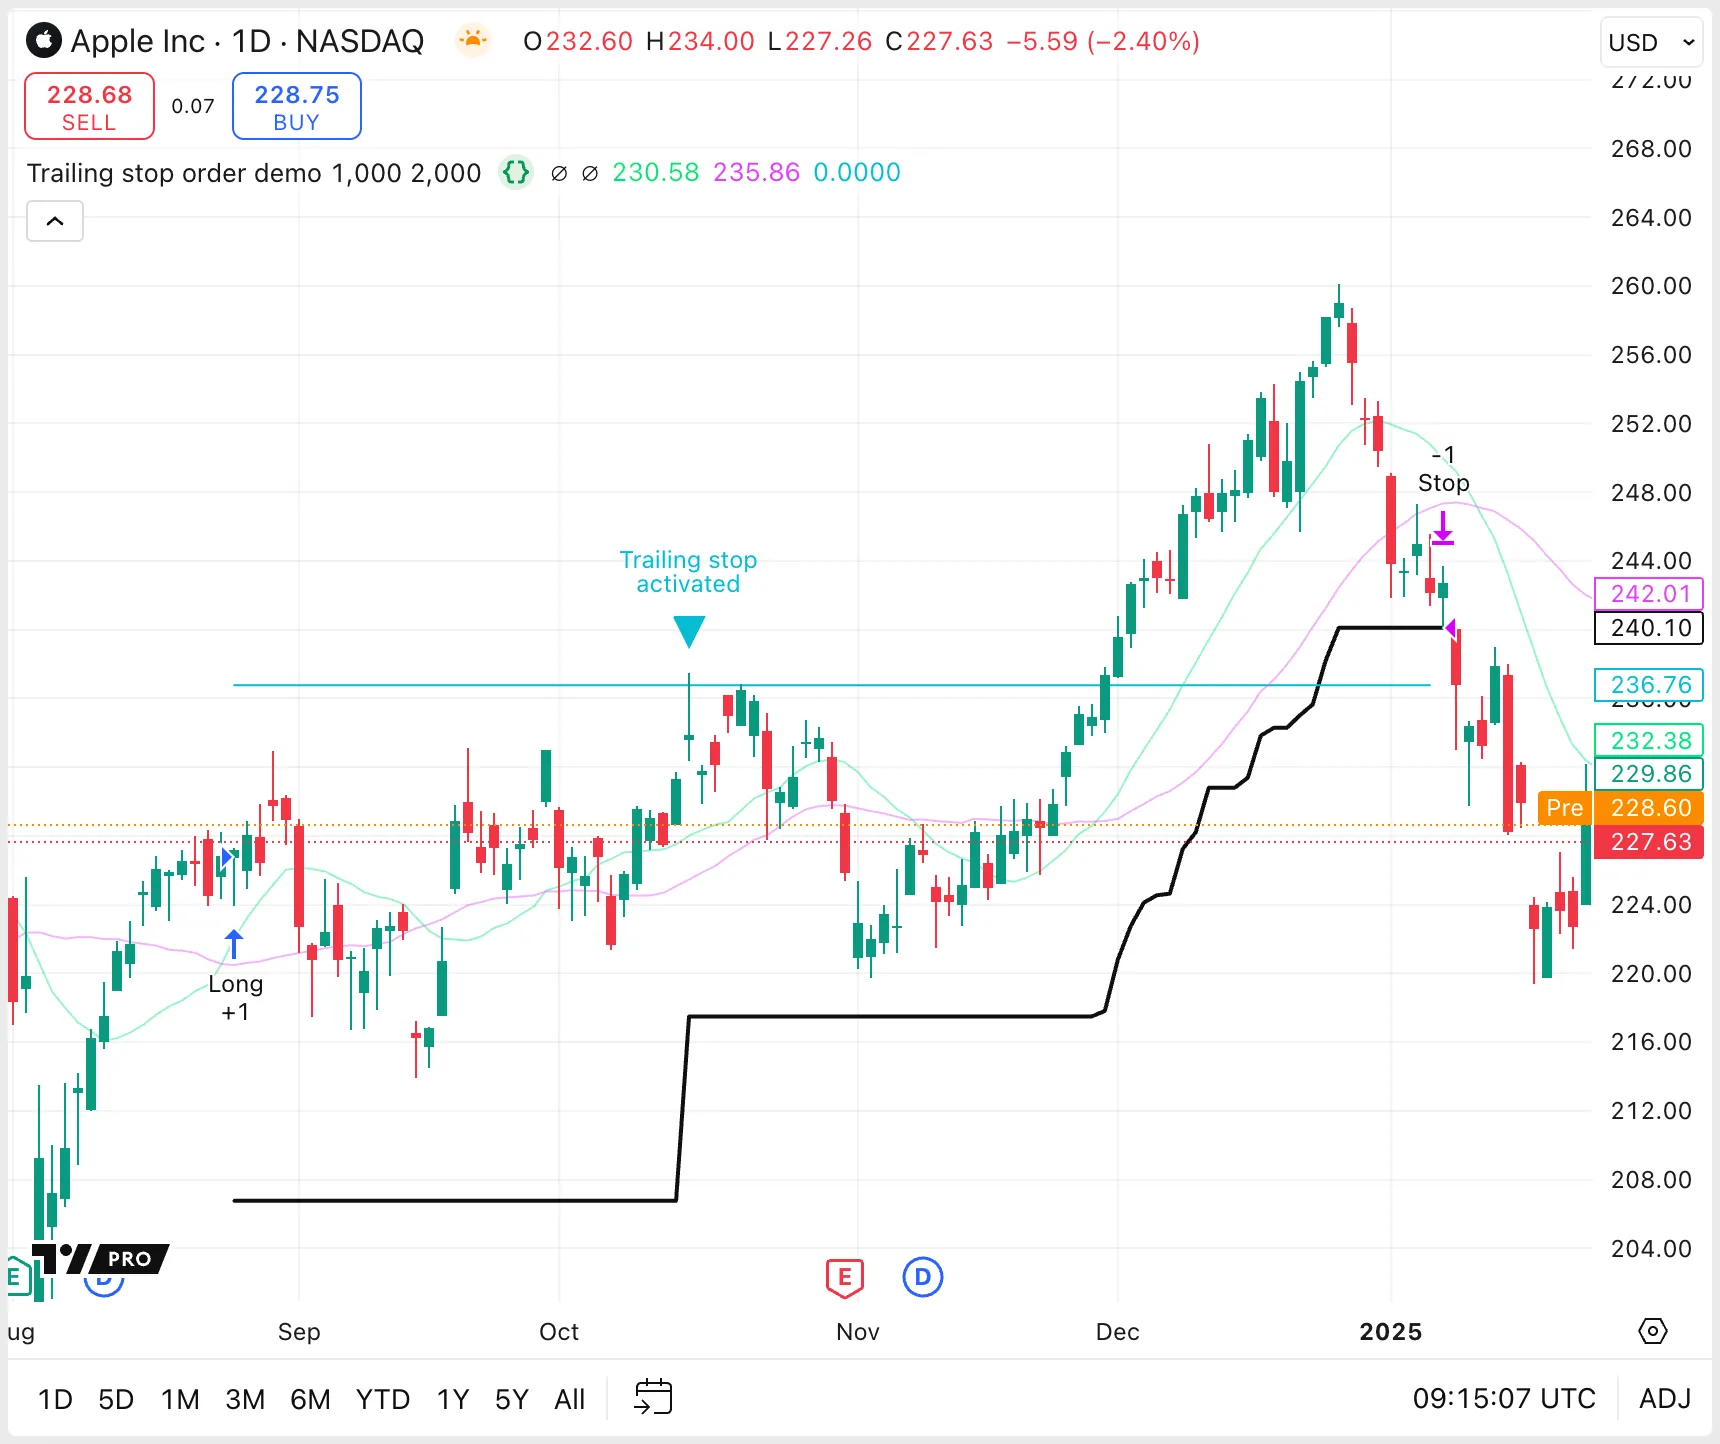
In the following long-only example script, the strategy.exit() function uses the trail_points and trail_offset parameters to set a trailing stop. The
stop-loss trails the high, minus the offset points, after it activates. The script creates and plots a separate trailingStop variable to visualize the trailing stop price that the function calculates internally, although this is not necessary for the trailing stop to function. We also set a separate stop-loss order to close trades that go too low before they trigger the trailing stop.
//@version=6
strategy("Trailing stop order demo", overlay = true)
string TT_SO = "The trailing stop offset in ticks. Also used as the initial stop loss distance from the entry price."
//@variable The activation level is this number of ticks above the entry price.
int activationOffsetInput = input.int(1000, "Activation Level Offset (in ticks)")
//@variable The trailing stop trails this many ticks below the high price.
int stopOffsetInput = input.int(2000, "Stop Offset (in ticks)", tooltip = TT_SO)
//@variable The price at which the trailing stop activates.
float trailPriceActivationLevel = activationOffsetInput * syminfo.mintick + strategy.position_avg_price
//@variable The price at which the trailing stop itself is located.
var float trailingStop = na
// Calculate a fast and slow Simple Moving Average.
float ma1 = ta.sma(close, 14)
float ma2 = ta.sma(close, 28)
//@variable Is `true` when `ma1` crosses over `ma2` and we are not in a position.
bool longCondition = ta.crossover(ma1, ma2) and strategy.position_size == 0
//@variable Is `true` on the bar that a trade exits.
bool isExitBar = strategy.closedtrades.exit_bar_index(strategy.closedtrades - 1) == bar_index
float exitPrice = strategy.closedtrades.exit_price(strategy.closedtrades - 1)
// Generate a long market order when `longCondition` is `true`.
// Set a static abd trailing stop loss.
if longCondition
strategy.entry("Long", strategy.long)
strategy.exit("Stop",
from_entry = "Long",
trail_points = activationOffsetInput,
trail_offset = stopOffsetInput,
loss = stopOffsetInput
)
// If the high exceeds the activation level, set the `trailingStop` to whichever is higher:
// the current high minus the price equivalent of `stopOffsetInput` or the previous `trailingStop` value.
if high > trailPriceActivationLevel or isExitBar and exitPrice > trailingStop
trailingStop := math.max(high - stopOffsetInput * syminfo.mintick, nz(trailingStop))
//@variable The price of the active stop price, using the trailing stop when activated, or a static stop loss otherwise.
float stopLevel = na(trailingStop) ? strategy.position_avg_price - stopOffsetInput * syminfo.mintick : trailingStop
// Visualize the movement of the trailing stop and the activation level.
plot(stopLevel, "Stop Level", chart.fg_color, 2, plot.style_linebr)
plot(trailPriceActivationLevel, "Activation level", color.aqua, 1, plot.style_linebr)
// Display the two simple moving averages on the chart.
plot(ma1, "MA 1", color.new(color.lime, 60))
plot(ma2, "MA 2", color.new(color.fuchsia, 60))
// Mark the point where the trailing stop is activated with a shape and text.
plotshape(
high > trailPriceActivationLevel and na(trailingStop)[1], "Trail Activated", shape.triangledown,
size = size.small, color = color.aqua, text = "Trailing stop\nactivated", textcolor = color.aqua
)
// Set the trailing stop to `na` when not in a position.
if strategy.position_size == 0
trailingStop := na
A custom trailing stop can use different activation conditions, and can trail in a different way, to the trailing stop built into the strategy.exit() function. To work correctly, a custom trailing stop must calculate the stop price on each bar that the stop is active, and call the strategy.exit() function on each bar to set the stop price.
The following example script triggers long and short trades based on crosses of two moving averages. A custom function calculates the trailing stop using the highest or lowest price from the last five bars, adjusted by an Average True Range (ATR) buffer. This method of distancing the stop by a measure of average price movement attempts to reduce premature stop triggers in volatile conditions.
//@version=6
strategy("ATR trailing stop demo", overlay = true)
// Set the lookback period in bars to identify the highest or lowest point for trailing stop calculations.
int SWING_LOOKBACK = 5
// @function Calculates a dynamic trailing stop by adjusting the highest
// (bearish) or lowest (bullish) swing points over a set `length`
// of bars using the ATR, for a stop distance proportional to average bar size.
// @param calcStop (series bool) A condition that activates the trailing stop, e.g., being in a trade.
// @param length (simple int) The number of bars to look back to determine the highest or lowest point for
// the trailing stop calculation.
// @param isLong (simple bool) Indicator of the trailing stop's orientation: true for long trades
// (stop below price) and false for short trades (stop above price).
// @param atrMultiplier (simple float) The multiplier applied to the ATR, adjusting the stop's distance from the
// identified extreme price point. Optional. Default is 1.0, or 100% of the ATR value.
// @returns (float) The trailing stop price, or `na` if `calcStop` is false.
atrTrailingStop(series bool calcStop, simple int length, simple bool isLong, simple float atrMultiplier = 1.0) =>
var float trailPrice = na
int m = isLong ? 1 : -1
float atr = ta.atr(14) * atrMultiplier
float swingPoint = switch
isLong => ta.lowest(length) - atr
=> ta.highest(length) + atr
trailPrice := switch
calcStop and not calcStop[1] => swingPoint
calcStop[1] and not calcStop => na
=> math.max(trailPrice * m, swingPoint * m) * m
// Calculate a fast and slow simple moving average.
float ma1 = ta.sma(close, 14)
float ma2 = ta.sma(close, 28)
// Conditions for long/short entries on MA crossover/crossunder, if we are not in a position.
bool longCondition = ta.crossover(ma1, ma2) and strategy.position_size == 0
bool shortCondition = ta.crossunder(ma1, ma2) and strategy.position_size == 0
// Determine when to calculate trailing stops for long/short positions, based on entries and position.
bool isExitBar = strategy.closedtrades.exit_bar_index(strategy.closedtrades - 1) == bar_index
bool isLong = longCondition or strategy.position_size > 0 or isExitBar
bool isBear = shortCondition or strategy.position_size < 0 or isExitBar
// Use `atrTrailingStop()` to calculate trailing stops for both long and short positions.
float longStop = atrTrailingStop(isLong, SWING_LOOKBACK, true)
float shortStop = atrTrailingStop(isBear, SWING_LOOKBACK, false)
// Place long entry order when `longCondition` occurs.
if longCondition
strategy.entry("long", strategy.long)
// Place short entry order when `shortCondition` occurs.
if shortCondition
strategy.entry("short", strategy.short)
// Create exit orders for long/short trades with ATR trailing stop, called on each bar to update to the latest price.
strategy.exit("long exit", "long", stop = longStop)
strategy.exit("short exit", "short", stop = shortStop)
// Display the two simple moving averages and stop levels on the chart.
plot(ma1, "MA 1", color.new(color.lime, 60))
plot(ma2, "MA 2", color.new(color.fuchsia, 60))
plot(isExitBar ? longStop[1] : longStop, "Long Stop", color.red, 2, plot.style_linebr)
plot(isExitBar ? shortStop[1] : shortStop, "Short Stop", color.red, 2, plot.style_linebr)
Note that:
Because strategies run once per bar, the trailing stop price in this example script updates at the close of each bar. During realtime bars the previous bar’s stop value is used. This approach, while slightly delayed compared to using the built-in trailing stop described in the FAQ entry about how to place a trailing stop loss using built-in trailing stop functionality, ensures that the
trailing stop price is not subject to assumptions about intrabar price movements, and thus avoids repainting.
To close positions after a certain amount of time has passed, track the entry time for each trade and close the position using strategy.close() after the timeout.
Because strategies calculate at the close of each bar on historical data, time-based conditions can only be evaluated at the close, so trade times are assessed in multiples of the chart bar’s duration. Further, if the timeout value is not divisible by the duration of a chart bar, each trade will last at least one additional chart bar. For instance, setting a timeout of 100 seconds on a 1-minute chart effectively means a minimum of two bars before a position can be closed.
In realtime, the same logic applies unless the strategy uses the calc_on_every_tick parameter, in which case the trade closes as soon as the first tick exceeds the timeout value. Remember that altering emulator behavior typically introduces repainting.
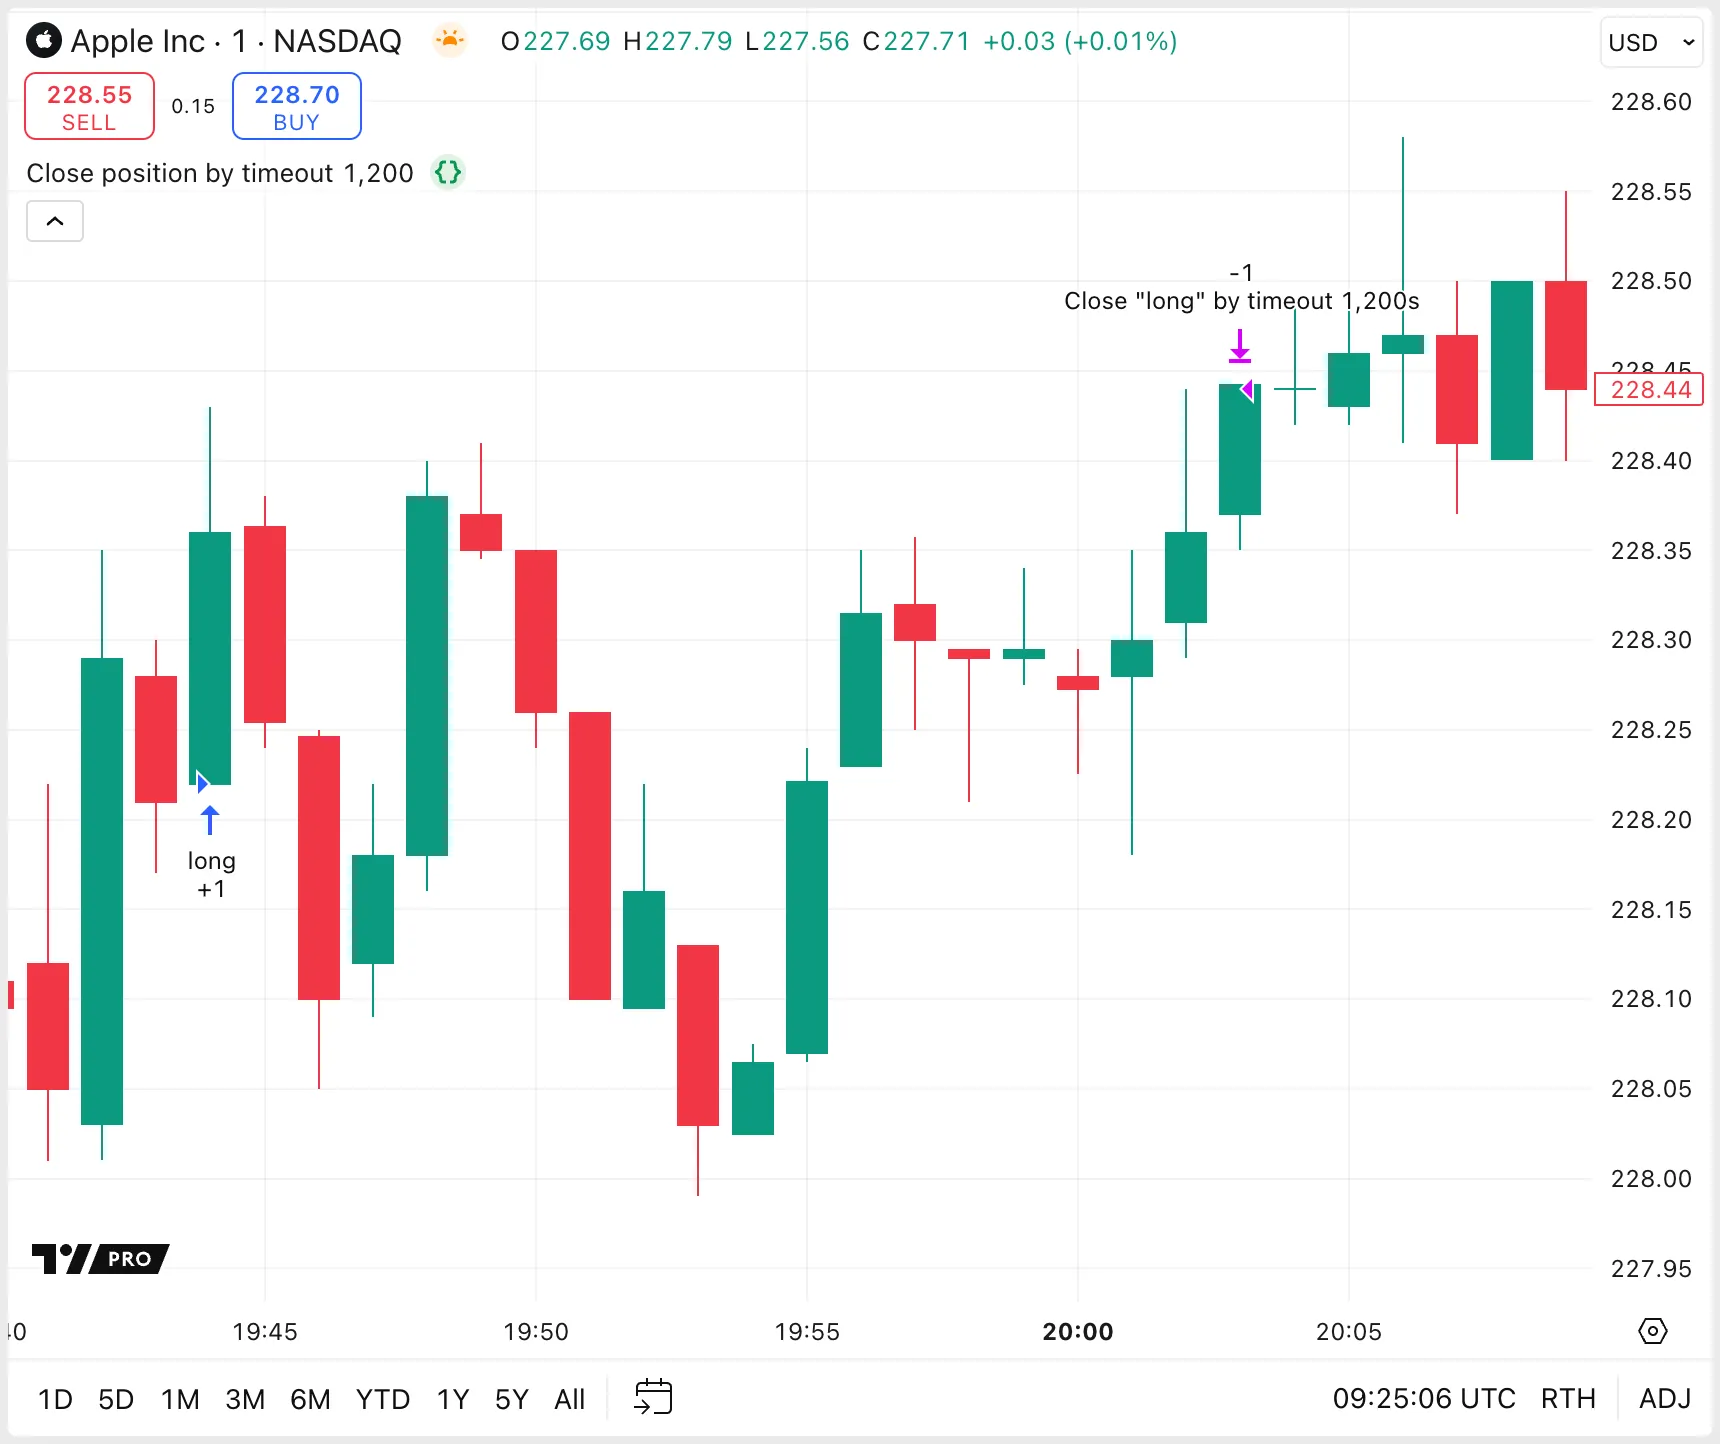
The following example script calculates the duration of each open trade by comparing the current time against the trade entry time. If a trade’s duration exceeds the specified timeout, the script closes the trade and marks the event with a comment on the chart including the trade’s duration in seconds.
//@version=6
strategy("Close position by timeout", overlay = true)
// @function Automatically closes all positions that have been open for longer than a specified period.
// @param timeoutInSeconds (int) The maximum allowed duration for an open trade, measured in seconds.
// @returns (void) The function has no explicit return.
closePositionsAfter(int timeoutInSeconds) =>
if strategy.opentrades > 0
for i = 0 to strategy.opentrades - 1
int timeNow = barstate.isrealtime ? timenow : time_close
int tradeDurationInSeconds = (timeNow - strategy.opentrades.entry_time(i)) / 1000
if tradeDurationInSeconds >= timeoutInSeconds
string entryName = strategy.opentrades.entry_id(i)
string tradeComment = str.format("Close \"{0}\" by timeout {1}s", entryName, tradeDurationInSeconds)
strategy.close(entryName, comment = tradeComment, immediately = true)
// Create long and short conditions based on the crossover/under of 2 moving averages.
bool longCondition = ta.crossover(ta.sma(close, 14), ta.sma(close, 28))
bool shortCondition = ta.crossunder(ta.sma(close, 14), ta.sma(close, 28))
// Place long entry order upon `longCondition`.
if longCondition
strategy.entry("long", strategy.long)
// Place short entry order upon `shortCondition`.
if shortCondition
strategy.entry("short", strategy.short)
// Close positions after a configurable number of seconds.
closePositionsAfter(input(1200, "Timeout (seconds)"))
Note that:
The script uses either the time of the bar’s close using the time_close variable, or the current time from the timenow variable (if the strategy uses the calc_on_every_tick parameter).
The strategy.close() function uses the immediately argument to simulate trades at the end of the bar that exceeds the timer, rather than waiting for the opening of the next bar. Consequently, when a 120-second timeout is applied and the script runs on a 1-minute chart, it gives the appearance that trades last exactly two bars.
To create a bracket order, define a stop-loss and a take-profit order using a single strategy.exit() call.
To apply a specific risk-to-reward ratio, calculate the distance between the entry point and the stop-loss level. This stop distance represents the “risk”. Then place the take-profit order a certain multiple of the stop distance away. The distance to the take-profit order represents the “reward”, and the ratio between them is the risk:reward
(R:R
) ratio.
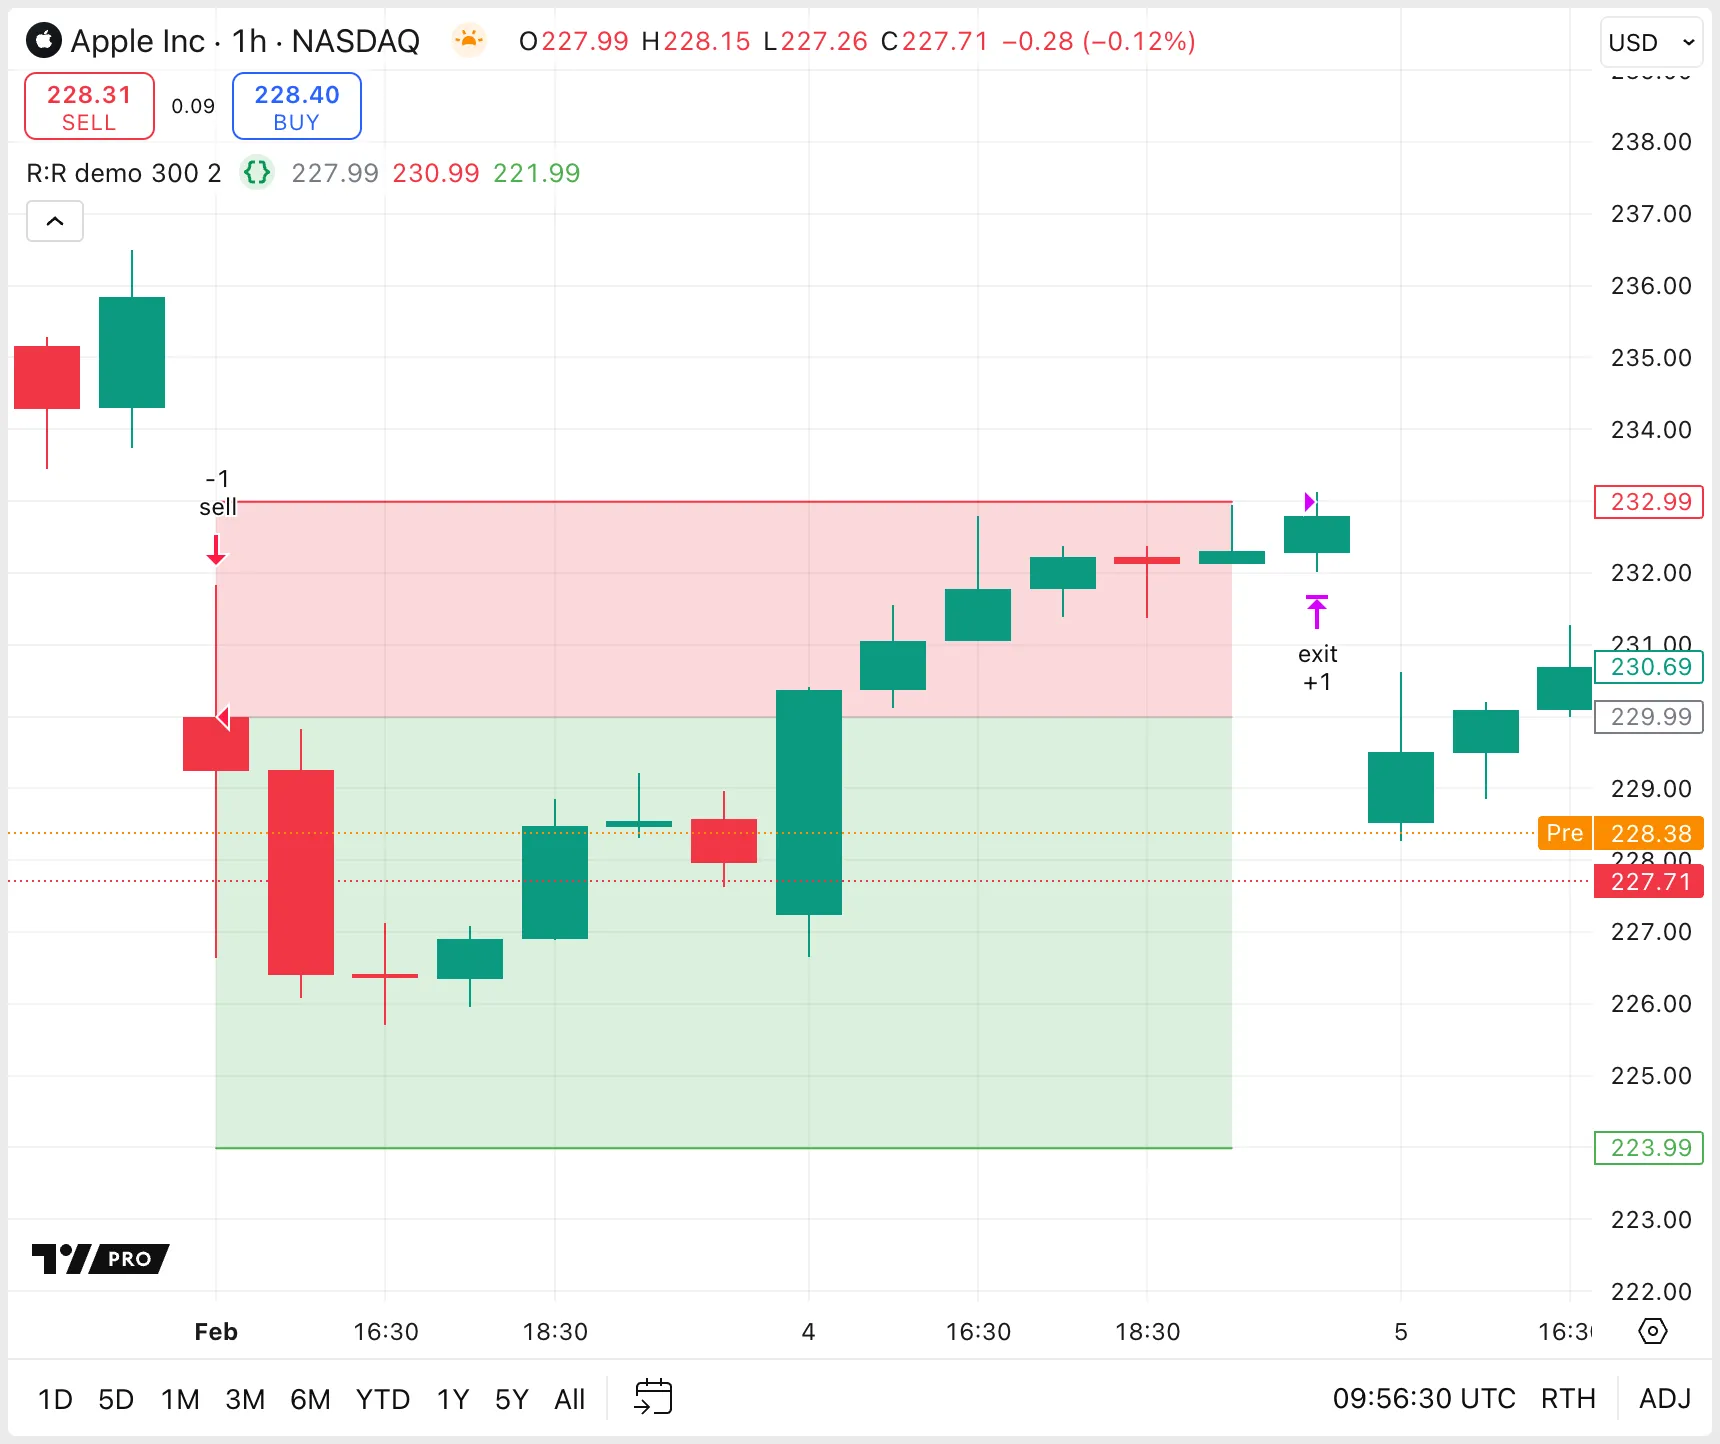
The following example script simulates long and short trades using inputs to define the stop distance in ticks and the R:R
ratio. The loss parameter of the strategy.exit() function is simply the stop distance. The profit parameter is the stop distance multiplied by the R:R
ratio. The script fills the areas between the entry and stop-loss points, and between the entry and take-profit points, to illustrate the risk and reward.
//@version=6
strategy("R:R demo", overlay = true)
// Declare the stop size in ticks and the risk-to-reward ratio as inputs.
int lossSizeInput = input.int(300, "Loss size (in ticks)", minval = 0)
float riskRewardInput = input.float(2.0, "Risk/Reward multiple", minval = 0)
// Create long and short entry conditions on MA crossover/crossunder, as long as we are not in a position.
float ma1 = ta.sma(close, 14), float ma2 = ta.sma(close, 28)
bool buyCondition = ta.crossover(ma1, ma2) and strategy.position_size == 0
bool sellCondition = ta.crossunder(ma1, ma2) and strategy.position_size == 0
// Place orders when `buyCondition` or `sellCondition` is true.
if buyCondition
strategy.entry("buy", strategy.long)
if sellCondition
strategy.entry("sell", strategy.short)
// Define exit point for the entries based on a predefined loss size.
// Calculate the profit target by multiplying the loss size with the user-defined risk-to-reward ratio.
strategy.exit("exit", loss = lossSizeInput, profit = lossSizeInput * riskRewardInput)
// Calculate the price equivalent of the profit and loss level.
float tradeBias = math.sign(strategy.position_size)
float stopLossPrice = strategy.position_avg_price - (tradeBias * lossSizeInput * syminfo.mintick)
float takeProfitPrice = strategy.position_avg_price + (tradeBias * lossSizeInput * syminfo.mintick * riskRewardInput)
// Plot the entry price, the stop price, and the price of the take-profit order.
plotEntry = plot(strategy.position_avg_price, "Entry price", color.new(color.gray, 70), style = plot.style_linebr)
plotStop = plot(stopLossPrice, "Stop-loss price", color.red, style = plot.style_linebr)
plotTP = plot(takeProfitPrice, "Take-profit price", color.green, style = plot.style_linebr)
// Highlight the R:R ratio by shading the area between the entry and the stop and the entry and the take-profit.
fill(plotStop, plotEntry, color.new(color.red, 80))
fill(plotTP, plotEntry, color.new(color.green, 80))
Adjusting the position size to risk a fixed percentage of equity normalizes risk exposure, regardless of equity fluctuations, and helps avoid disproportionate risks across a strategy’s trading history.
Calculate the position size so that as the stop distance increases, the position size decreases, and vice-versa, to maintain a constant risk percentage:
Calculate monetary risk per contract by multiplying the stop distance in ticks by the monetary value of each tick (syminfo.mintick) and by the number of units each contract represents (syminfo.pointvalue).
Determine risk amount by multiplying the current equity (strategy.equity) by the percentage of equity that you want to risk.
Calculate position size by dividing the risk amount by the risk per contract.
The following example script uses moving average crosses to generate long and short orders. The stop distance, risk:reward
ratio, and percentage of equity to risk are all configurable via inputs.
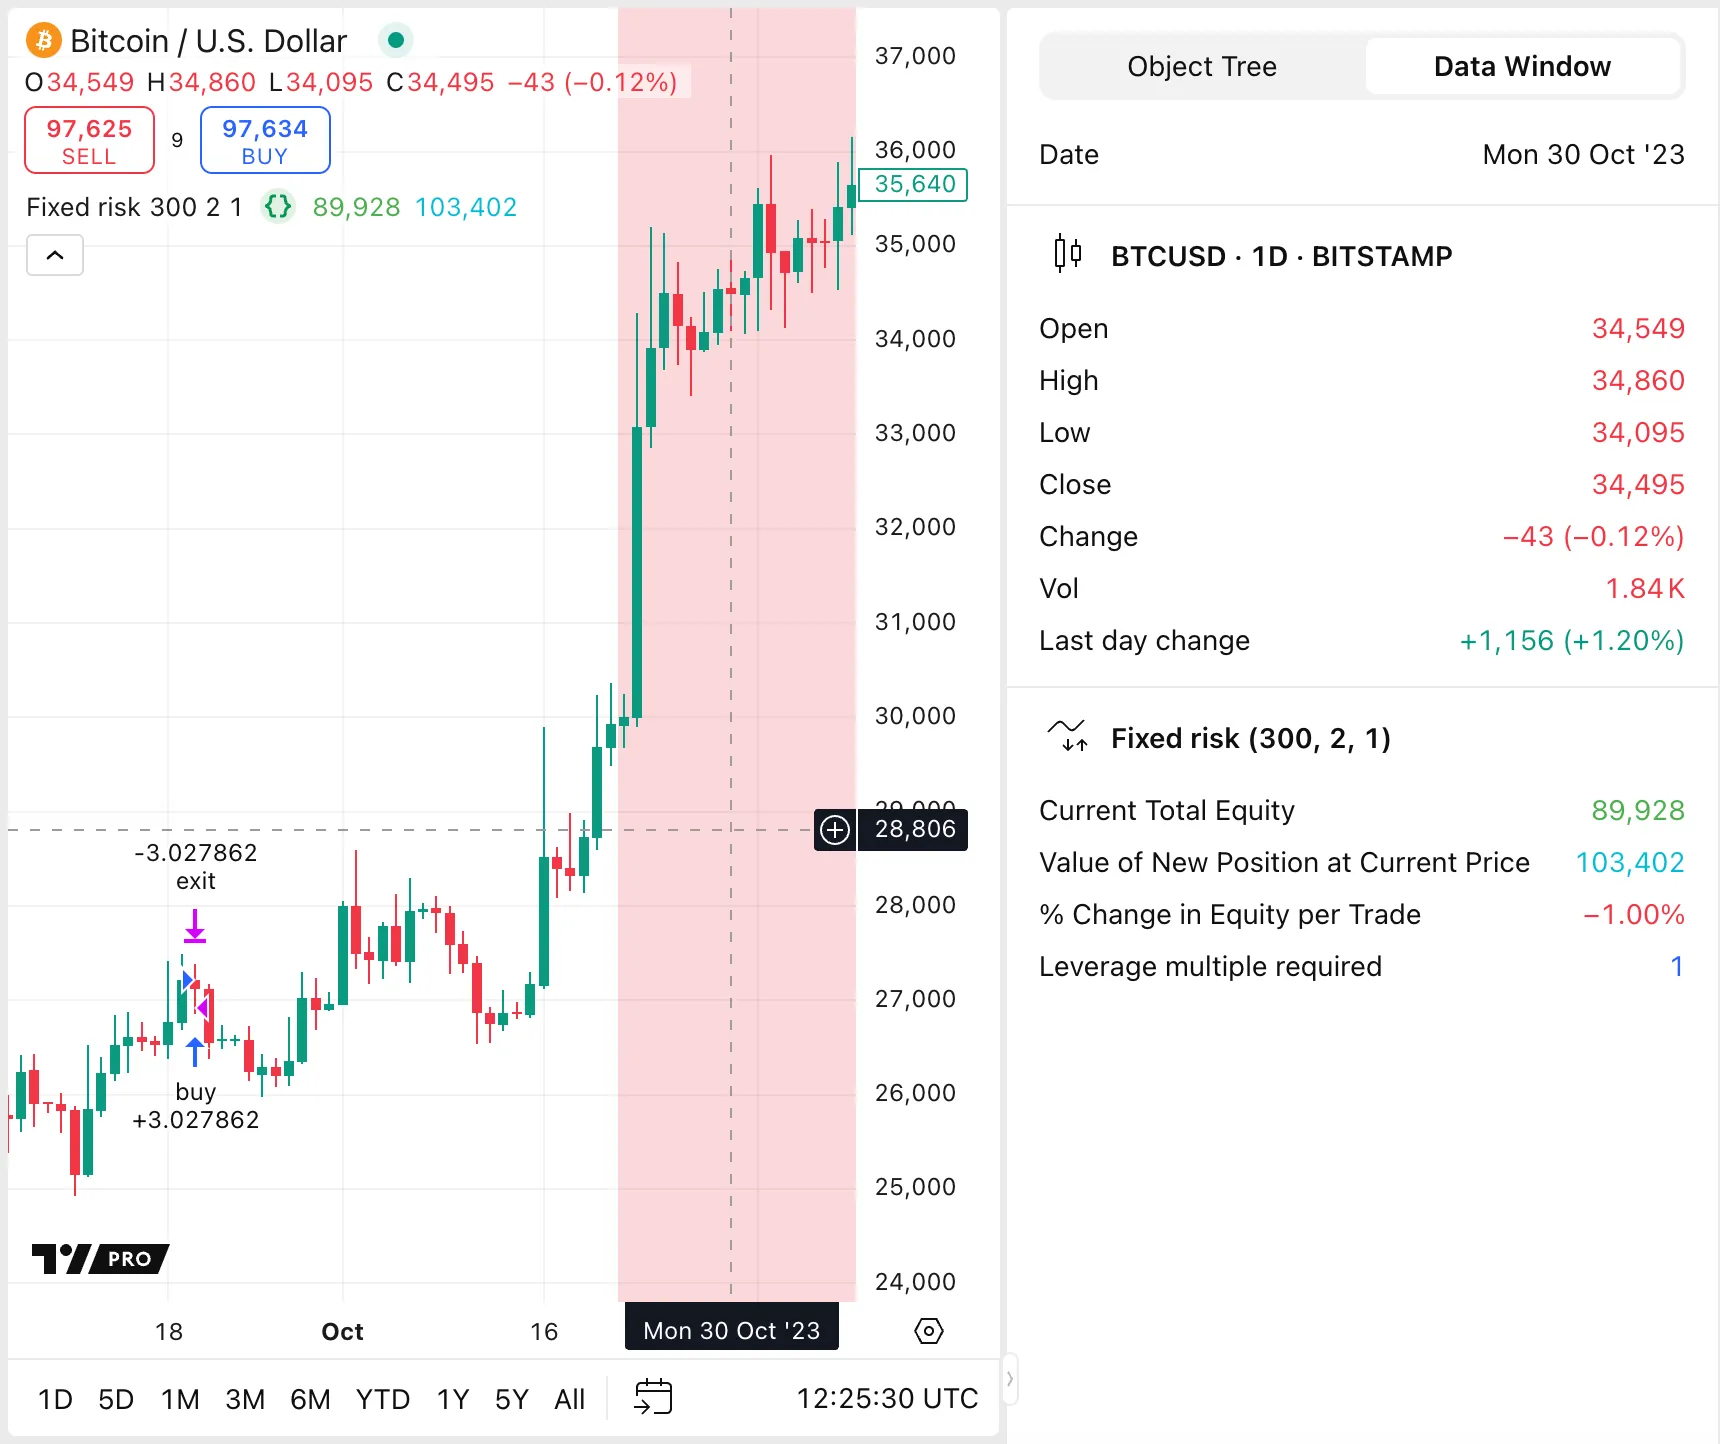
The script plots the current equity, the current value of a new position, and the percentage change in equity to the Data Window. Note that the actual exposure level can be less than intended if the available capital does not divide neatly by the unit value, particularly with small equity amounts, high unit prices, or assets such as stocks where trading partial shares is not possible.
Additionally, we display lines on the chart for the current total equity (in green) and the value of a position needed for the specified risk exposure at the current price (in blue). If the position value exceeds the total equity, the strategy requires leverage to achieve the required exposure, and the script colors the background red and displays the minimum leverage ratio needed in the data window.
//@version=6
strategy("Fixed risk", overlay = false, initial_capital = 100000)
// Specify the desired stop distance (in ticks), the trade R:R ratio, and the percentage of equity to risk.
int lossSizeInput = input.int(300, "Loss size (in ticks)", minval = 0)
float riskRewardInput = input.float(2.0, "Risk/Reward multiple", minval = 0)
float pctRiskInput = input.float(1.0, "% of equity to risk") / 100
// Create conditions for long/short entries on MA crossover/crossunder, if we are not in a position.
float ma1 = ta.sma(close, 14), float ma2 = ta.sma(close, 28)
bool buyCondition = ta.crossover(ma1, ma2) and strategy.position_size == 0
bool sellCondition = ta.crossunder(ma1, ma2) and strategy.position_size == 0
// Store the equity value at each trade entry, in order to calculate the percent change in equity.
var float equityAtEntry = 0.0
// Calculate the risk per contract of the instrument.
float riskPerContract = lossSizeInput * syminfo.mintick * syminfo.pointvalue
// Calculate the amount of equity to risk.
float equityToRisk = strategy.equity * pctRiskInput
// Determine the position size necessary to risk the specified percentage of the equity.
float positionSize = equityToRisk / riskPerContract
// Place orders when `buyCondition` or `sellCondition` is true.
if buyCondition
strategy.entry("buy", strategy.long, positionSize)
equityAtEntry := strategy.equity // Set the `equityAtEntry` variable to the current equity on each entry.
if sellCondition
strategy.entry("sell", strategy.short, positionSize)
equityAtEntry := strategy.equity
// Stop-loss level is from the user input. Profit target is the multiple of the loss size with the risk-to-reward ratio.
strategy.exit("exit", loss = lossSizeInput, profit = lossSizeInput * riskRewardInput)
// Calculate the percent equity change between the current equity and the equity at entry.
// On the exit bar of each trade, this value can be used to verify the percentage of equity risked.
float equityChgPercent = 100 * (strategy.equity - equityAtEntry) / equityAtEntry
color equityChgColor = equityChgPercent < 0 ? color.red : color.green,
// Display current equity and current value of a new position on the chart, and % change in equity to the Data Window.
plot(strategy.equity, "Current Total Equity", color.green, 2, display = display.all - display.pane)
plot(positionSize * close, "Value of New Position at Current Price", color.aqua, 2, display = display.all - display.pane)
plot(equityChgPercent, "% Change in Equity per Trade", equityChgColor, display = display.data_window, format = format.percent)
// Color the background red if the calculated risk value exceeds the available equity (leverage required).
bgcolor(strategy.equity < positionSize * close ? color.new(color.red, 80) : na)
// Plot the minimum leverage multiple required to open the position, applicable only if leverage is necessary.
plot(strategy.equity < positionSize * close ? positionSize * close / strategy.equity : na, "Leverage multiple required",
display = display.data_window)
Note that:
The stop distance in our example script is set to a constant value for demonstration purposes. In practice, the stop distance normally varies for each trade.
Strategy results can vary over time depending on where the historical data starts. The starting point of the data set aligns with the start of the nearest day, week, month or year, depending on the chart timeframe. Additionally, different TradingView plans provide access to varying amounts of historical bars. Refer to the User Manual entry on starting points for a discussion of these factors.
For strategies, this means the historical results seen today might change as the dataset’s starting point moves. This can lead to a natural repainting of strategy results over time. To reduce the effect of these changes on backtesting, follow these tips:
Export strategy results
Regularly exporting strategy results to file maintains a record of performance over time despite changes in historical data. Use the “Export Data” option in the top of the Strategy Tester to export data.
Use Deep Backtesting
Users with Premium and higher plans have access to the Deep Backtesting feature, which provides results from the entire available dataset of a symbol. Deep Backtesting results are displayed in the Strategy Tester but are not visible on the chart.
Use Bar Replay
Use the Bar Replay feature on the first chart bar to extend the dataset backward, allowing a strategy to run on an additional full dataset prior to the current range. This process can be repeated a few times to analyze multiple datasets.
Non-standard charts like
Heikin Ashi,
Renko,
Line Break,
Kagi,
Point & Figure, and
Range Charts
offer unique perspectives on price action. However, these chart types are not suited for strategy backtesting or automated trading systems execution, because the prices and time intervals do not match market prices and times.
Further, all non-standard chart types with the exception of Heikin Ashi charts form new price units based on price movement only and omit the element of time.
Both the distortion of price data and the omission of time in non-standard charts lead to unrealistic and potentially misleading backtesting results.
Programmers can specify the fill_orders_on_standard_ohlc parameter of the strategy declaration, which causes the strategy to calculate on standard chart data even if the current view is of Heikin Ashi candles. The user can do the same thing by by enabling the “Fill orders on standard OHLC” option in the strategy’s properties. This option has no effect on other non-standard chart types, because they use non-standard time as well as price.
For a more detailed analysis of how non-standard chart types affect strategy results, refer to this script from the PineCoders account.
Different TradingView plans give access to different amounts of historical information. To conduct more comprehensive backtesting in Pine Script, exploring further into an asset’s historical data, use Bar Replay or Deep Backtesting.
Bar Replay
Starting the Bar Replay from the first chart bar in history effectively rolls back the dataset to an earlier point in time. Each iteration of the bar replay extends the dataset further back, offering analysis of multiple historical datasets. However, there is a limit to the number of times this process can be repeated. This method has the added benefit of visualizing the strategy’s performance directly on the chart, which can be insightful for understanding trade entries, exits, and behavior during specific historical market conditions.
Deep Backtesting
For TradingView users with Premium and higher plans, the Deep Backtesting feature calculates the strategy on all historical data available for the selected symbol. The results are displayed in the Strategy Tester but are not visible on the chart. The results from Deep Backtesting might be different from results from the Strategy Tester in regular mode, as explained in this Help Center article.
Each Pine Script strategy runs on one symbol at a time. To evaluate a strategy across various markets or instruments:
Apply the strategy to the chart and then switch the chart to the desired symbol.
Use TradingView’s watchlist feature to organize and quickly access different symbols.
Export the results from the Strategy Tester and use external tools such as spreadsheet software to compare the performance of a strategy on different symbols.
The Bar Magnifier feature, available for TradingView Premium and Ultimate account holders, significantly enhances the accuracy of order fills in strategy backtests. This tool uses data from lower timeframes to obtain more detailed price movement within a bar, which can result in more precise
order fills. When selected, Bar Magnifier mode replaces the assumptions that the broker emulator must make about price movement using only a single set of OHLC values for each historical bar.
The Bar Magnifier chooses the lower timeframe based on the chart timeframe:
Chart Timeframe
Intrabar Timeframe
1S
1S
30S
5S
1
10S
5
30S
10
1
15
2
30
5
60
10
240
30
1D
60
3D
240
1W
1D
To fully appreciate the effectiveness of Bar Magnifier, refer to the script demonstrations in the section about Bar Magnifier in the User Manual.
Pine Script strategies and indicators cannot directly place orders on exchanges.
Traders can use external tools or platforms that can interpret alert signals from Pine scripts using webhooks and execute trades accordingly.
Adding a time delay between orders can help to prevent too many trades in a short time. Strategies can also prevent trading for a time after a series of losses. Here’s how to set up a time delay between orders:
Define the delay duration, whether in time units (minutes, hours, days) or a number of bars. For time-based delays, convert the chosen time unit into milliseconds, because Pine time variables use milliseconds.
If the difference between the current bar time or bar_index and that of the last trade’s exit exceeds the delay duration, set a boolean flag to allow new orders. Make sure to include the flag in the strategy entry conditions.
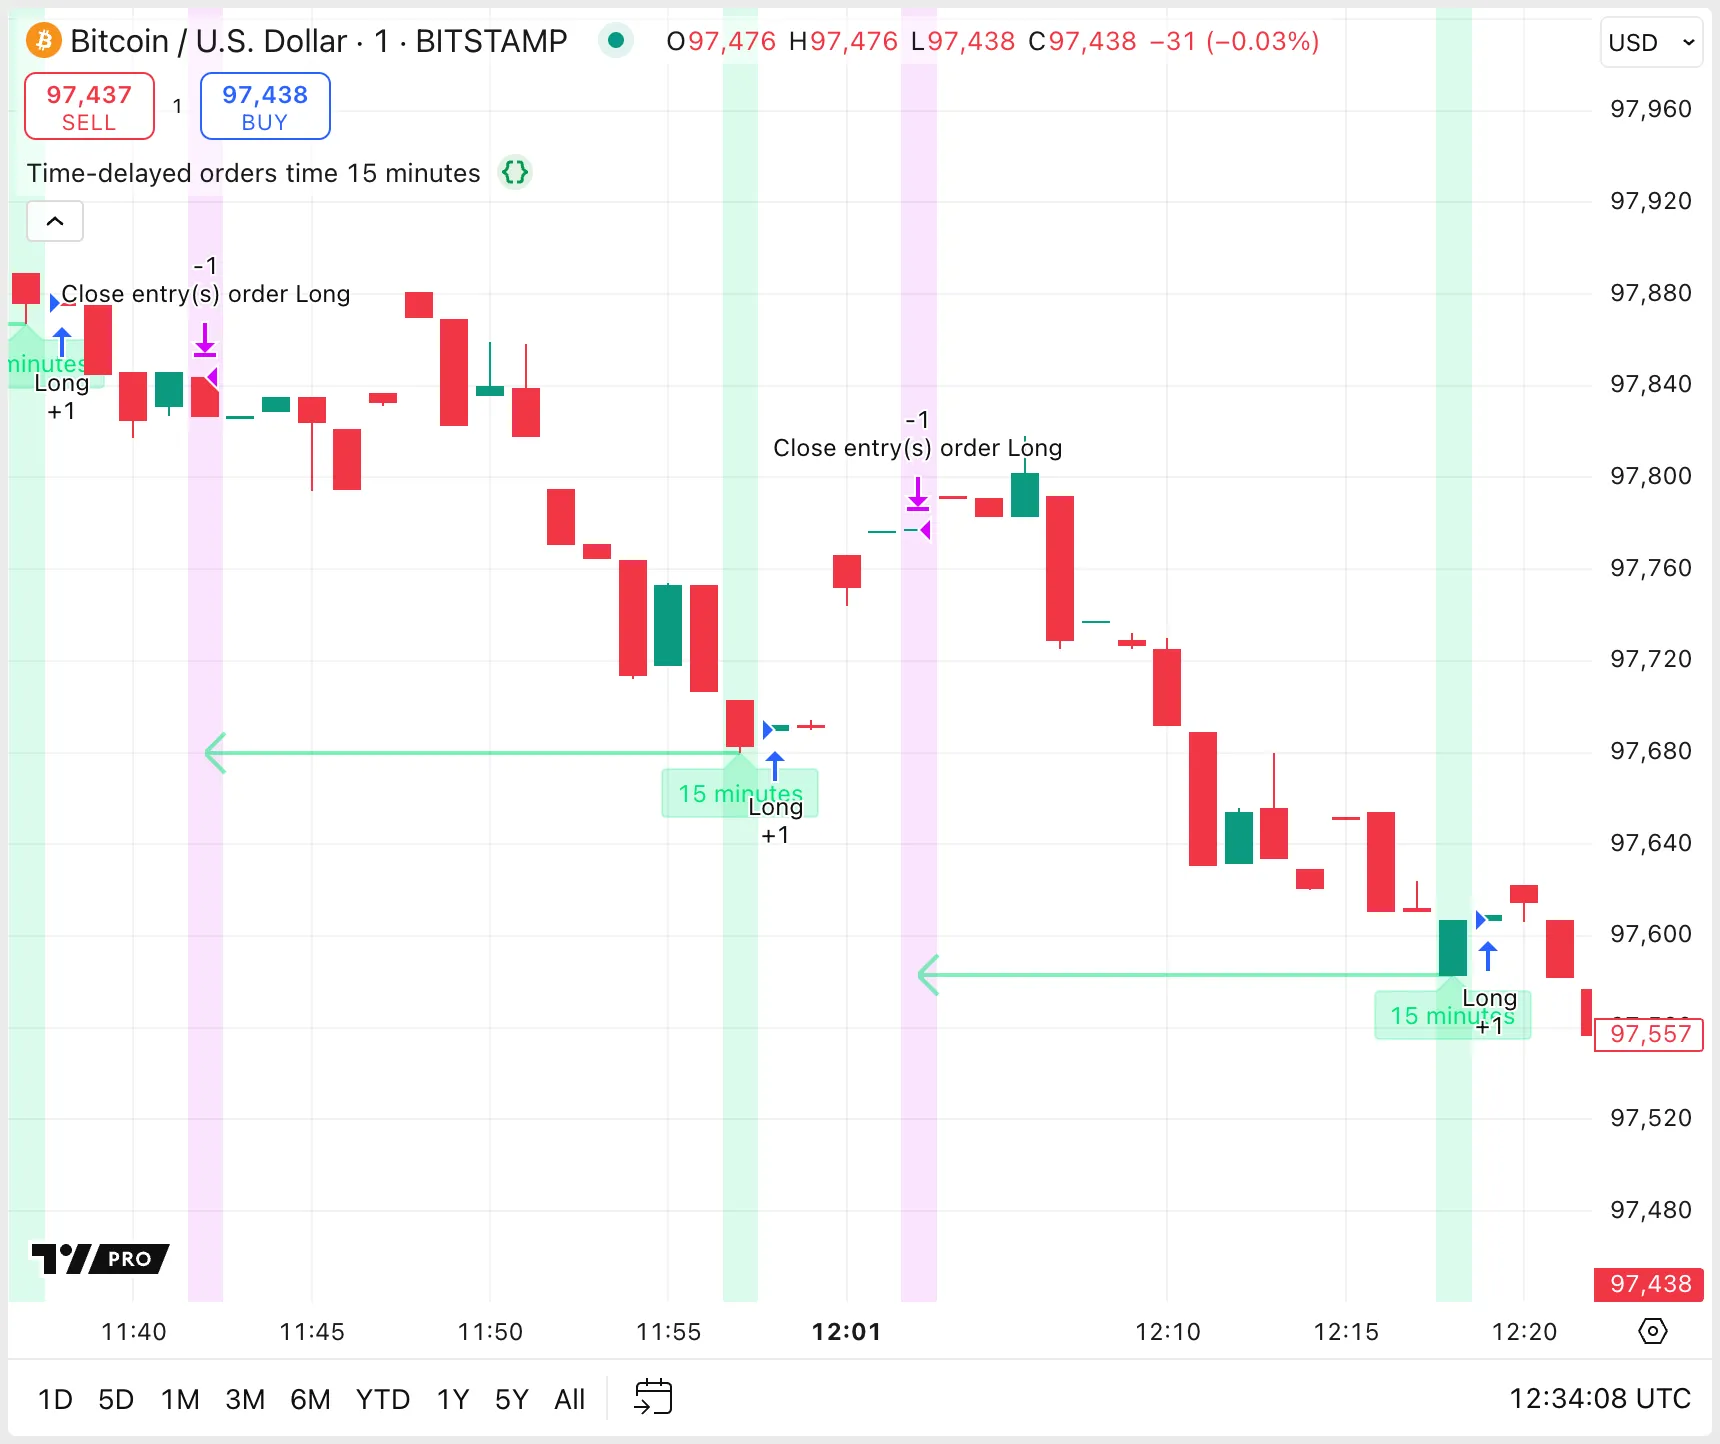
The following example script provides two methods for delaying orders: a time-based delay or a specified number of bars. The strategy creates a long entry order when either the time of a bar or its bar_index exceeds the set delay from the last active trade bar. No other conditions are used for entry in this demonstration, but users can add their own logic to these conditions.
To keep the chart clean, the script calls the strategy.close() function to close active trades after they have been open for 10 bars. The script uses background shading, labels and arrows to illustrate the trade entries and exits.
//@version=6
strategy("Time-delayed orders", overlay=true, max_labels_count = 500, max_lines_count = 500)
import PineCoders/Time/4 as PCtime
// Constants
string TU1 = "seconds", string TU2 = "minutes", string TU3 = "hours", string TU4 = "days"
string TU5 = "weeks", string TU6 = "months", string DT1 = "bars", string DT2 = "time"
// Tooltips for inputs
string D_TT = "Delay orders for a specific number of bars or a specific duration of time since the last trade."
string N_TT = "Specify the number of bars or time units for the delay."
string U_TT = "Unit of time; relevant only if the delay type is 'time'."
// User inputs for delay type, number of units/bars, and time units.
string delayTypeInput = input.string(DT2, "Delay type", tooltip = D_TT, options = [DT1, DT2])
int nInput = input.int(15, "Number of bars or time units", tooltip = N_TT)
string unitsInput = input.string(TU2, "Time units", tooltip = U_TT, options = [TU1, TU2, TU3, TU4, TU5])
// Convert the time unit string input to a value in milliseconds for use in the time delay calculation.
int mult = switch unitsInput
TU1 => 1000
TU2 => 60000
TU3 => 3600000
TU4 => 86400000
TU5 => 604800000
=> 2628003000
bool useTimeDelay = delayTypeInput == DT2 // Use time delay or not.
int timeOfExit = strategy.closedtrades.exit_time(strategy.closedtrades - 1) // Time of last trade exit.
int barOfExit = strategy.closedtrades.exit_bar_index(strategy.closedtrades - 1) // Bar index of last trade exit.
int timeSinceExit = time - timeOfExit // Calculate the time since the last trade.
int barsSinceExit = bar_index - barOfExit // Calculate the number of bars since the last trade.
bool timeAllowed = (timeSinceExit >= nInput * mult or na(timeOfExit)) and useTimeDelay
bool barAllowed = (bar_index - barOfExit >= nInput or na(barOfExit)) and not useTimeDelay
// Allow entry of a trade if the delay has passed and we're not in a position.
bool entryCondition = (timeAllowed or barAllowed) and strategy.position_size == 0
bool tradeExited = barOfExit == bar_index // Did the trade exit on the current bar?
if entryCondition // Enter the trade if conditions allow.
strategy.entry("Long", strategy.long)
// Set label text: format time or show bar count since last trade.
string labelTxt = useTimeDelay ? PCtime.formattedNoOfPeriods(timeSinceExit, unitsInput) : str.format("{0} bars", barsSinceExit)
label.new(bar_index, low, labelTxt,
color = color.new(color.lime, 80),
textcolor = color.lime,
style = label.style_label_up)
line.new(timeOfExit, low, time, low, xloc.bar_time,
color = color.new(color.lime, 50),
style = line.style_arrow_left,
width = 2)
if bar_index % 10 == 0 // Close any open position on every tenth bar.
strategy.close("Long")
bgcolor(entryCondition ? color.new(color.lime, 85) : tradeExited ? color.new(color.fuchsia, 85) : na)
Consider the following limitations when adding time-based delays.
Historical bars
Strategies calculate at the close of each bar, so they can only evaluate time-based conditions at that moment. This constraint entails that on historical bars, delay times are assessed in increments equal to the chart bar’s duration.
Session times
Strategies cannot evaluate delays when the market is closed, because there are no price updates to trigger script execution. This means that if a delay extends beyond the end of a trading session, the delay condition cannot be identified until the script runs again on the next session, resulting in a longer-than-anticipated time between orders.
Delay duration on different timeframes
If the delay value is not divisible by the duration of a chart bar, each delay lasts at least one additional chart bar. For instance, setting a delay of 100 seconds on a 1-minute chart effectively means a minimum of two bars before the delay is exceeded.
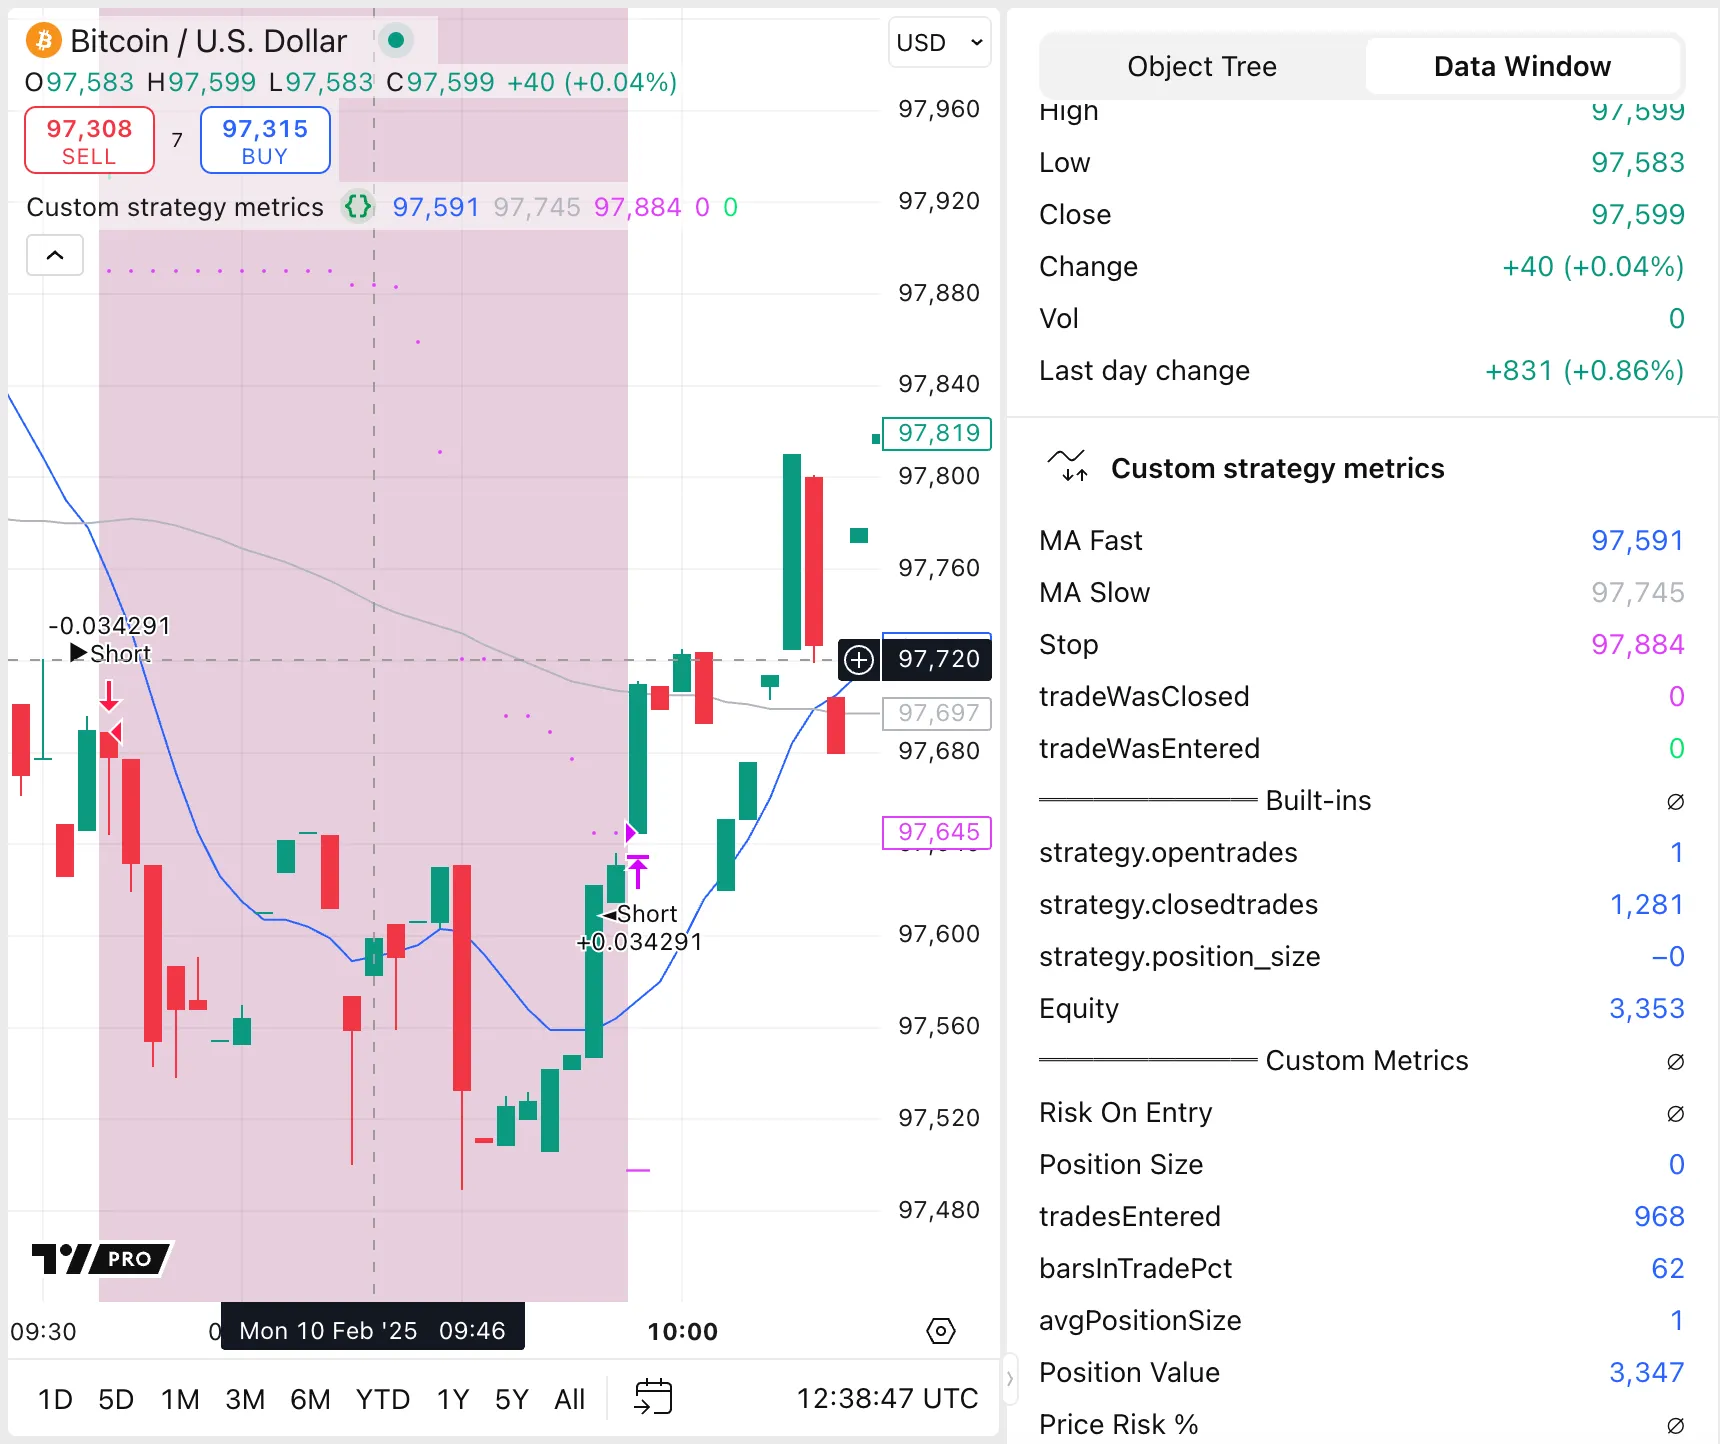
To track metrics other than the default metrics that the Strategy Tester tracks, strategies can calculate custom statistics. These calculations might need to detect order executions, track closed trades, monitor entries into trades, and assess whether a trade is active. Changes in built-in variables such as strategy.opentrades and strategy.closedtrades can track the execution of orders.
The following example script uses a moving average crossover strategy to generate orders. It calculates custom metrics, including the price risk at entry, average position size, and the average percentage of bars involved in trades across the dataset, and plots the custom metrics and some built-in variables to the Data Window. Users can view the history of values plotted in the Data Window by moving the cursor over any bar. In contrast, the Strategy Tester summarizes data over the entire testing period.
//@version=6
strategy("Custom strategy metrics", "", true, initial_capital = 10000, commission_type = strategy.commission.percent,
commission_value = 0.075, max_bars_back = 1000, default_qty_type = strategy.percent_of_equity,
default_qty_value = 100)
// Calculate entry conditions.
float c = math.round_to_mintick(close) // Round OHLC to chart prices.
float maF = math.round_to_mintick(ta.sma(hlc3, 10)), float maS = math.round_to_mintick(ta.sma(hlc3, 60))
bool enterLong = ta.crossover(maF, maS), bool enterShort = ta.crossunder(maF, maS) // Entry conditions.
float stopLong = ta.lowest(20)[1], float stopShort = ta.highest(20)[1] // Stop-loss order levels.
// Enter a new position or reverse, unless stop could not be calculated yet.
if enterLong and not na(stopLong)
strategy.entry("Long", strategy.long, comment = "►Long")
if enterShort and not na(stopShort)
strategy.entry("Short", strategy.short, comment = "►Short")
// Modify existing exit orders using the current stop value.
strategy.exit("◄Long", "Long", stop = stopLong), strategy.exit("◄Short", "Short", stop = stopShort)
// Generate custom statistics.
float riskOnEntry = math.abs(c - (enterLong ? stopLong : enterShort ? stopShort : na)) // Trade risk at entry.
int changeInClosedTrades = ta.change(strategy.closedtrades)
int changeInOpenTrades = ta.change(strategy.opentrades)
bool tradeWasClosed = changeInClosedTrades != 0
bool tradeWasEntered = changeInOpenTrades > 0 or (strategy.opentrades == strategy.opentrades[1] and tradeWasClosed) or
changeInClosedTrades > 1
bool tradeIsActive = strategy.opentrades != 0 // Check if a trade is currently active.
float barsInTradePct = 100 * ta.cum(tradeIsActive ? 1 : 0) / bar_index // Percentage of bars on which a trade was open.
float tradesEntered = ta.cum(tradeWasEntered ? 1 : 0)
float positionSize = math.abs(strategy.position_size)
float avgPositionSize = ta.cum(nz(positionSize))[1] / tradesEntered // Calculate average position size.
float positionValue = positionSize * close // Position monetary value
float priceRiskPct = riskOnEntry / close // Risk percentage of trade relative to entry price.
float tradeRiskPct = positionSize * riskOnEntry // Monetary risk of the trade.
float stop = strategy.position_size > 0 ? stopLong : strategy.position_size < 0 ? stopShort : na
// Plot the MAs, stop price, and markers for entries and exits to the chart.
plot(maF,"MA Fast"), plot(maS, "MA Slow", color.silver), plot(stop, "Stop", color.fuchsia, 1, plot.style_circles)
plotchar(tradeWasClosed, "tradeWasClosed", "—", location.bottom, color.fuchsia, size = size.tiny)
plotchar(tradeWasEntered, "tradeWasEntered", "+", location.top, color.lime, size = size.tiny)
// Highlight the background while long and short positions are active.
bgcolor(strategy.position_size > 0 ? color.new(color.teal, 80) : strategy.position_size < 0 ? color.new(color.maroon, 80) : na)
// Plot statistics to the Data Window.
plot(na, "════════ Built-ins", display = display.data_window)
plot(strategy.opentrades, "strategy.opentrades", display = display.data_window)
plot(strategy.closedtrades, "strategy.closedtrades", display = display.data_window)
plot(strategy.position_size, "strategy.position_size", display = display.data_window)
plot(strategy.equity, "Equity", display = display.data_window)
plot(na, "════════ Custom Metrics", display = display.data_window)
plot(riskOnEntry, "Risk On Entry", display = display.data_window)
plot(positionSize, "Position Size", display = display.data_window)
plot(tradesEntered, "tradesEntered", display = display.data_window)
plot(barsInTradePct, "barsInTradePct", display = display.data_window)
plot(avgPositionSize, "avgPositionSize", display = display.data_window)
plot(positionValue, "Position Value", display = display.data_window)
plot(priceRiskPct, "Price Risk %", display = display.data_window)
plot(tradeRiskPct, "Trade Risk Value", display = display.data_window)
Note that:
The strategy incorporates trading costs. Failing to account for these costs can lead to an unrealistic perception of strategy performance and diminish the credibility of test results.
We round the
open,
high,
low and
close
(OHLC) built-in variables to the symbol’s precision. This rounding ensures that any statistics the script calculates align within the Strategy Tester and with strategy order-related built-in variables.
The script creates global variables for the changes in built-in variables for open and closed trades so that the ta.change function is called on every bar for consistency.
Trading with leverage means borrowing capital from a broker to control larger position sizes than the amount of capital risked. This amplifies both potential profits and losses, making it a powerful but risky tool. The amount of the trader’s capital that they risk is called the margin.
For example, setting a 20% margin ratio means that the trader’s balance funds only 20% of the position’s value, allowing positions up to five times the account balance. A margin ratio of 20% is therefore the same as 5:1 leverage. With an available balance of $10,000 and a 20% margin setting, a strategy can open positions up to $50,000 in value.
Pine Script strategies can simulate trading with leverage by specifying margin requirements for long and short positions. Users can adjust the “Margin for long positions” and Margin for short positions” in the strategy’s “Properties” tab. Programmers can set the default margin in the script using the margin_long and margin_short parameters in the strategy() declaration function.
When traders offset the risk of one position by opening another position at the same time, this is called hedging.
The main ways to hedge an open position are:
By opening a second position in a related asset that is expected to move in the opposite direction to the first asset.
By opening a short position to offset a long position or vice-versa.
By using derivatives such as options.
Strategies cannot use these methods, because Pine strategies can only have positions open in one direction at a time, either long or short. Pine strategies run on only the chart asset and cannot open positions in different assets.
Pine Script does not support placing orders using the brokers integrated via the Trading Panel, or using TradingView’s built-in paper trading account. The Strategy Tester closely mimics a paper trading account by simulating orders and tracking theoretical positions and capital in a risk-free environment.
Strategies can customize order fill alerts to include detailed results and performance metrics in the alert strings, providing a record of the strategy’s theoretical fills and overall performance in realtime.
If a strategy that is running on the chart does not place any orders, the Strategy Tester’s “Overview” tab displays the message, “This strategy did not generate any orders throughout the testing range.”
By contrast, while no strategy is loaded and visible on the chart, the Strategy Tester displays a different message: “To test a strategy, apply it to the chart.”
If a valid script that uses the strategy() declaration statement is running but is not placing any orders, consider the following potential problems and their solutions:
Verify that the strategy has enough initial capital to cover the position sizes it attempts to open. Remember, the cost of entering a futures contract position is the chart price multiplied by the syminfo.pointvalue, which can be significantly greater than the chart price. For a quick fix, increase the initial capital to a very high value in the Properties tab.
Runtime errors
Check for runtime errors indicated by a red exclamation mark on the chart pane next to the script’s title. Resolve any issues by correcting the script as necessary.
For more detailed guidance and troubleshooting tips, refer to the dedicated article on this topic in the Help Center.
If a strategy places one or more orders early in the testing range but then stops placing orders, check the following issues.
Total account loss
Check whether the simulated account balance experienced a total loss of equity earlier in the available history. As a result, the account might lack sufficient capital to continue trading the symbol and fail to show trades only in the chart’s recent history.
No exit condition
Some programmers define entry conditions that rely on having no positions currently open. Make sure to explicitly close trades by specifying corresponding exit conditions for all trades. Without explicit instructions to close an open position using strategy.close() or strategy.exit() commands, the strategy might display only a single entry order early in the chart’s history and in the List of Trades tab. If trades are not closed, they do not generate results in the Overview.
Pine scripts repaint if they behave differently on historical and realtime bars. If strategies repaint, their backtesting results are not reliable because they do not accurately represent the strategy’s behavior in realtime.
Some strategy properties cause repainting:
The calc_on_every_tick setting causes a strategy to recalculate with every price update, which may cause orders and alerts to trigger during the formation of a bar in realtime. By contrast, on historical bars, calculations are performed at the close of the bar.
The calc_on_order_fills setting causes a strategy to recalculate immediately after simulating an order fill. For example, this feature is particularly useful for strategies that rely on entry prices to set exit prices on the entry bar, rather than waiting for the bar to close, such as the first example script in the FAQ entry How can I set stop-loss and take-profit levels as a percentage from my entry point using calc_on_order_fills? However, using this setting can introduce lookahead bias into the strategy, leading to potentially unrealistic outcomes. For instance, if a strategy’s entry conditions are met within a bar that also triggers an exit, the strategy would execute an entry order within the same bar on the next tick. On historical bars, such entries could occur at any of the bar’s open, high, low, or close (OHLC) prices, resulting in entry prices that are unrealistically favorable.
Since strategies and their alerts execute at the close of a historical bar, the next possible moment for an entry order to be filled is the beginning of the next bar. However, the process_orders_on_close setting causes the strategy to use the close price of the bar where the condition is met for its order prices instead. See the FAQ entry Why are my orders executed on the bar following my triggers? for more information.
Additionally, using unfixed data from a higher timeframe can cause repainting. If the data from the higher timeframe changes during the higher timeframe bar, this can change the script’s oputput for historical bars.
Ensure that strategies use only fixed values from a higher timeframe, as described in Avoiding repainting.
Although these are the most common causes of repainting in strategies, they are not the only causes. For additional information, refer to the section on repainting in the User Manual.
In automated trading strategies, it is common practice to set stop-loss and take-profit orders at the same time as an entry order, using the alert from the entry order as a trigger. In this case, sending alerts for the stop-loss and take-profit order fills can be unnecessary or even problematic. To disable alerts for a specific order placement command, set the disable_alert parameter to true. The broker emulator still simulates the fills for these orders, but sends no alerts for them.
Here is an example of an order fill command with this parameter set: