OPEN-SOURCE SCRIPT
BIST30 % Above Moving Average (Breadth)
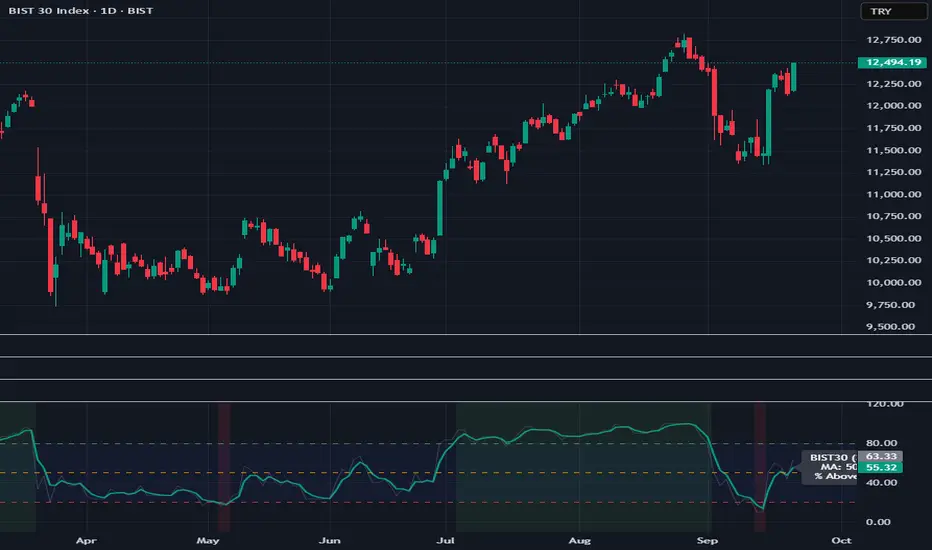
BIST30 % Above Moving Average (Breadth)
This indicator shows the percentage of BIST30 stocks trading above a selected moving average.
It is a market breadth tool, designed to measure the overall health and participation of the market.
How it works
By default, it uses the 50-day SMA.
You can switch between SMA/EMA and choose different periods (5 / 20 / 50 / 200).
The script checks each BIST30 stock individually and counts how many are closing above the chosen MA.
Interpretation
Above 80% → Overbought zone (short-term correction likely).
Below 20% → Oversold zone (potential rebound).
Around 50% → Neutral / indecisive market.
If the index (BIST:XU030) rises while this indicator falls → the rally is narrow-based, led by only a few stocks (a warning sign).
Use cases
Short-term traders → Use MA=5 or 20 for momentum signals.
Swing / Medium-term investors → Use MA=50 for market health.
Long-term investors → Use MA=200 to track bull/bear market cycles.
Notes
This script covers only BIST30 stocks by default.
The list can be updated for BIST100 or specific sectors (e.g., banks, industrials).
Breadth indicators should not be used as standalone buy/sell signals — combine them with price action, volume, and other technical tools for confirmation.
開源腳本
秉持TradingView一貫精神,這個腳本的創作者將其設為開源,以便交易者檢視並驗證其功能。向作者致敬!您可以免費使用此腳本,但請注意,重新發佈代碼需遵守我們的社群規範。
免責聲明
這些資訊和出版物並非旨在提供,也不構成TradingView提供或認可的任何形式的財務、投資、交易或其他類型的建議或推薦。請閱讀使用條款以了解更多資訊。
開源腳本
秉持TradingView一貫精神,這個腳本的創作者將其設為開源,以便交易者檢視並驗證其功能。向作者致敬!您可以免費使用此腳本,但請注意,重新發佈代碼需遵守我們的社群規範。
免責聲明
這些資訊和出版物並非旨在提供,也不構成TradingView提供或認可的任何形式的財務、投資、交易或其他類型的建議或推薦。請閱讀使用條款以了解更多資訊。