OPEN-SOURCE SCRIPT
AE - ATR Exhaustion Channel
AE - ATR Exhaustion Channel
📈 Overview
Identify Exhaustion Zones & Trend Breakouts with ATR Precision!
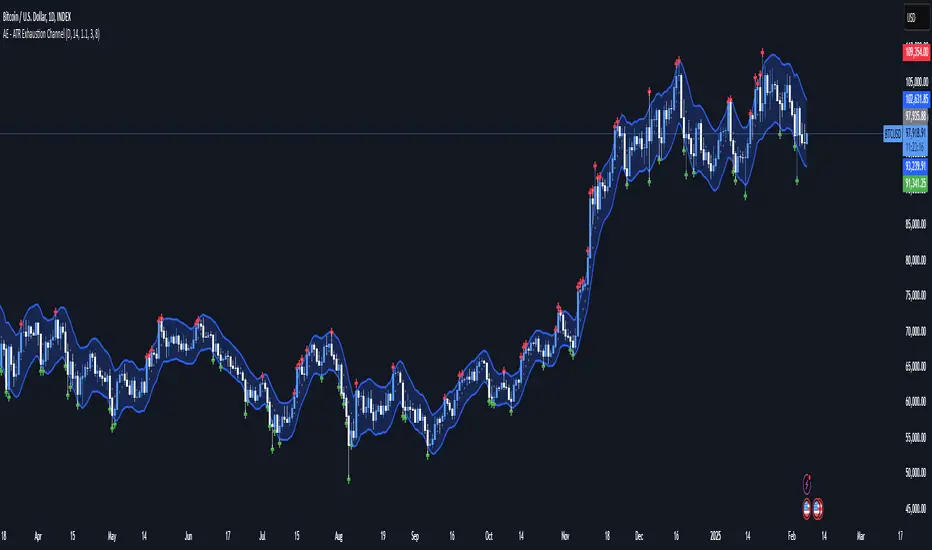
The AE - ATR Exhaustion Channel is a powerful volatility-based trading tool that combines an averaged SMA with ATR bands to dynamically highlight potential trend exhaustion zones. It provides real-time breakout detection by marking when price moves beyond key volatility bands, helping traders spot overextensions and reversals with ease.
🔑 Key Features
✔️ ATR-SMA Hybrid Channel: Uses an averaged SMA as the core trend filter while incorporating adaptive ATR-based bands for precise volatility tracking.
✔️ Dynamic Exhaustion Markers: Marks red crosses when price exceeds the upper band and green crosses when price drops below the lower band.
✔️ Customizable ATR Sensitivity: Adjust the ATR multiplier and length settings to fine-tune band sensitivity based on market conditions.
✔️ Clear Channel Visualization: A gray SMA midpoint and a blue-filled ATR band zone make it easy to track market structure.
📚 How It Works
1️⃣ Averaged SMA Calculation: The script calculates an averaged SMA over a user-defined range (min/max period). This smooths out short-term fluctuations while preserving trend direction.
2️⃣ ATR Band Construction: The ATR value (adjusted by a multiplier) is added to/subtracted from the SMA to form dynamic upper and lower volatility bands.
3️⃣ Exhaustion Detection:
If high > upper ATR band, a red cross is plotted (potential overextension).
If low < lower ATR band, a green cross is plotted (potential reversal zone).
4️⃣ Filled ATR Channel: The area between the upper and lower bands is shaded blue, providing a visual trading range.
🎨 Customization & Settings
⚙️ ATR Length – Adjusts the ATR calculation period (default: 14).
⚙️ ATR Multiplier – Scales the ATR bands for tighter or wider volatility tracking (default: 0.8, adjustable in 0.1 steps).
⚙️ SMA Range (Min/Max Length) – Defines the period range for calculating the averaged SMA (default: 5-20).
⚙️ Rolling Lookback Length – Controls how far back the high/low comparison is calculated (default: 50 bars).
🚀 Practical Usage
📌 Spotting Exhaustion Zones – Look for red/green markers appearing outside the ATR bands, signaling potential trend exhaustion and possible reversal opportunities.
📌 Breakout Confirmation – Price consistently breaching the upper band with momentum could indicate continuation, while repeated touches without strong closes may hint at reversal zones.
📌 Trend Reversal Signals – Watch for green markers below the lower band in uptrends (buy signals) and red markers above the upper band in downtrends (sell signals).
🔔 Alerts & Notifications
📢 Set Alerts for Exhaustion Signals!
Traders can configure alerts to trigger when price breaches the ATR bands, allowing for instant notifications when volatility-based exhaustion is detected.
📊 Example Scenarios
✔ Trend Exhaustion in Overextended Moves – A series of red crosses near resistance may indicate a short opportunity.
✔ Trend Exhaustion in Overextended Moves – A series of red crosses near resistance may indicate an opportunity to open a short trade.
✔ Volatility Compression Breakouts – If price consolidates within the ATR bands and suddenly breaks out, it could signify a momentum shift.
✔ Reversal Catching in Trending Markets – Spot potential trend reversals by looking for green markers below the ATR bands in bullish markets.
🌟 Why Choose AE - ATR Exhaustion Channel?
Trade with Confidence. Spot Volatility. Catch Breakouts.
The AE - ATR Exhaustion Channel is an essential tool for traders looking to identify trend exhaustion, detect breakouts, and manage volatility effectively. Whether you're trading stocks, crypto, or forex, this ATR-SMA hybrid system provides clear visual cues to help you stay ahead of market moves.
✅ Customizable to Fit Any Market
✅ Combines Volatility & Trend Analysis
✅ Easy-to-Use with Instant Breakout Detection
📈 Overview
Identify Exhaustion Zones & Trend Breakouts with ATR Precision!
The AE - ATR Exhaustion Channel is a powerful volatility-based trading tool that combines an averaged SMA with ATR bands to dynamically highlight potential trend exhaustion zones. It provides real-time breakout detection by marking when price moves beyond key volatility bands, helping traders spot overextensions and reversals with ease.
🔑 Key Features
✔️ ATR-SMA Hybrid Channel: Uses an averaged SMA as the core trend filter while incorporating adaptive ATR-based bands for precise volatility tracking.
✔️ Dynamic Exhaustion Markers: Marks red crosses when price exceeds the upper band and green crosses when price drops below the lower band.
✔️ Customizable ATR Sensitivity: Adjust the ATR multiplier and length settings to fine-tune band sensitivity based on market conditions.
✔️ Clear Channel Visualization: A gray SMA midpoint and a blue-filled ATR band zone make it easy to track market structure.
📚 How It Works
1️⃣ Averaged SMA Calculation: The script calculates an averaged SMA over a user-defined range (min/max period). This smooths out short-term fluctuations while preserving trend direction.
2️⃣ ATR Band Construction: The ATR value (adjusted by a multiplier) is added to/subtracted from the SMA to form dynamic upper and lower volatility bands.
3️⃣ Exhaustion Detection:
If high > upper ATR band, a red cross is plotted (potential overextension).
If low < lower ATR band, a green cross is plotted (potential reversal zone).
4️⃣ Filled ATR Channel: The area between the upper and lower bands is shaded blue, providing a visual trading range.
🎨 Customization & Settings
⚙️ ATR Length – Adjusts the ATR calculation period (default: 14).
⚙️ ATR Multiplier – Scales the ATR bands for tighter or wider volatility tracking (default: 0.8, adjustable in 0.1 steps).
⚙️ SMA Range (Min/Max Length) – Defines the period range for calculating the averaged SMA (default: 5-20).
⚙️ Rolling Lookback Length – Controls how far back the high/low comparison is calculated (default: 50 bars).
🚀 Practical Usage
📌 Spotting Exhaustion Zones – Look for red/green markers appearing outside the ATR bands, signaling potential trend exhaustion and possible reversal opportunities.
📌 Breakout Confirmation – Price consistently breaching the upper band with momentum could indicate continuation, while repeated touches without strong closes may hint at reversal zones.
📌 Trend Reversal Signals – Watch for green markers below the lower band in uptrends (buy signals) and red markers above the upper band in downtrends (sell signals).
🔔 Alerts & Notifications
📢 Set Alerts for Exhaustion Signals!
Traders can configure alerts to trigger when price breaches the ATR bands, allowing for instant notifications when volatility-based exhaustion is detected.
📊 Example Scenarios
✔ Trend Exhaustion in Overextended Moves – A series of red crosses near resistance may indicate a short opportunity.
✔ Trend Exhaustion in Overextended Moves – A series of red crosses near resistance may indicate an opportunity to open a short trade.
✔ Volatility Compression Breakouts – If price consolidates within the ATR bands and suddenly breaks out, it could signify a momentum shift.
✔ Reversal Catching in Trending Markets – Spot potential trend reversals by looking for green markers below the ATR bands in bullish markets.
🌟 Why Choose AE - ATR Exhaustion Channel?
Trade with Confidence. Spot Volatility. Catch Breakouts.
The AE - ATR Exhaustion Channel is an essential tool for traders looking to identify trend exhaustion, detect breakouts, and manage volatility effectively. Whether you're trading stocks, crypto, or forex, this ATR-SMA hybrid system provides clear visual cues to help you stay ahead of market moves.
✅ Customizable to Fit Any Market
✅ Combines Volatility & Trend Analysis
✅ Easy-to-Use with Instant Breakout Detection
開源腳本
秉持TradingView一貫精神,這個腳本的創作者將其設為開源,以便交易者檢視並驗證其功能。向作者致敬!您可以免費使用此腳本,但請注意,重新發佈代碼需遵守我們的社群規範。
Access more of our systems and insights at alphaextract.xyz
All analysis provided by Alpha Extract is for educational and informational purposes only.
All analysis provided by Alpha Extract is for educational and informational purposes only.
免責聲明
這些資訊和出版物並非旨在提供,也不構成TradingView提供或認可的任何形式的財務、投資、交易或其他類型的建議或推薦。請閱讀使用條款以了解更多資訊。