OPEN-SOURCE SCRIPT
已更新 Relative Strength Volatility Variable Bands [DW]
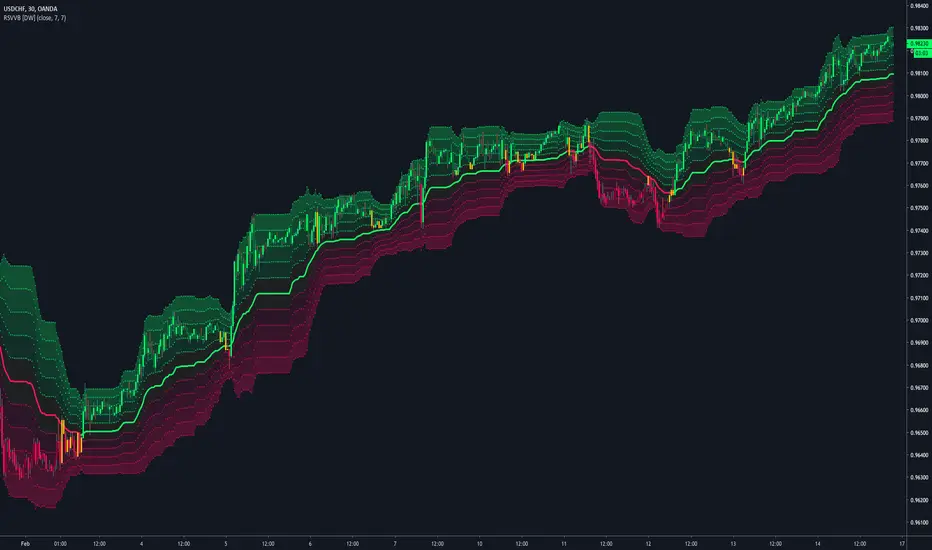
This is an experimental adaptive trend following study inspired by Giorgos Siligardos's Reverse Engineering RSI and Tushar S. Chande's Variable Moving Average.
In this study, reverse engineered RSI levels are calculated and used to generate a volatility index for VMA calculation.
First, price levels are calculated for when RSI will equal 70 and 30. The difference between the levels is taken and normalized to create the volatility index.
Next, an initial VMA is calculated using the created volatility index. The moving average is an exponential calculation that adjusts the sampling length as volatility changes.
Then, upper and lower VMAs are calculated by taking a VMA of prices above and below the initial VMA. The midline is produced by taking the median of the upper and lower VMAs.
Lastly, the band levels are calculated by multiplying the distance from the midline to the upper and lower VMAs by 1, 2, 3, 4, and 5.
Bar colors are included. They're based on the midline trend and price action relative to the upper and lower VMAs.
發行說明
Updates:-> Migrated to v4.
-> Stability Fix: Added correction for NaN values to stabilize initial states.
-> Reorganized script structure
-> Updated style theme.
開源腳本
秉持TradingView一貫精神,這個腳本的創作者將其設為開源,以便交易者檢視並驗證其功能。向作者致敬!您可以免費使用此腳本,但請注意,重新發佈代碼需遵守我們的社群規範。
For my full list of premium tools, check the blog:
wallanalytics.com/
Reach out on Telegram:
t.me/DonovanWall
wallanalytics.com/
Reach out on Telegram:
t.me/DonovanWall
免責聲明
這些資訊和出版物並非旨在提供,也不構成TradingView提供或認可的任何形式的財務、投資、交易或其他類型的建議或推薦。請閱讀使用條款以了解更多資訊。