INVITE-ONLY SCRIPT
Quintalytics Trend Sentry 19
INDICATOR DESCRIPTION
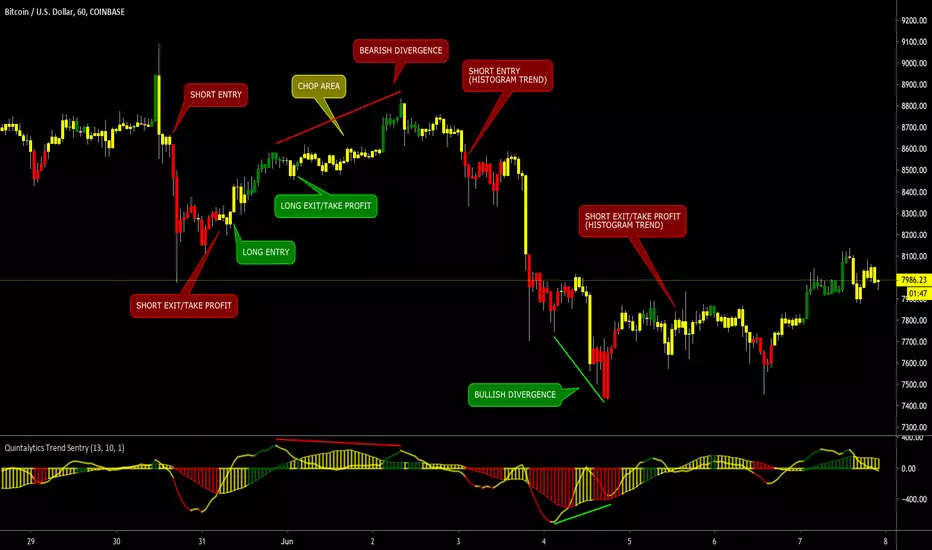
Quintalytics Trend Sentry is a combination of a Trend direction, Momentum, Sideways/Chop Detection, Trade position setup and Trade position exit indicator. This indicator is suitable for use in all timeframes, chart types (Bar, Renko, Range, etc.) and markets.
Trend Sentry is presented on the chart as a Histogram (values above and below ZERO) along with a signal Trigger line.

TREND DIRECTION and MOMENTUM
The combination of the color and location of the Histogram and Trigger line can provide information on the direction and strength of the trend.
The Color GREEN indicates the presence of a Bullish Momentum.
The Color RED indicates the presence of a Bearish Momentum.
The Color YELLOW indicates that the market is Choppy. Extended periods of YELLOW are typical for a market that has no established trend in the current chart timeframe.
A Histogram ABOVE the ZERO LINE indicates a Bullish Trend.
A Histogram BELOW the ZERO LINE indicates a Bearish Trend.
TRADE POSITION SETUPS
The position of the signal Trigger line in relation to the Histogram can be used as criteria for trade entry, exit, or take profit conditions. These should not be used as the sole method of trading, but rather in conjunction with other indicators and trading strategies, as well as Trailing Stop Loss indicators such as the Quintalytics “Trend, Stop, and Chop”
FOR LONG TRADE POSITION ENTRY CRITERIA OPTIONS:
• A Trigger line Crossing UPWARDS across the ZERO LINE from BELOW
• A TRIGGER LINE Crossing UPWARDS from INSIDE to ABOVE the Histogram
• A Trigger line FALLING, Bouncing off of the ZERO LINE, and then RISING
• A Histogram Crossing UPWARDS across the ZERO LINE from BELOW
FOR SHORT TRADE POSITION ENTRY CRITERIA OPTIONS:
• A Trigger line Crossing DOWNWARDS across the ZERO LINE
• A TRIGGER LINE Crossing DOWNWARDS from INSIDE to BELOW the Histogram
• A Trigger line RISING, Bouncing off of the ZERO LINE, and then FALLING
• A Histogram Crossing DOWNWARDS across the ZERO LINE from ABOVE
FOR LONG TRADE POSITION EXIT/TAKE PROFIT CRITERIA OPTIONS:
• A TRIGGER LINE Crossing DOWNWARDS from ABOVE to INSIDE the Histogram
• A previously RISING Histogram is now FALLING
• The distance between the Histogram line and Trigger line is decreasing
FOR SHORT TRADE POSITION EXIT/TAKE PROFIT CRITERIA OPTIONS:
• A TRIGGER LINE Crossing UPWARDS from BELOW to INSIDE the Histogram
• A previously FALLING Histogram is now RISING
• The distance between the Histogram line and Trigger line is decreasing
SETTINGS
The indicator has FOUR parameters: “Lookback” (# of bars), “Trigger Line Smooth”, “Chop Detect Strength”, and “Color Bar?”. Changing these settings individually or in combination will yield varying results.
Adjusting the “Lookback” will affect the overall level of TREND detection. The larger this number, the longer the timeframe to determine the TREND direction will be used.
Adjusting the “Trigger Smoothing” with smooth the trigger line, but will also slow its reaction time to changes in the market price.
Adjusting “Chop Detect Strength” will control the level of CHOP and SIDEWAYS market detection.
You have the option of COLORING the BAR to match the Current Trend Sentry color.
Quintalytics Trend Sentry is a combination of a Trend direction, Momentum, Sideways/Chop Detection, Trade position setup and Trade position exit indicator. This indicator is suitable for use in all timeframes, chart types (Bar, Renko, Range, etc.) and markets.
Trend Sentry is presented on the chart as a Histogram (values above and below ZERO) along with a signal Trigger line.
TREND DIRECTION and MOMENTUM
The combination of the color and location of the Histogram and Trigger line can provide information on the direction and strength of the trend.
The Color GREEN indicates the presence of a Bullish Momentum.
The Color RED indicates the presence of a Bearish Momentum.
The Color YELLOW indicates that the market is Choppy. Extended periods of YELLOW are typical for a market that has no established trend in the current chart timeframe.
A Histogram ABOVE the ZERO LINE indicates a Bullish Trend.
A Histogram BELOW the ZERO LINE indicates a Bearish Trend.
TRADE POSITION SETUPS
The position of the signal Trigger line in relation to the Histogram can be used as criteria for trade entry, exit, or take profit conditions. These should not be used as the sole method of trading, but rather in conjunction with other indicators and trading strategies, as well as Trailing Stop Loss indicators such as the Quintalytics “Trend, Stop, and Chop”
FOR LONG TRADE POSITION ENTRY CRITERIA OPTIONS:
• A Trigger line Crossing UPWARDS across the ZERO LINE from BELOW
• A TRIGGER LINE Crossing UPWARDS from INSIDE to ABOVE the Histogram
• A Trigger line FALLING, Bouncing off of the ZERO LINE, and then RISING
• A Histogram Crossing UPWARDS across the ZERO LINE from BELOW
FOR SHORT TRADE POSITION ENTRY CRITERIA OPTIONS:
• A Trigger line Crossing DOWNWARDS across the ZERO LINE
• A TRIGGER LINE Crossing DOWNWARDS from INSIDE to BELOW the Histogram
• A Trigger line RISING, Bouncing off of the ZERO LINE, and then FALLING
• A Histogram Crossing DOWNWARDS across the ZERO LINE from ABOVE
FOR LONG TRADE POSITION EXIT/TAKE PROFIT CRITERIA OPTIONS:
• A TRIGGER LINE Crossing DOWNWARDS from ABOVE to INSIDE the Histogram
• A previously RISING Histogram is now FALLING
• The distance between the Histogram line and Trigger line is decreasing
FOR SHORT TRADE POSITION EXIT/TAKE PROFIT CRITERIA OPTIONS:
• A TRIGGER LINE Crossing UPWARDS from BELOW to INSIDE the Histogram
• A previously FALLING Histogram is now RISING
• The distance between the Histogram line and Trigger line is decreasing
SETTINGS
The indicator has FOUR parameters: “Lookback” (# of bars), “Trigger Line Smooth”, “Chop Detect Strength”, and “Color Bar?”. Changing these settings individually or in combination will yield varying results.
Adjusting the “Lookback” will affect the overall level of TREND detection. The larger this number, the longer the timeframe to determine the TREND direction will be used.
Adjusting the “Trigger Smoothing” with smooth the trigger line, but will also slow its reaction time to changes in the market price.
Adjusting “Chop Detect Strength” will control the level of CHOP and SIDEWAYS market detection.
You have the option of COLORING the BAR to match the Current Trend Sentry color.
僅限邀請腳本
僅限作者授權的用戶訪問此腳本,並且通常需要付費。您可以將其增加到收藏腳本中,但是只有在向作者請求並獲得許可之後,才能使用它。 請聯繫quintalytics以了解更多信息,或按照下面作者的說明進行操作。
TradingView 不建議購買並使用此腳本,除非您 100% 信任其作者並了解腳本的工作原理。在許多情況下,您可以在我們的社群腳本中免費找到良好的開源替代方案。
作者的說明
″
想在圖表上使用此腳本?
警告:請閱讀,然後再請求訪問權限。
免責聲明
這些資訊和出版物並不意味著也不構成TradingView提供或認可的金融、投資、交易或其他類型的意見或建議。請在使用條款閱讀更多資訊。