INVITE-ONLY SCRIPT
AIMS Purple Magic
The Alligator is a Very Powerful Indicator
Some people think it's just 3 moving averages. But in reality, it is far more than that.
Read more about Alligator and Bill Williams
The Purple Magic Line has been derived from Bill Williams Alligator. Together the Alligator we call the AIMS Gator.
It is a smooth moving average based on the Chaos Red Line of the 5 times higher time frame.
Our Mantra: If you trade in line with the trend of the 5 times higher time frame, you will have a higher chance of catching breakouts in the direction of the trend.
So we have this rule, Always Trade when Price is Going Away from The Purple Line. Simple as that.
Buy Only: Price above the Purple Line
Sell Only: Price below the Purple Line.
What is The Alligator?
The Alligator Indicator was developed by Bill Williams and combines moving averages with fractal geometry.
The indicator helps traders to identify if the market is trending.
Each has different lookback periods and offsets that can be set by the user.
The alligator is easy to use and can find trade setups, based on how close together or how far apart the lines are, resembling an alligator opening and closing his mouth. This indicator can be used in combination with other analysis techniques.
Based on calculations of Non-Linear mathematical formula we have arrived at a way to calculate the Trend of the 5 times higher time frame
The Purple Magic Indicates :
The Trend of Current and 5 times higher time frame
It helps prevent trading into Wave 4
It helps with counting Wave 3 and 4
You can use it to time early entry into Wave 5
The bounce of Purple after a wave 3 is often a 50% fib retracement.
Examples:
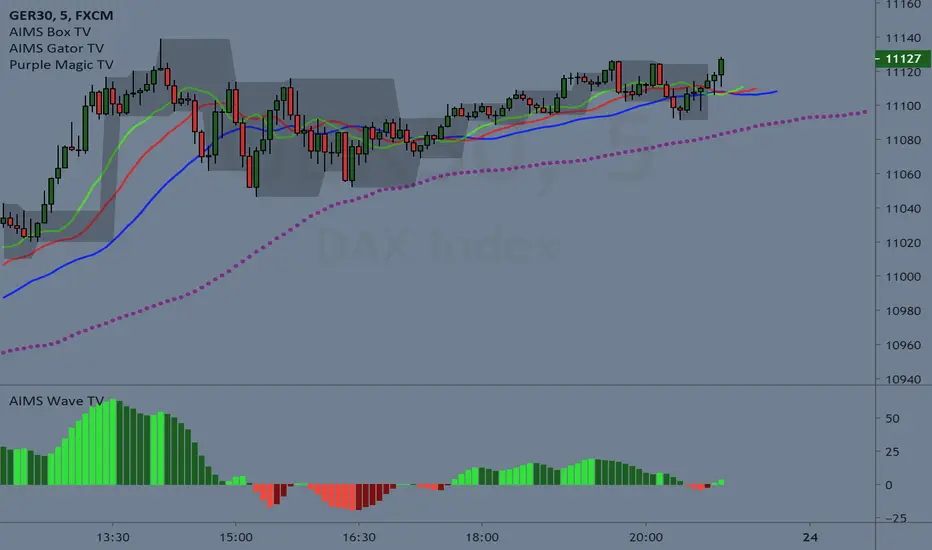
In the picture below you see an M5 chart and M1 chart.
On the left side, you see Alligator Red Line on the 5-minute chart
on the right side, you see The Purple Magic line. Which depicts the same price regions.
This is the Sweet Spot where we take trades.

In line with The Awesome oscillator if you time your entries based on a pullback towards the purple, it can be a system on its own. Nothing else required. But we have a better method.
When we put together, AIMS The Box, AIMS The Gator, and AIMS The Wave indicators, things work even smoother.
For more information visit the link below.
Some people think it's just 3 moving averages. But in reality, it is far more than that.
Read more about Alligator and Bill Williams
The Purple Magic Line has been derived from Bill Williams Alligator. Together the Alligator we call the AIMS Gator.
It is a smooth moving average based on the Chaos Red Line of the 5 times higher time frame.
Our Mantra: If you trade in line with the trend of the 5 times higher time frame, you will have a higher chance of catching breakouts in the direction of the trend.
So we have this rule, Always Trade when Price is Going Away from The Purple Line. Simple as that.
Buy Only: Price above the Purple Line
Sell Only: Price below the Purple Line.
What is The Alligator?
The Alligator Indicator was developed by Bill Williams and combines moving averages with fractal geometry.
The indicator helps traders to identify if the market is trending.
- It consists of 3 lines: the blue line (aka the Alligator's Jaw),
- the red Line (aka the Alligator's Teeth) and
- the green Line (aka the Alligator's Lips).
Each has different lookback periods and offsets that can be set by the user.
The alligator is easy to use and can find trade setups, based on how close together or how far apart the lines are, resembling an alligator opening and closing his mouth. This indicator can be used in combination with other analysis techniques.
Based on calculations of Non-Linear mathematical formula we have arrived at a way to calculate the Trend of the 5 times higher time frame
The Purple Magic Indicates :
The Trend of Current and 5 times higher time frame
It helps prevent trading into Wave 4
It helps with counting Wave 3 and 4
You can use it to time early entry into Wave 5
The bounce of Purple after a wave 3 is often a 50% fib retracement.
Examples:
In the picture below you see an M5 chart and M1 chart.
On the left side, you see Alligator Red Line on the 5-minute chart
on the right side, you see The Purple Magic line. Which depicts the same price regions.
This is the Sweet Spot where we take trades.
In line with The Awesome oscillator if you time your entries based on a pullback towards the purple, it can be a system on its own. Nothing else required. But we have a better method.
When we put together, AIMS The Box, AIMS The Gator, and AIMS The Wave indicators, things work even smoother.
For more information visit the link below.
僅限邀請腳本
僅限作者授權的用戶訪問此腳本,並且通常需要付費。您可以將其增加到收藏腳本中,但是只有在向作者請求並獲得許可之後,才能使用它。 請聯繫iTradeAIMS以了解更多信息,或按照下面作者的說明進行操作。
請注意,這是一個私有的、僅限邀請的腳本,腳本版主並未對其進行分析。因此,其是否符合網站規則尚未確定。 TradingView建議您不要購買並使用腳本,除非您完全信任其作者並理解腳本的工作原理。在許多情況下,您可以在我們的社群腳本中找到免費的優秀開源替代方案。
想在圖表上使用此腳本?
警告:請閱讀,然後再請求訪問權限。
免責聲明
這些資訊和出版物並不意味著也不構成TradingView提供或認可的金融、投資、交易或其他類型的意見或建議。請在使用條款閱讀更多資訊。