OPEN-SOURCE SCRIPT
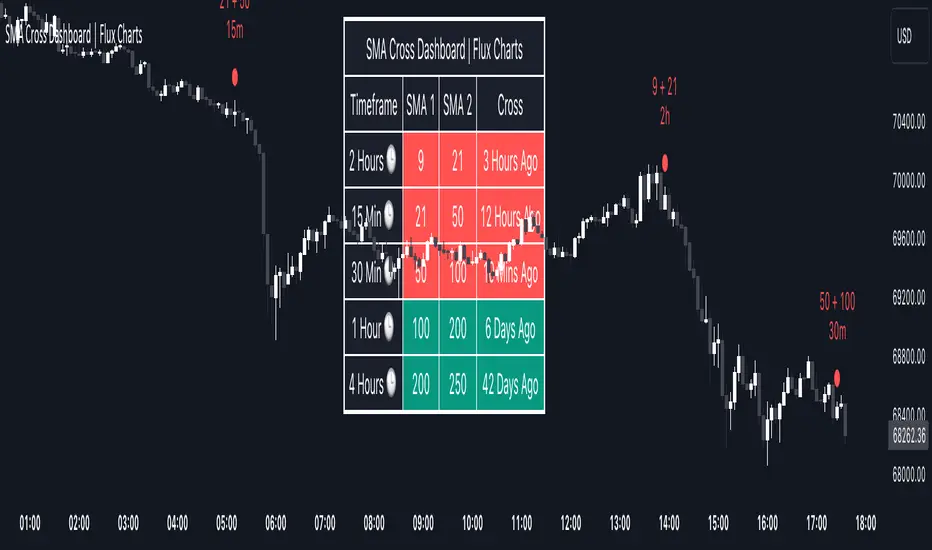
SMA Cross Dashboard | Flux Charts
💎 GENERAL OVERVIEW
Introducing our new Simple Moving Average (SMA) Cross Dashboard! This dashboard let's you select a source for the calculation of the SMA of it, then let's you enter 2 lengths for up to 5 timeframes, plotting their crosses in the chart.

Features of the new SMA Cross Dashboard :
📌 HOW DOES IT WORK ?
SMA is a widely used indicator within trading community, it simply works by taking the mathematical average of a source by desired length. Crosses of SMA lines can be helpful to determine strong bullish & bearish movements of an asset. This indicator shows finds crosses across 5 different timeframes in a dashboard and plots them in your chart for ease of use.

🚩UNIQUENESS
This dashboard cuts through the hassle of manual SMA cross calculations and plotting. It offers flexibility by allowing various data sources (even custom indicators) and customization through enabling / disabling individual timeframes. The clear visualization lets you see SMA crosses efficiently.
⚙️SETTINGS
1. Timeframes
You can set up to 5 timeframes & 2 lenghts to detect crosses for each timeframe here. You can also enable / disable them.
2. General Configuration
SMA Source -> You can select the source for the calculation of the SMA here. You can select sources from other indicators as well as more general sources like close, high and low price.
Introducing our new Simple Moving Average (SMA) Cross Dashboard! This dashboard let's you select a source for the calculation of the SMA of it, then let's you enter 2 lengths for up to 5 timeframes, plotting their crosses in the chart.
Features of the new SMA Cross Dashboard :
- Shows SMA Crosses Across Up To 5 Different Timeframes.
- Select Any Source, Including Other Indicators.
- Customizable Dashboard.
📌 HOW DOES IT WORK ?
SMA is a widely used indicator within trading community, it simply works by taking the mathematical average of a source by desired length. Crosses of SMA lines can be helpful to determine strong bullish & bearish movements of an asset. This indicator shows finds crosses across 5 different timeframes in a dashboard and plots them in your chart for ease of use.
🚩UNIQUENESS
This dashboard cuts through the hassle of manual SMA cross calculations and plotting. It offers flexibility by allowing various data sources (even custom indicators) and customization through enabling / disabling individual timeframes. The clear visualization lets you see SMA crosses efficiently.
⚙️SETTINGS
1. Timeframes
You can set up to 5 timeframes & 2 lenghts to detect crosses for each timeframe here. You can also enable / disable them.
2. General Configuration
SMA Source -> You can select the source for the calculation of the SMA here. You can select sources from other indicators as well as more general sources like close, high and low price.
開源腳本
本著TradingView的真正精神,此腳本的創建者將其開源,以便交易者可以查看和驗證其功能。向作者致敬!雖然您可以免費使用它,但請記住,重新發佈程式碼必須遵守我們的網站規則。
Access Flux Charts' exclusive indicators: fluxcharts.com/
Join our Discord community: discord.gg/FluxCharts
Join our Discord community: discord.gg/FluxCharts
免責聲明
這些資訊和出版物並不意味著也不構成TradingView提供或認可的金融、投資、交易或其他類型的意見或建議。請在使用條款閱讀更多資訊。