OPEN-SOURCE SCRIPT
Indicator Visualizer V1.0
This is a script so that you can visualize crossover/under indicators on the chart as zones/boxes or as lines.
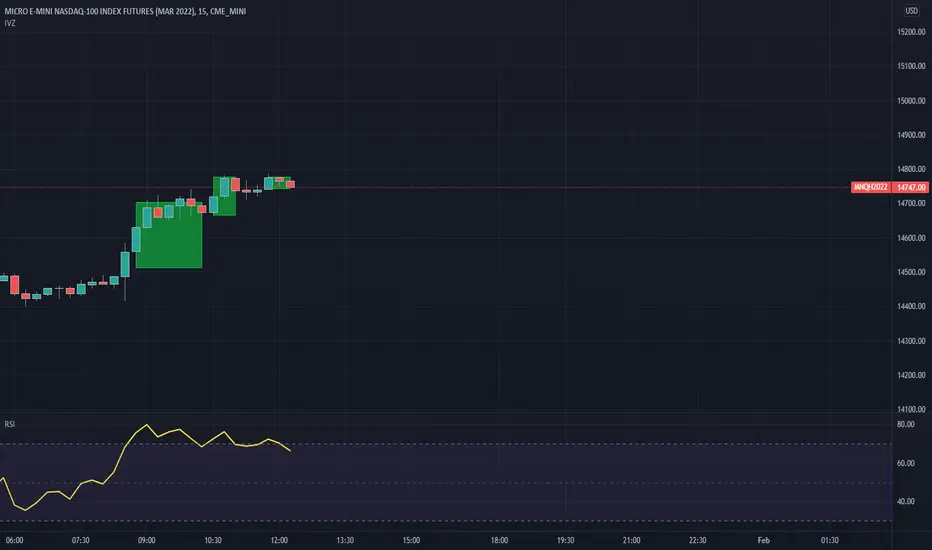
By default the source is "Close". When the source is Close and the default RSI is checked, then the indicator will visualize crossover and under from a 14 period RSI as shown in the published chart.
How this indicator works:
Add the indicator you want to visualize to the chart, and this indicator.
Open this indicator and set the source to the indicator you want to visualize, then set the levels you want to visualize the crossovers for.
Using the default as an example [RSI 14-Crossover-70]
When the RSI crosses above level 1 (default 70) then it will begin plotting a "Cross Over" box.
Each bar that the RSI remains above level 1 it will adjust the top of the box and the right side of the box.
When RSI crosses back below level 1 then the box will stop adjusting and end on that bar.
Using the default as an example [RSI 14-Crossunder-30]
When the RSI crosses below level 2 (default 30) then it will begin plotting a "Cross Under" box.
Each bar that the RSI remains below level 2 it will adjust the bottom of the box and the right side of the box.
When RSI crosses back above level 2 then the box will stop adjusting and end on that bar.
If you want to use lines they will be drawn from the close of the starting bar to the close of the current/end bar.
You are able to set an extension for the lines if you would like them to extend a specific amount past the close bar. (I.E. 1,2,or 3 bars)
If you wish to use the source as close, then you must uncheck the Default RSI box.
開源腳本
秉持TradingView一貫精神,這個腳本的創作者將其設為開源,以便交易者檢視並驗證其功能。向作者致敬!您可以免費使用此腳本,但請注意,重新發佈代碼需遵守我們的社群規範。
免責聲明
這些資訊和出版物並非旨在提供,也不構成TradingView提供或認可的任何形式的財務、投資、交易或其他類型的建議或推薦。請閱讀使用條款以了解更多資訊。
免責聲明
這些資訊和出版物並非旨在提供,也不構成TradingView提供或認可的任何形式的財務、投資、交易或其他類型的建議或推薦。請閱讀使用條款以了解更多資訊。