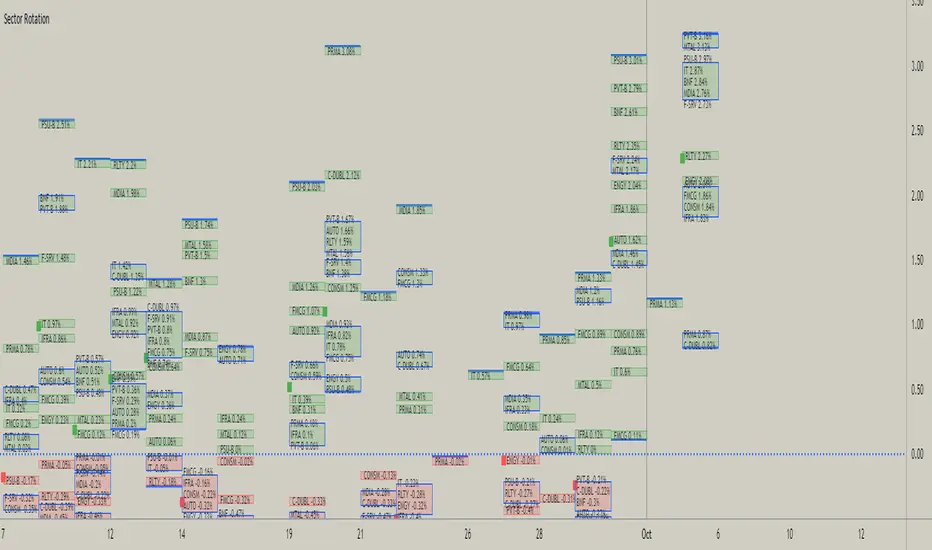
This script is attempt to create and observe the real-time and historical performance of the all major sectors of Indian Market in one screen.
for Data Presentation I used Short sector names so that I can manage to get space and efficient presentable data.
Short Names and Actual Sector Names

In this Update following features are added
for Data Presentation I used Short sector names so that I can manage to get space and efficient presentable data.
Short Names and Actual Sector Names
- BNF : CNX-BANKNIFTY
- IT : CNX-IT
- PRMA : CNX - PHARMA
- FMCG : CNX-FMCG
- AUTO : CNX-AUTO
- MTAL : CNX-METAL
- MDIA : CNX-MEDIA
- RLTY : CNX-REALTY
- IFRA : CNX-INFRA
- ENGY : CNX-ENERGY
- PSU-B : CNX-PSU-BANK
- PVT-B : NIFTY-PVT-BANK
- F-SRV : CNX-FINANCE
- CONSM : CNX-CONSUMPTION
- C-DUBL : NIFTY_CONSR_DURBL
- You can use this script in 30-min, Daily, Weekly and Monthly Time Frames.
- The green Square denotes the current Symbol Performance.
- The Blue Border boxes are created when one sector intersects other sector.
In this Update following features are added
- Now users have control over sectors, what are all the sectors you wanted to plot you can select from the input menu.
- Currently user can highlight any one sector in different border color so that user can easily spot and track particular sector.
- This thicker blue line denotes lowest and highest point of the current timeframe.
開源腳本
秉持TradingView一貫精神,這個腳本的創作者將其設為開源,以便交易者檢視並驗證其功能。向作者致敬!您可以免費使用此腳本,但請注意,重新發佈代碼需遵守我們的社群規範。
免責聲明
這些資訊和出版物並非旨在提供,也不構成TradingView提供或認可的任何形式的財務、投資、交易或其他類型的建議或推薦。請閱讀使用條款以了解更多資訊。
開源腳本
秉持TradingView一貫精神,這個腳本的創作者將其設為開源,以便交易者檢視並驗證其功能。向作者致敬!您可以免費使用此腳本,但請注意,重新發佈代碼需遵守我們的社群規範。
免責聲明
這些資訊和出版物並非旨在提供,也不構成TradingView提供或認可的任何形式的財務、投資、交易或其他類型的建議或推薦。請閱讀使用條款以了解更多資訊。