OPEN-SOURCE SCRIPT
已更新 US30 Q4_trade _levels_Jan2025
updated description and use
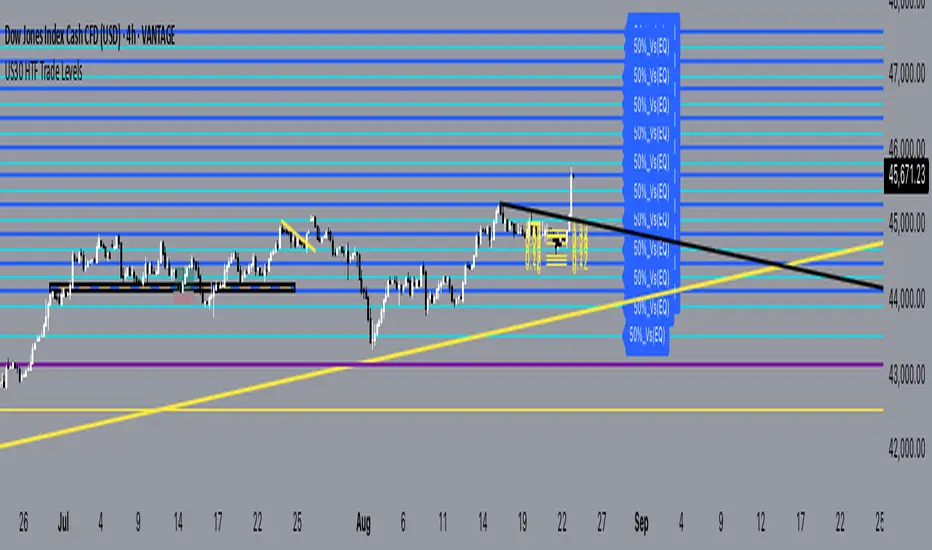
US30 Trade Levels.plus 50% take profit levels
this indicator is based on the US30 quarterly theory level strategy
the difference here is that the zones have been zoom'd out for the H2 view for oversight and M30 as application theory to the Q4 levels.
The Q4 levels are spaced and calculated 385 pips apart, and also span within the daily ADR range for US30.
so these are zones that has proven to be valid going back as far as Nov2022
these are pass through levels, to together with other confluences like order blocks and or breaker blocks, will give you a guideline as to expect a valid zone of interest.
USE this indicator in conjunction with an SMC point of view to identify OB & CHOCH
發行說明
Heya, 1. labels off-set fixed,
2. levels will auto calculate even for new highs
Please eave a comment, i appreciate any and all feedback
Enjoy, Happy US30 trades
開源腳本
In true TradingView spirit, the creator of this script has made it open-source, so that traders can review and verify its functionality. Kudos to the author! While you can use it for free, remember that republishing the code is subject to our House Rules.
免責聲明
The information and publications are not meant to be, and do not constitute, financial, investment, trading, or other types of advice or recommendations supplied or endorsed by TradingView. Read more in the Terms of Use.