OPEN-SOURCE SCRIPT
ATR Bands
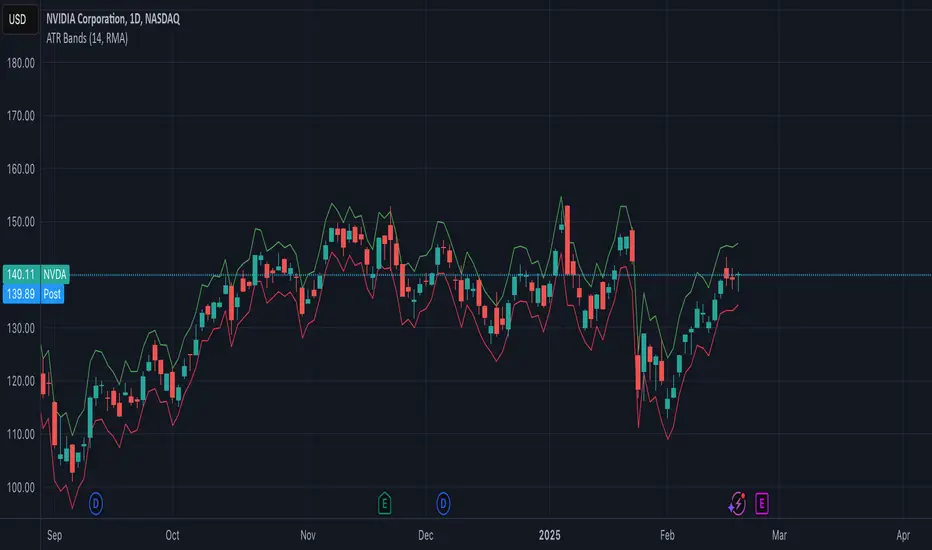
The ATR Bands indicator is a volatility-based tool that plots dynamic support and resistance levels around the price using the Average True Range (ATR). It consists of two bands:
Upper Band: Calculated as current price + ATR, representing an upper volatility threshold.
Lower Band: Calculated as current price - ATR, serving as a lower volatility threshold.
Key Features:
✅ Measures Volatility: Expands and contracts based on market volatility.
✅ Dynamic Support & Resistance: Helps identify potential breakout or reversal zones.
✅ Customizable Smoothing: Supports multiple moving average methods (RMA, SMA, EMA, WMA) for ATR calculation.
How to Use:
Trend Confirmation: If the price consistently touches or exceeds the upper band, it may indicate strong bullish momentum.
Reversal Signals: A price approaching the lower band may suggest a potential reversal or increased selling pressure.
Volatility Assessment: Wide bands indicate high volatility, while narrow bands suggest consolidation.
This indicator is useful for traders looking to incorporate volatility-based strategies into their trading decisions
開源腳本
秉持TradingView一貫精神,這個腳本的創作者將其設為開源,以便交易者檢視並驗證其功能。向作者致敬!您可以免費使用此腳本,但請注意,重新發佈代碼需遵守我們的社群規範。
免責聲明
這些資訊和出版物並非旨在提供,也不構成TradingView提供或認可的任何形式的財務、投資、交易或其他類型的建議或推薦。請閱讀使用條款以了解更多資訊。
開源腳本
秉持TradingView一貫精神,這個腳本的創作者將其設為開源,以便交易者檢視並驗證其功能。向作者致敬!您可以免費使用此腳本,但請注意,重新發佈代碼需遵守我們的社群規範。
免責聲明
這些資訊和出版物並非旨在提供,也不構成TradingView提供或認可的任何形式的財務、投資、交易或其他類型的建議或推薦。請閱讀使用條款以了解更多資訊。