OPEN-SOURCE SCRIPT
ANIL's OHCL, VWAP and EMA Cross
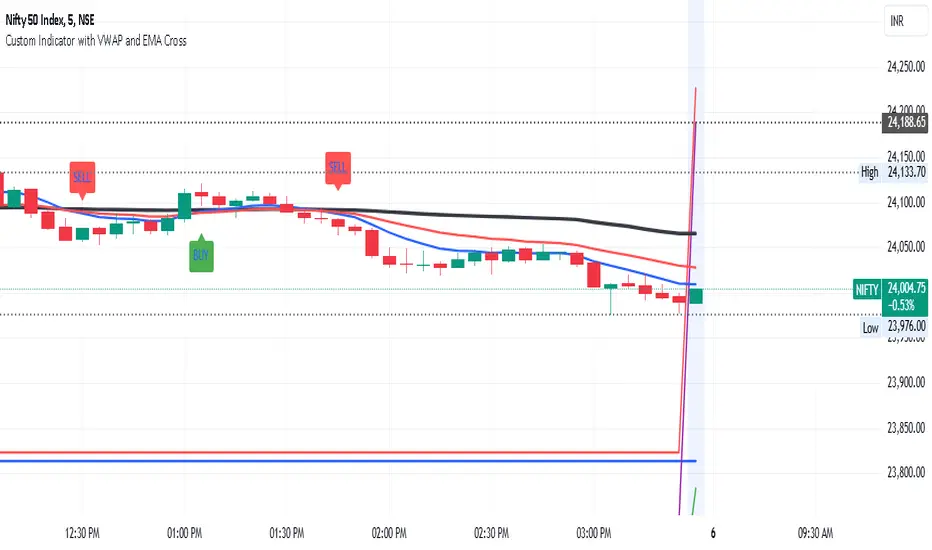
Previous Week High and Low:
This part calculates the previous week's high and low values and plots them as continuous blue lines. The plot.style_line ensures the lines are drawn continuously.
Previous Day Open, High, Low, Close:
The script uses request.security to get the previous day's open, high, low, and close values. These are plotted as continuous lines in different colors:
Open: Green
High: Red
Low: Orange
Close: Purple
VWAP (Volume Weighted Average Price):
The VWAP is calculated using ta.vwap(close) and plotted with a thick black line.
Exponential Moving Averages (EMAs):
The script calculates two EMAs: one with a 9-period (fast) and one with a 21-period (slow).
The EMAs are plotted as continuous lines:
Fast EMA: Blue
Slow EMA: Red
EMA Cross:
The script checks for EMA crossovers and crossunders:
A crossover (fast EMA crossing above slow EMA) triggers a buy signal (green label below the bar).
A crossunder (fast EMA crossing below slow EMA) triggers a sell signal (red label above the bar).
Customization:
You can adjust the fastLength and slowLength variables to change the period of the EMAs.
You can modify the line colors and line thickness to match your preferred style.
The buy and sell signals can be customized further with different shapes or additional conditions for signal generation.
This script provides a comprehensive and visually distinct indicator with the previous week's and day's levels, VWAP, and EMA crossover signals.
開源腳本
本著TradingView的真正精神,此腳本的創建者將其開源,以便交易者可以查看和驗證其功能。向作者致敬!雖然您可以免費使用它,但請記住,重新發佈程式碼必須遵守我們的網站規則。
免責聲明
這些資訊和出版物並不意味著也不構成TradingView提供或認可的金融、投資、交易或其他類型的意見或建議。請在使用條款閱讀更多資訊。
開源腳本
本著TradingView的真正精神,此腳本的創建者將其開源,以便交易者可以查看和驗證其功能。向作者致敬!雖然您可以免費使用它,但請記住,重新發佈程式碼必須遵守我們的網站規則。
免責聲明
這些資訊和出版物並不意味著也不構成TradingView提供或認可的金融、投資、交易或其他類型的意見或建議。請在使用條款閱讀更多資訊。