OPEN-SOURCE SCRIPT
Horizontal EMA
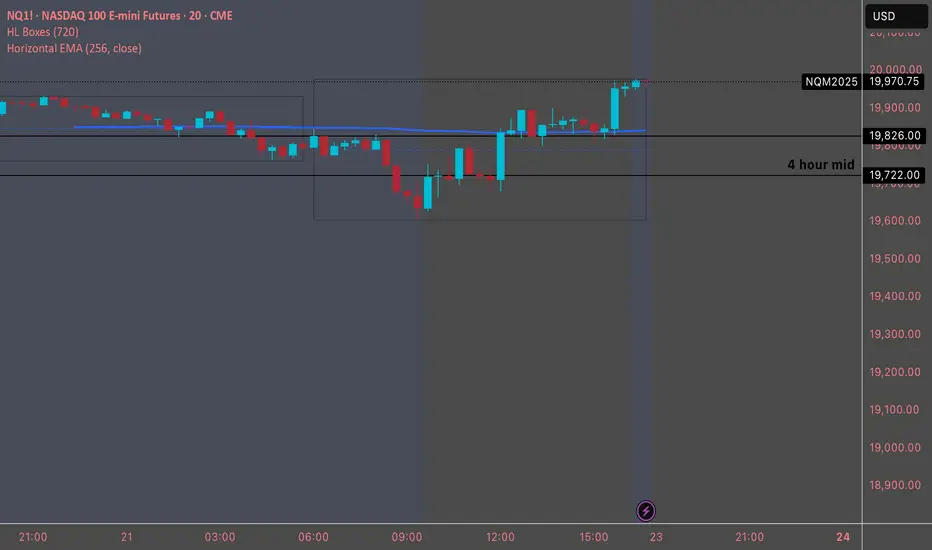
Designed to plot a horizontal Exponential Moving Average (EMA) line on a TradingView chart. The script allows users to specify the period and source for the EMA calculation. The line remains fixed at the calculated EMA value, providing a visual reference for the trend over the specified period. The script uses version 5 of Pine Script and draws a blue horizontal line at the EMA value on the chart, updating as new data is available.
開源腳本
秉持TradingView一貫精神,這個腳本的創作者將其設為開源,以便交易者檢視並驗證其功能。向作者致敬!您可以免費使用此腳本,但請注意,重新發佈代碼需遵守我們的社群規範。
免責聲明
這些資訊和出版物並非旨在提供,也不構成TradingView提供或認可的任何形式的財務、投資、交易或其他類型的建議或推薦。請閱讀使用條款以了解更多資訊。
免責聲明
這些資訊和出版物並非旨在提供,也不構成TradingView提供或認可的任何形式的財務、投資、交易或其他類型的建議或推薦。請閱讀使用條款以了解更多資訊。