OPEN-SOURCE SCRIPT
已更新 Normal Distribution Asymmetry & Volatility Zones
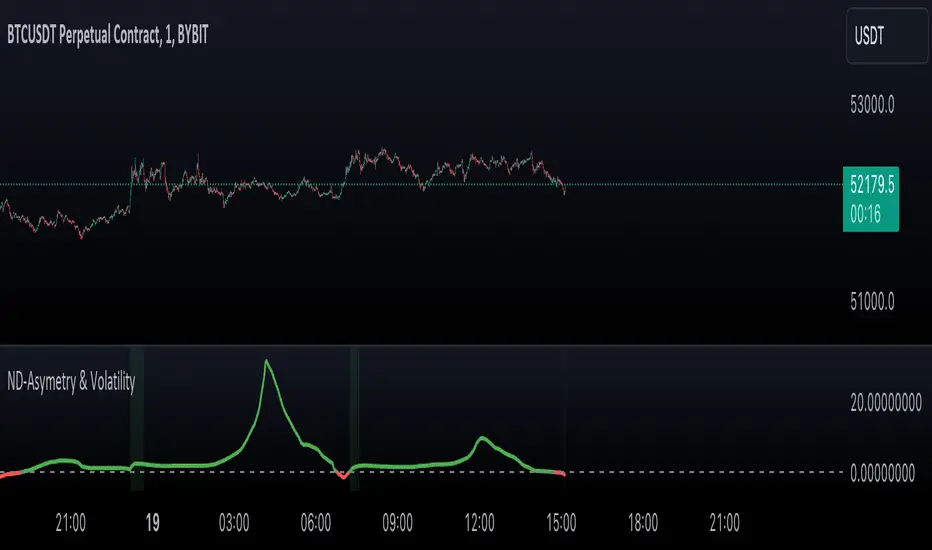
Normal Distribution Asymmetry & Volatility Zones Indicator provides insights into the skewness of a price distribution and identifies potential volatility zones in the market. The indicator calculates the skewness coefficient, indicating the asymmetry of the price distribution, and combines it with a measure of volatility to define buy and sell zones.
By combining skewness analysis and volatility thresholds, this indicator offers traders a unique perspective on potential market movements, helping them make informed trading decisions. Please note that trading involves risks, and this indicator should be used in conjunction with other analysis and risk management techniques.
- The key features of this indicator include:
- Skewness Calculation: It calculates the skewness coefficient, a statistical measure that reveals whether the price distribution is skewed to the left (negative skewness) or right (positive skewness).
- Volatility Zones: Based on the skewness and a user-defined volatility threshold, the indicator identifies buy and sell zones where potential price movements may occur. Buy zones are marked when skewness is negative and prices are below a volatility threshold. Sell zones are marked when skewness is positive and prices are above the threshold.
- Signal Source Selection: Traders can select the source of price data for analysis, allowing flexibility in their trading strategy.
- Customizable Parameters: Users can adjust the length of the distribution, the volatility threshold, and other parameters to tailor the indicator to their specific trading preferences and market conditions.
- Visual Signals: Buy and sell zones are visually displayed on the chart, making it easy to identify potential trade opportunities.
- Background Color: The indicator changes the background color of the chart to highlight significant zones, providing a clear visual cue for traders.
By combining skewness analysis and volatility thresholds, this indicator offers traders a unique perspective on potential market movements, helping them make informed trading decisions. Please note that trading involves risks, and this indicator should be used in conjunction with other analysis and risk management techniques.
發行說明
Modified the maximum value for the length to 500發行說明
Adjusted the maximum value of "Distribution Length" and implemented some minor code modifications.發行說明
Updated the color scheme to enhance the indicator's intuitiveness.發行說明
- Code refactor
- Added tooltips for input variables
發行說明
- Added an option to switch between raw and normalized skewness values through the 'Plot normalized' setting, offering users more flexibility in market analysis.
- Enhanced the skewness calculation by incorporating the normalization process, which compares the current skewness value to a moving average of recent skewness values.
- Introduced normalization length parameter allowing users to define the period for normalization, optimizing signal accuracy based on individual trading strategies.
- Incorporated an indicator description as comments within the code to provide better context and understanding
發行說明
- Moved "Normal Distribution Asymmetry & Volatility Zones Indicator" calculations to the "NormalDistributionFunctions" library for easier integration.
- Enabled easy integration of the "skewness" function for user scripts, enhancing custom analysis.
開源腳本
本著TradingView的真正精神,此腳本的創建者將其開源,以便交易者可以查看和驗證其功能。向作者致敬!雖然您可以免費使用它,但請記住,重新發佈程式碼必須遵守我們的網站規則。
免責聲明
這些資訊和出版物並不意味著也不構成TradingView提供或認可的金融、投資、交易或其他類型的意見或建議。請在使用條款閱讀更多資訊。
開源腳本
本著TradingView的真正精神,此腳本的創建者將其開源,以便交易者可以查看和驗證其功能。向作者致敬!雖然您可以免費使用它,但請記住,重新發佈程式碼必須遵守我們的網站規則。
免責聲明
這些資訊和出版物並不意味著也不構成TradingView提供或認可的金融、投資、交易或其他類型的意見或建議。請在使用條款閱讀更多資訊。