OPEN-SOURCE SCRIPT
Moving Average Bands [CC]
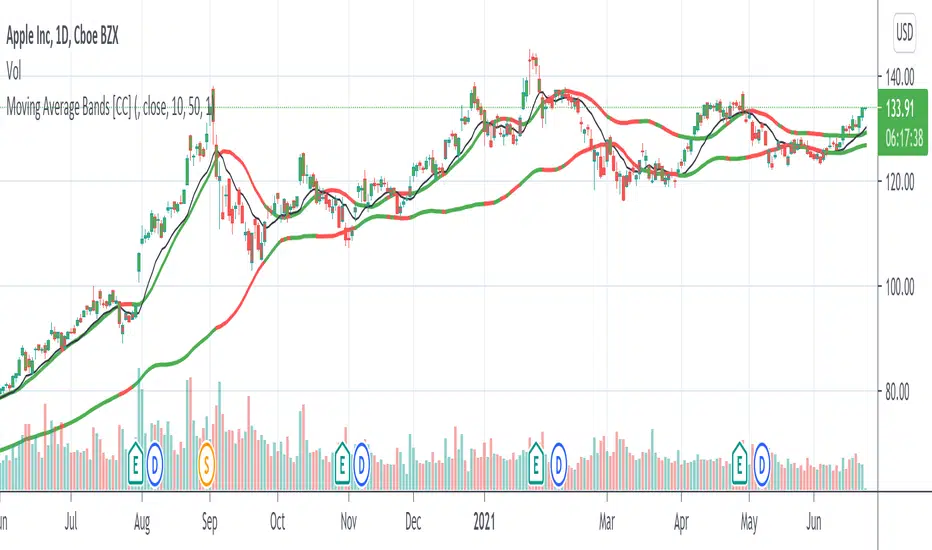
The Moving Average Bands were created by Vitali Apirine (Stocks and Commodities July 2021 pg 16) and this is a very handy trend following indicator that will give you the overall trend of the underlying stock. As the bands rise then the stock is in an uptrend and as they fall then it is a downtrend. If the bands stay flat then it is a sideways and/or choppy market. I did change the middle band from what he originally authored because I believe this gives more accurate buy and sell signals so keep that in mind. Feel free to use a different moving average than the original exponential moving average in the formula. As always buy when the indicator lines turn green and sell when they turn red.
Let me know if there are any other indicators you would like to see me publish!
Let me know if there are any other indicators you would like to see me publish!
開源腳本
秉持TradingView一貫精神,這個腳本的創作者將其設為開源,以便交易者檢視並驗證其功能。向作者致敬!您可以免費使用此腳本,但請注意,重新發佈代碼需遵守我們的社群規範。
免責聲明
這些資訊和出版物並非旨在提供,也不構成TradingView提供或認可的任何形式的財務、投資、交易或其他類型的建議或推薦。請閱讀使用條款以了解更多資訊。
開源腳本
秉持TradingView一貫精神,這個腳本的創作者將其設為開源,以便交易者檢視並驗證其功能。向作者致敬!您可以免費使用此腳本,但請注意,重新發佈代碼需遵守我們的社群規範。
免責聲明
這些資訊和出版物並非旨在提供,也不構成TradingView提供或認可的任何形式的財務、投資、交易或其他類型的建議或推薦。請閱讀使用條款以了解更多資訊。