OPEN-SOURCE SCRIPT
已更新 KJS-- Gost Pivot MA
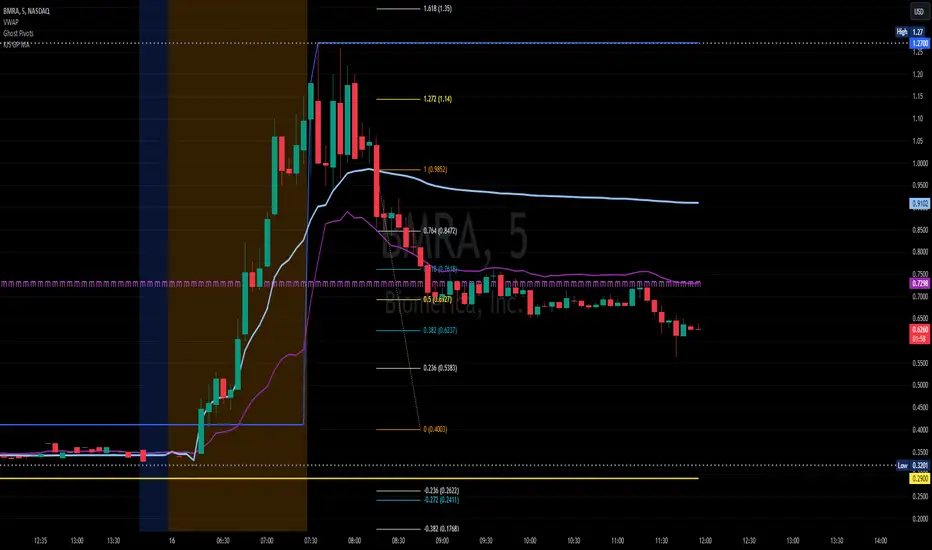
KJS Ghost Pivot Moving Average
This indicator calculates a "Ghost Pivot" by estimating where the monthly pivot level would be if the current candle's close represented the end of the month. The calculation uses:
• The current month's high and low from regular trading hours (RTH).
• The current candle's close, which includes both premarket and after-hours data.
It also smooths the ghost pivot using a customizable simple moving average (SMA).
Features:
• Plots the current month's high (blue) and low (yellow) based on RTH data.
• Calculates and plots a dynamic pivot (purple line) as the average of the monthly high, low, and current close (HLC3).
• Includes a customizable SMA length for smoother pivot tracking (default: 3).
This indicator helps traders anticipate potential monthly pivot levels in real-time while visualizing key support and resistance areas.
發行說明
KJS Ghost Pivot Moving AverageThis indicator calculates a “Ghost Pivot" by estimating where the monthly pivot level would be if the current candle’s close represented the end of the month. The calculation uses:
It also smooths the ghost pivot using a customizable simple moving average (SMA).
Features:
This indicator helps traders anticipate potential monthly pivot levels in real-time while visualizing key support and resistance areas.
發行說明
Update to Pine Script v6開源腳本
秉持TradingView一貫精神,這個腳本的創作者將其設為開源,以便交易者檢視並驗證其功能。向作者致敬!您可以免費使用此腳本,但請注意,重新發佈代碼需遵守我們的社群規範。
免責聲明
這些資訊和出版物並非旨在提供,也不構成TradingView提供或認可的任何形式的財務、投資、交易或其他類型的建議或推薦。請閱讀使用條款以了解更多資訊。
免責聲明
這些資訊和出版物並非旨在提供,也不構成TradingView提供或認可的任何形式的財務、投資、交易或其他類型的建議或推薦。請閱讀使用條款以了解更多資訊。