OPEN-SOURCE SCRIPT
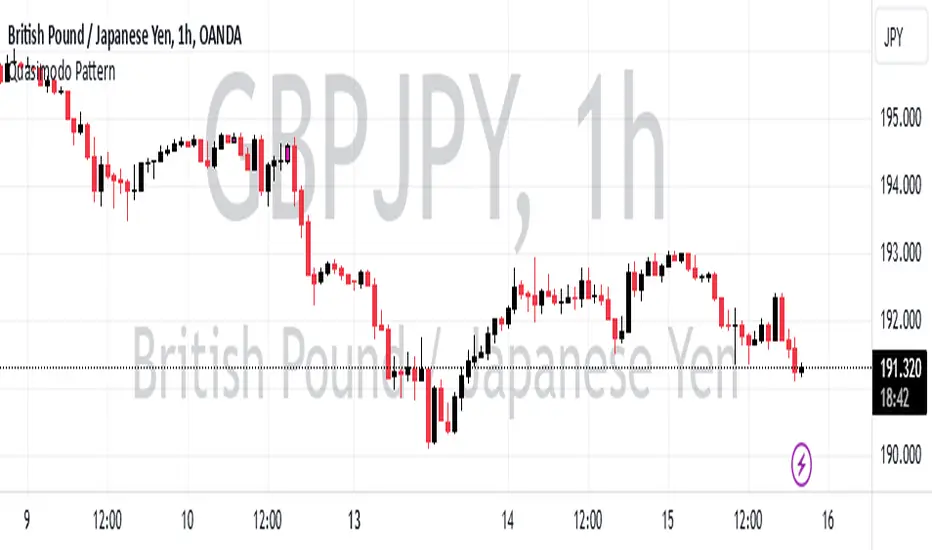
Quasimodo Pattern
What is a Quasimodo Pattern?
A Quasimodo Pattern is a chart pattern traders look for to predict possible price reversals in the market:
- Bullish Quasimodo: Signals a possible price increase (buying opportunity).
- Bearish Quasimodo: Signals a potential price decrease (selling opportunity).
How the Script Works
1. Bullish Quasimodo:
- Checks if the price pattern shows signs of a potential upward movement:
- The current low price is higher than a previous price point (suggesting fair value gap).
- The previous candle closed higher than it opened (bullish candle).
- The candle before that closed lower than it opened (bearish candle).
2. Bearish Quasimodo:
- Looks for signs of a downward movement:
- The current high price is lower than a previous price point (suggesting fair value gap).
- The previous candle closed lower than it opened (bearish candle).
- The candle before that closed higher than it opened (bullish candle).
Visual Indicators
- Yellow Candles: Indicate a bullish Quasimodo pattern.
- Pink Candles: Indicate a bearish Quasimodo pattern.
Alerts
If a Quasimodo pattern is detected, the script sends an alert:
- The alert says: "A Quasimodo Pattern has appeared!"
Purpose
Traders can use this tool to quickly spot potential trend changes without manually analyzing every chart, saving time and improving decision-making for trades.
開源腳本
秉持TradingView一貫精神,這個腳本的創作者將其設為開源,以便交易者檢視並驗證其功能。向作者致敬!您可以免費使用此腳本,但請注意,重新發佈代碼需遵守我們的社群規範。
免責聲明
這些資訊和出版物並非旨在提供,也不構成TradingView提供或認可的任何形式的財務、投資、交易或其他類型的建議或推薦。請閱讀使用條款以了解更多資訊。
免責聲明
這些資訊和出版物並非旨在提供,也不構成TradingView提供或認可的任何形式的財務、投資、交易或其他類型的建議或推薦。請閱讀使用條款以了解更多資訊。