OPEN-SOURCE SCRIPT
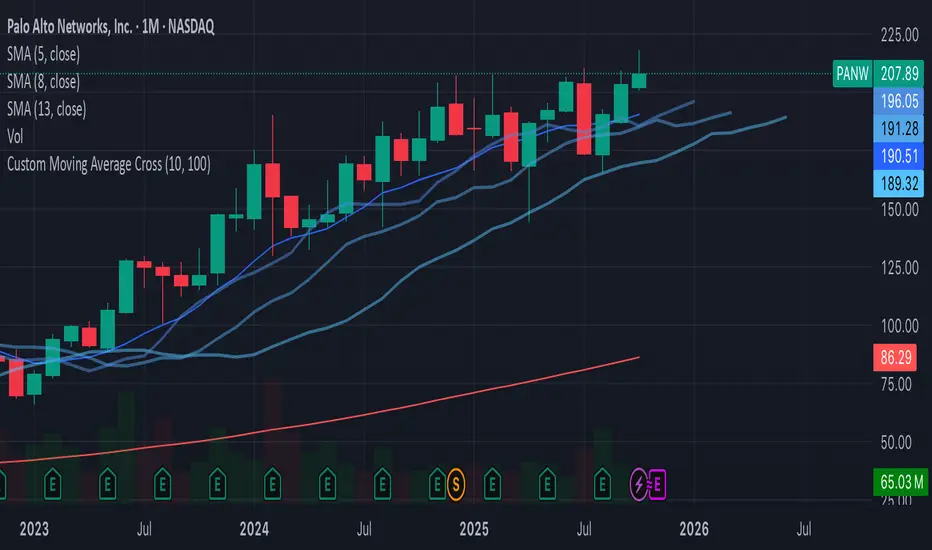
Custom Moving Average Cross - White
//version=5
indicator("Custom Moving Average Cross", overlay=true)
// User-defined parameters for moving averages
short_period = input.int(10, title="Short Period", minval=1)
long_period = input.int(100, title="Long Period", minval=1)
// Calculate the moving averages
short_ma = ta.sma(close, short_period)
long_ma = ta.sma(close, long_period)
// Plot the moving averages
plot(short_ma, color=color.blue, title="Short MA")
plot(long_ma, color=color.red, title="Long MA")
// Define the buy and sell conditions based on crossovers
buy_signal = ta.crossover(short_ma, long_ma)
sell_signal = ta.crossunder(short_ma, long_ma)
// Plot the buy and sell signals with labels (white text)
plotshape(buy_signal, location=location.belowbar, color=color.green, style=shape.labelup, title="Buy Signal", text="BUY", textcolor=color.white)
plotshape(sell_signal, location=location.abovebar, color=color.red, style=shape.labeldown, title="Sell Signal", text="SELL", textcolor=color.white)
// Optional: Background color to highlight the signals
bgcolor(buy_signal ? color.new(color.green, 90) : na, title="Buy Signal Background")
bgcolor(sell_signal ? color.new(color.red, 90) : na, title="Sell Signal Background")
開源腳本
本著TradingView的真正精神,此腳本的創建者將其開源,以便交易者可以查看和驗證其功能。向作者致敬!雖然您可以免費使用它,但請記住,重新發佈程式碼必須遵守我們的網站規則。
免責聲明
這些資訊和出版物並不意味著也不構成TradingView提供或認可的金融、投資、交易或其他類型的意見或建議。請在使用條款閱讀更多資訊。
開源腳本
本著TradingView的真正精神,此腳本的創建者將其開源,以便交易者可以查看和驗證其功能。向作者致敬!雖然您可以免費使用它,但請記住,重新發佈程式碼必須遵守我們的網站規則。
免責聲明
這些資訊和出版物並不意味著也不構成TradingView提供或認可的金融、投資、交易或其他類型的意見或建議。請在使用條款閱讀更多資訊。