PROTECTED SOURCE SCRIPT
已更新 The Bull Trader's Zones

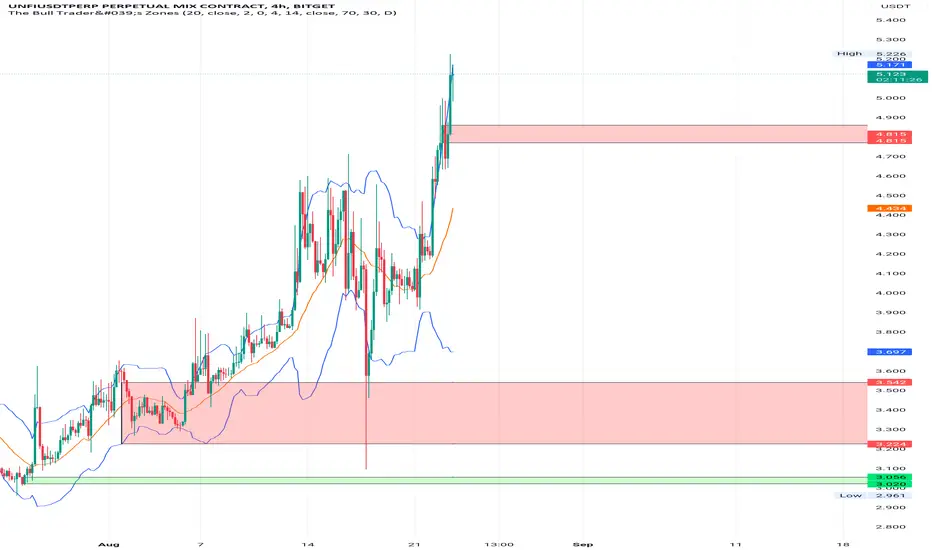
TBT Zones - Preferably used on the 4H chart. You should combine this script with other technical indicators as well.
In general the script helps find buy and sell opportunities early enough so as to make better decisions before taking a trade. Basically, it uses the rsi indicator, the long lower and long upper shadow candle sticks to create buy and sell zones.
The script is visibly engaging so one could easily know when the price is reverting into an Overbought or Sell zone after an uptrend, or reverting into an Oversold or Buy zone after an downtrend.
There is also the well known Bollinger Band Indicator, and it could be safer taking short trades when the price of the asset is above the Bollinger Basis, preferably close to the upper Bollinger Band. Vice-versa for long trades.
Adding the Camarilla L3 and H3 strategy could give an edge. Respecting the zones, if the open price is between H3 and L3;
BUY when the price moves back above L3 after going below L3. Target will be H1, H2, H3 levels. Stop loss can be placed at L4 level. Or trail an SL,
SELL when the price moves back below H3 after going above H3. Target will be L1,L2 L3 levels and stop loss above H4. Or trail an SL. Or simply take realistic profits.
By default the zones will extend left (back in history) which could give a view on how the zone previously performed. This option could be unchecked in the options. However, information on past performance is not necessarily a guide to future performance. Trade safe. Get out on time. Wait for another opportunity to set up.
When you add this indicator to your chart you can set up alerts to be informed when a new zone is formed.
Much thanks to cyatophilum, the pinescript coder who made this a reality.
發行說明
fixed typofixed the alert condition for price going into either a buy zone or a sell zone
發行說明
Updated the alert notification for Oversold Buy Zones and Overbought Sell Zones發行說明
Changed default length for Bollinger Bands to 21Changed default length for rsi to 7
Minor changes in the alerts
受保護腳本
此腳本以閉源形式發佈。 不過,您可以自由使用,沒有任何限制 — 點擊此處了解更多。
免責聲明
這些資訊和出版物並非旨在提供,也不構成TradingView提供或認可的任何形式的財務、投資、交易或其他類型的建議或推薦。請閱讀使用條款以了解更多資訊。
受保護腳本
此腳本以閉源形式發佈。 不過,您可以自由使用,沒有任何限制 — 點擊此處了解更多。
免責聲明
這些資訊和出版物並非旨在提供,也不構成TradingView提供或認可的任何形式的財務、投資、交易或其他類型的建議或推薦。請閱讀使用條款以了解更多資訊。