OPEN-SOURCE SCRIPT
True Range Moving Average Deviation
🔶 Overview
🔶 Key Components
🔶 Calculation
Pine Script®
🔶 Interpretation
🔶 Usage
🔹 Overbought and Oversold Conditions:

🔹 Divergence Analysis:

🔹 Trend Confirmation:

🔹 Risk Management:
🔶 Credits
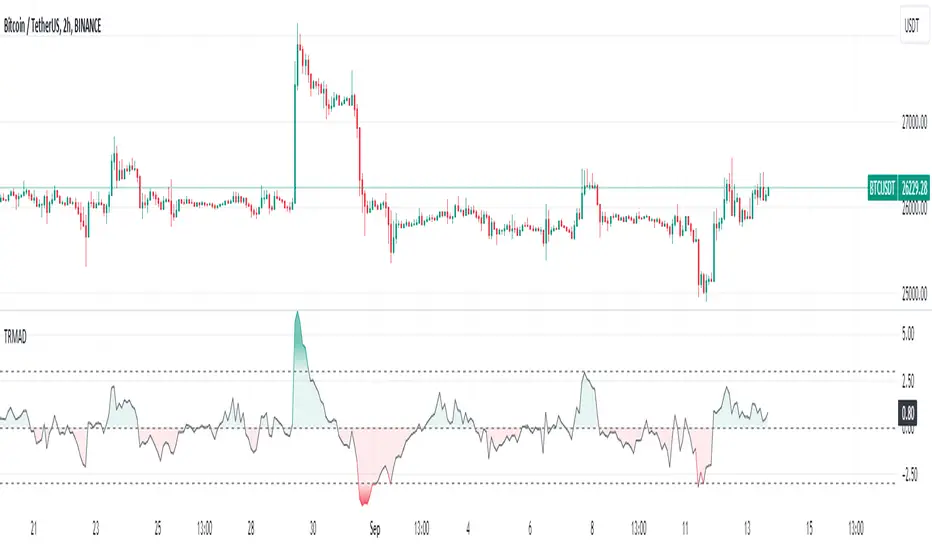
- The True Range Moving Average Deviation Indicator (TRMAD) is a technical analysis tool that combines elements of price deviation, volatility, and overbought/oversold conditions.
🔶 Key Components
- Current price (Close): most recent closing price of the asset.
- *Moving Average (MA): represents a smoothed trendline of the asset's closing prices over a specified period. By default, TRMAD uses the Simple Moving Average (SMA) with a 20-period setting.
- *Average True Range (ATR): reflects the average price range between the high and low over a given time frame. By default, TRMAD uses a 14-period ATR setting with a Simple Moving Average (SMA) calculation. ATR quantifies the historical price volatility of the asset, which is crucial for normalizing the price deviation.
🔶 Calculation
(Close - MA) / ATR
🔶 Interpretation
- When TRMAD is above +3 ATR, it is often considered an indication that the asset may be overbought, suggesting a potential reversal or correction to the downside.
- When TRMAD is below -3 ATR, it is often considered an indication that the asset may be oversold, suggesting a potential reversal or bounce to the upside.
- TRMAD values around 0 ATR may indicate a balanced market condition.
🔶 Usage
🔹 Overbought and Oversold Conditions:
- TRMAD can help identify overbought and oversold conditions. When TRMAD reaches or exceeds certain user-defined thresholds (e.g., +3 ATR or -3 ATR), it can signal that the asset is in an extreme condition.
- Traders can use these extreme conditions to adjust their positions or look for potential reversal opportunities.
🔹 Divergence Analysis:
- Traders often analyze divergences between the TRMAD indicator and price movements. For example, if the price is making higher highs while TRMAD is making lower highs (bearish divergence), it could indicate a potential trend reversal.
🔹 Trend Confirmation:
- TRMAD can be used in conjunction with other technical indicators to confirm trends. For example, if TRMAD is consistently positive during an uptrend, it can provide confirmation of the trend's strength.
- Positive TRMAD: When TRMAD is positive but hasn't reached the overbought threshold (e.g., +3 ATR), it suggests that there is some bullish momentum, but traders may exercise caution and look for other confirming signals before considering a long position.
- Negative TRMAD: When TRMAD is negative but hasn't reached the oversold threshold (e.g., -3 ATR), it suggests some bearish sentiment, but traders may want to seek additional confirmation before considering a short position.
🔹 Risk Management:
- Traders can use TRMAD as part of their risk management strategy. For instance, if TRMAD suggests that an asset is overbought, a trader might consider tightening their stop-loss orders to manage potential downside risk.
🔶 Credits
- The idea about this indicator came from Fabio Figueiredo (Vlad)
開源腳本
秉持TradingView一貫精神,這個腳本的創作者將其設為開源,以便交易者檢視並驗證其功能。向作者致敬!您可以免費使用此腳本,但請注意,重新發佈代碼需遵守我們的社群規範。
免責聲明
這些資訊和出版物並非旨在提供,也不構成TradingView提供或認可的任何形式的財務、投資、交易或其他類型的建議或推薦。請閱讀使用條款以了解更多資訊。
免責聲明
這些資訊和出版物並非旨在提供,也不構成TradingView提供或認可的任何形式的財務、投資、交易或其他類型的建議或推薦。請閱讀使用條款以了解更多資訊。