OPEN-SOURCE SCRIPT
已更新 GeoMean+
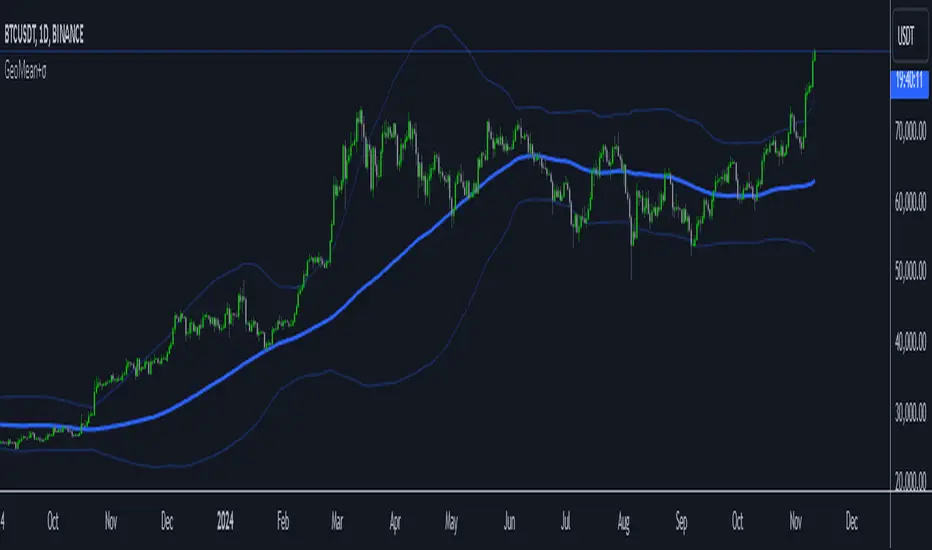
The Geometric Moving Average (GMA) with Sigma Bands is a technical indicator that combines trend following and volatility measurement. The blue center line represents the GMA, while the upper and lower bands (light blue) show price volatility using standard deviations (sigma). Traders can use this indicator for both trend following and mean reversion strategies. For trend following, enter long when price crosses above the GMA and short when it crosses below, using the bands as profit targets. For mean reversion, look for buying opportunities when price touches the lower band and selling opportunities at the upper band, with the GMA as your profit target. The indicator includes alerts for band touches and crosses, providing real-time notifications with symbol, timeframe, current price, and band level information. The default 100-period setting works well for daily charts, but can be adjusted shorter (20-50) for intraday trading or longer (200+) for position trading. Wider bands indicate higher volatility (use smaller positions), while narrower bands suggest lower volatility (larger positions possible). For best results, confirm signals with volume and avoid trading against strong trends. Stop losses can be placed beyond the touched band or at the GMA line, depending on your risk tolerance.
發行說明
- added filter to display extreme areas
發行說明
- updated alert message
開源腳本
秉持TradingView一貫精神,這個腳本的創作者將其設為開源,以便交易者檢視並驗證其功能。向作者致敬!您可以免費使用此腳本,但請注意,重新發佈代碼需遵守我們的社群規範。
免責聲明
這些資訊和出版物並非旨在提供,也不構成TradingView提供或認可的任何形式的財務、投資、交易或其他類型的建議或推薦。請閱讀使用條款以了解更多資訊。
開源腳本
秉持TradingView一貫精神,這個腳本的創作者將其設為開源,以便交易者檢視並驗證其功能。向作者致敬!您可以免費使用此腳本,但請注意,重新發佈代碼需遵守我們的社群規範。
免責聲明
這些資訊和出版物並非旨在提供,也不構成TradingView提供或認可的任何形式的財務、投資、交易或其他類型的建議或推薦。請閱讀使用條款以了解更多資訊。