INVITE-ONLY SCRIPT
Deep in the Tape – VSA (Invite Only)
Deep in the Tape – VSA (Invite-Only)
Quick Start
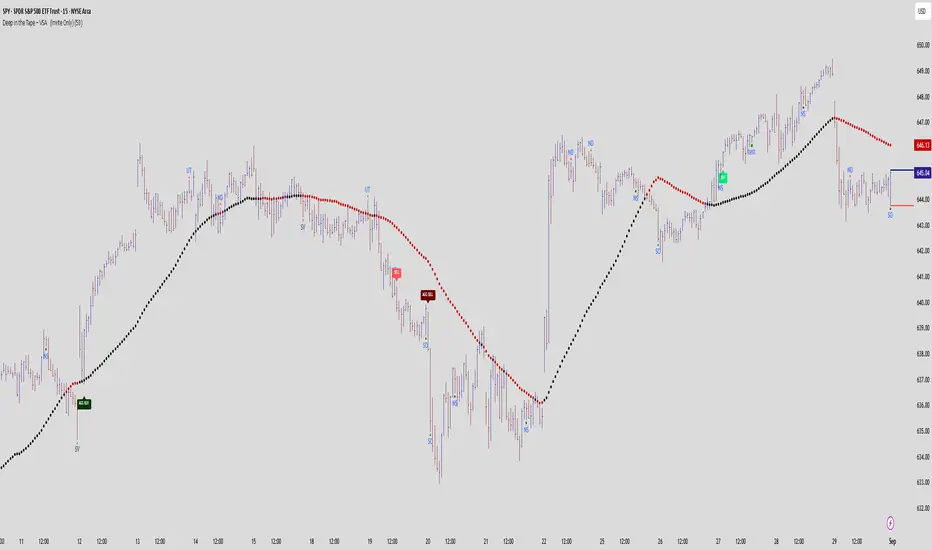
This invite-only indicator is built on Tom Williams’ Volume Spread Analysis (VSA). It highlights professional activity through classical VSA events and adds labels for confirmations, aggressive signals, and failures. The goal is to help traders study background strength/weakness, follow-through, and traps directly on the chart.
What It Shows
VSA Events: Stopping Volume, Selling Climax, Shakeout, Buying Climax, Upthrust, Supply Coming In, No Demand, No Supply, Confirmed Test Bars, End of Rising Market.
Labels:
BUY / SELL – show when classical confirmations appear (e.g., Test/NS after strength, ND after weakness).
AGG BUY / AGG SELL – highlight aggressive early entries when supply/demand is quickly absorbed or confirmed.
FAIL / TEST FAIL – show failed VSA setups where effort is not confirmed, helping traders recognize traps.
Context Tools:
High/low lines from ultra-high-volume trigger bars projected forward.
Optional high-volume cluster zones to mark potential accumulation/distribution.
Optional moving average for background context (not a signal generator).
How to Use It :
Read the Background
Look for ultra-high-volume events that mark professional activity: SC, SV, SO for strength; UT, BC, Supply Coming In for weakness.
Watch for the Response
After strength → look for Tests or No Supply to confirm demand, often labeled as BUY.
After weakness → watch for No Demand or UT follow-through, labeled as SELL.
Best Practice with Context
Bullish setups are best taken above the trigger levels and above the MA, showing demand in control.
Bearish setups are best taken below the trigger levels and below the MA, confirming supply pressure.
Study Failures and Aggressive Signals
Aggressive labels show when the market reacts quickly, confirming activity before a classical test.
Failure labels show when expected follow-through breaks down, revealing traps or absorption. These are highly educational in tape-reading.
Alerts: Ready-to-use alert conditions for all confirmations, aggressive signals, and failures, allowing real-time notifications.
Customization:
Users can toggle individual signals (e.g., Stopping Volume, No Demand, Tests, Aggressive Entries, Failure labels) on or off, tailoring the display to their preferred VSA study style.
Use Projected Levels & Clusters
Trigger levels and cluster zones provide natural S/R where professional money often reappears. Watching price response around these zones is key.
Why It’s Original
This script is not a mashup of indicators. Every condition is coded around VSA principles—spread, volume, wick proportions, close location, and context. Labels are mapped directly to Tom Williams’ methodology of background + test + confirmation. Clusters and projected levels extend the same VSA logic to make professional activity visible in real time.
Disclaimer
This script is for educational purposes only and does not constitute financial advice. Trading and investing involve risk. Always do your own analysis and risk management.
Quick Start
This invite-only indicator is built on Tom Williams’ Volume Spread Analysis (VSA). It highlights professional activity through classical VSA events and adds labels for confirmations, aggressive signals, and failures. The goal is to help traders study background strength/weakness, follow-through, and traps directly on the chart.
What It Shows
VSA Events: Stopping Volume, Selling Climax, Shakeout, Buying Climax, Upthrust, Supply Coming In, No Demand, No Supply, Confirmed Test Bars, End of Rising Market.
Labels:
BUY / SELL – show when classical confirmations appear (e.g., Test/NS after strength, ND after weakness).
AGG BUY / AGG SELL – highlight aggressive early entries when supply/demand is quickly absorbed or confirmed.
FAIL / TEST FAIL – show failed VSA setups where effort is not confirmed, helping traders recognize traps.
Context Tools:
High/low lines from ultra-high-volume trigger bars projected forward.
Optional high-volume cluster zones to mark potential accumulation/distribution.
Optional moving average for background context (not a signal generator).
How to Use It :
Read the Background
Look for ultra-high-volume events that mark professional activity: SC, SV, SO for strength; UT, BC, Supply Coming In for weakness.
Watch for the Response
After strength → look for Tests or No Supply to confirm demand, often labeled as BUY.
After weakness → watch for No Demand or UT follow-through, labeled as SELL.
Best Practice with Context
Bullish setups are best taken above the trigger levels and above the MA, showing demand in control.
Bearish setups are best taken below the trigger levels and below the MA, confirming supply pressure.
Study Failures and Aggressive Signals
Aggressive labels show when the market reacts quickly, confirming activity before a classical test.
Failure labels show when expected follow-through breaks down, revealing traps or absorption. These are highly educational in tape-reading.
Alerts: Ready-to-use alert conditions for all confirmations, aggressive signals, and failures, allowing real-time notifications.
Customization:
Users can toggle individual signals (e.g., Stopping Volume, No Demand, Tests, Aggressive Entries, Failure labels) on or off, tailoring the display to their preferred VSA study style.
Use Projected Levels & Clusters
Trigger levels and cluster zones provide natural S/R where professional money often reappears. Watching price response around these zones is key.
Why It’s Original
This script is not a mashup of indicators. Every condition is coded around VSA principles—spread, volume, wick proportions, close location, and context. Labels are mapped directly to Tom Williams’ methodology of background + test + confirmation. Clusters and projected levels extend the same VSA logic to make professional activity visible in real time.
Disclaimer
This script is for educational purposes only and does not constitute financial advice. Trading and investing involve risk. Always do your own analysis and risk management.
僅限邀請腳本
只有經作者批准的使用者才能訪問此腳本。您需要申請並獲得使用權限。該權限通常在付款後授予。如欲了解更多詳情,請依照以下作者的說明操作,或直接聯絡deep_in_the_tape_1。
除非您完全信任其作者並了解腳本的工作原理,否則TradingView不建議您付費或使用腳本。您也可以在我們的社群腳本中找到免費的開源替代方案。
作者的說明
This is an invite-only script. To request access, please visit https://deepinthetape.com or send me a private message on Trading View . Access is manually granted after request review. Please do not request access in the comments.
提醒:在請求訪問權限之前,請閱讀僅限邀請腳本指南。
免責聲明
這些資訊和出版物並不意味著也不構成TradingView提供或認可的金融、投資、交易或其他類型的意見或建議。請在使用條款閱讀更多資訊。