OPEN-SOURCE SCRIPT
已更新 Price Change History
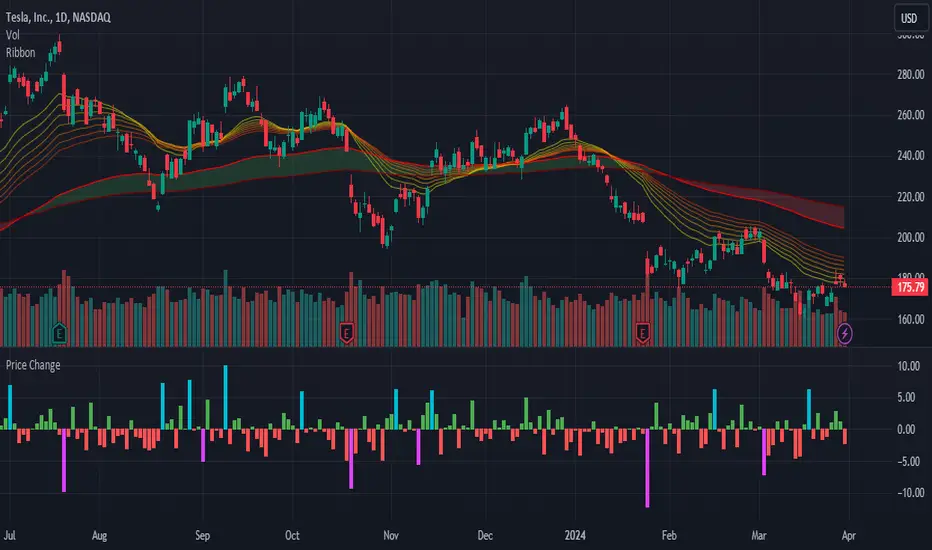
Display a histogram of price changes over a given interval. Show change as a percentage or in dollar amount. Highlight changes that exceed a particular value.
發行說明
By default, the histogram shows price change since the previous bar. This update allows you to display price change since any number of bars ago.發行說明
Separate high and low highlighting.發行說明
Update study shorttitle.發行說明
The ratio of highlighted to unhighlighted bars is now shown as the orange number ranging from 0 to 1.It takes into consideration the previous 50 bars by default, but can be changed by the user under settings.
發行說明
- Updated the names of a few settings to be clearer as to what they do.- Included some documentation in the source code to explain each setting.
發行說明
- Add default precision
- Improve comments
發行說明
Updated to Pine Script v4發行說明
- Update to Pine Script v5- Additional comments
- Code cleanup
開源腳本
秉持TradingView一貫精神,這個腳本的創作者將其設為開源,以便交易者檢視並驗證其功能。向作者致敬!您可以免費使用此腳本,但請注意,重新發佈代碼需遵守我們的社群規範。
免責聲明
這些資訊和出版物並非旨在提供,也不構成TradingView提供或認可的任何形式的財務、投資、交易或其他類型的建議或推薦。請閱讀使用條款以了解更多資訊。
免責聲明
這些資訊和出版物並非旨在提供,也不構成TradingView提供或認可的任何形式的財務、投資、交易或其他類型的建議或推薦。請閱讀使用條款以了解更多資訊。