OPEN-SOURCE SCRIPT
Ranked Parabolic Curve Detector (Adaptive + Reversion Aware)
The Parabolic Curve Detector is a smart, adaptable trading signal engine designed to help you spot true momentum — not the flashy head-fakes, but sustained, accelerating moves that have the potential to go parabolic. Whether you’re new to trading or looking to sharpen your edge, this tool combines a suite of time-tested and modern techniques into one unified signal, all while adjusting to changing market conditions.
The core idea is simple: detect when price is not just rising, but accelerating, like a curve bending upward. To do that, the script analyzes the log of price and calculates both:
Slope1: how fast the price is moving (momentum)
Slope2: how fast that momentum is changing (acceleration)
Over a user-defined number of bars (which amounts to sensitivity), the script checks for consistency. So, for example, if both slope1 and slope2 have been positive for 4 bars, that’s a strong signal.
But it doesn’t stop there.
The key is weighted Intelligence
What makes this tool uniquely customizable is that each layer of signal logic is weighted:
Slope1 and Slope2: You can assign how much these matter (e.g., 60% for slope1, 20% for slope2)
Ichimoku Trend Filter: A bullish setup (Tenkan > Kijun) can contribute to the total score
RSI Context: The indicator checks for overextension (RSI > 70 and falling) and mean-reversion potential (RSI < 45 and rising), adjusting scores accordingly
You can fine-tune these weights to match your trading style — whether you prefer to catch early momentum, ride mature trends, or fade reversals.
Finally, there is adaptive Intelligence. This isn’t a static signal. The indicator auto-adjusts its strictness using:
Slope Flip Rate: If price changes direction frequently, the required bar count increases
Volatility (ATR): In volatile markets, the threshold for signal confirmation tightens to avoid noise
You can turn this adaptive behavior on or off. When enabled, it makes the script self-tuning across timeframes — more reactive on clean moves, more skeptical in chop.
How to Use It
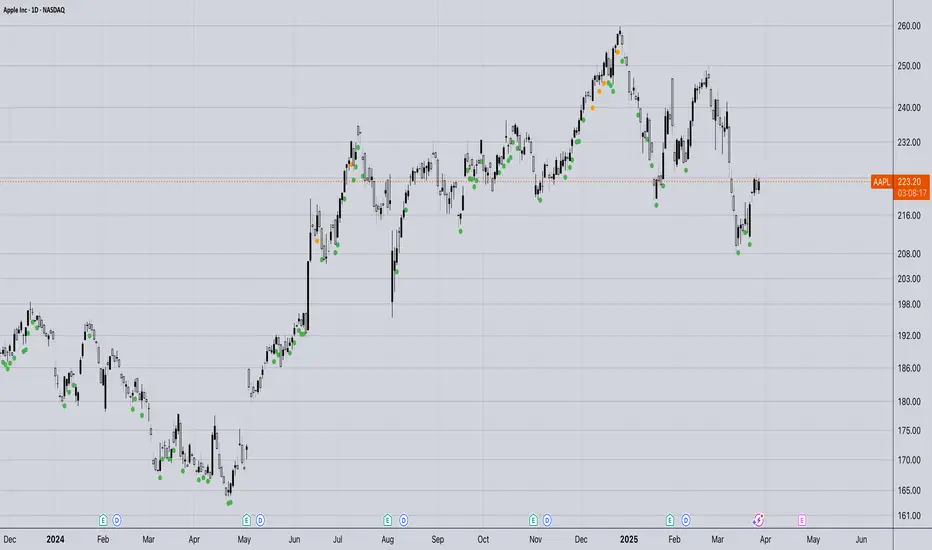
Start on a log-scaled daily chart
Enable the indicator and optionally turn on Adaptive Sensitivity
Look for:
Green Circles = bullish signal with favorable RSI + trend
Orange Circles = still bullish, but possibly overextended
For bearish setups, enable Parabolic Drops in settings
I am still experimenting with it, so if you find a better way to use it, let us know!
My suggested tweaks:
sensitivity: 3–5 for normal, higher for stricter
signalThreshold: 0.7–0.85 depending on how picky you want to be
Weights for slope1/slope2/trend
RSI boost/penalty levels
The core idea is simple: detect when price is not just rising, but accelerating, like a curve bending upward. To do that, the script analyzes the log of price and calculates both:
Slope1: how fast the price is moving (momentum)
Slope2: how fast that momentum is changing (acceleration)
Over a user-defined number of bars (which amounts to sensitivity), the script checks for consistency. So, for example, if both slope1 and slope2 have been positive for 4 bars, that’s a strong signal.
But it doesn’t stop there.
The key is weighted Intelligence
What makes this tool uniquely customizable is that each layer of signal logic is weighted:
Slope1 and Slope2: You can assign how much these matter (e.g., 60% for slope1, 20% for slope2)
Ichimoku Trend Filter: A bullish setup (Tenkan > Kijun) can contribute to the total score
RSI Context: The indicator checks for overextension (RSI > 70 and falling) and mean-reversion potential (RSI < 45 and rising), adjusting scores accordingly
You can fine-tune these weights to match your trading style — whether you prefer to catch early momentum, ride mature trends, or fade reversals.
Finally, there is adaptive Intelligence. This isn’t a static signal. The indicator auto-adjusts its strictness using:
Slope Flip Rate: If price changes direction frequently, the required bar count increases
Volatility (ATR): In volatile markets, the threshold for signal confirmation tightens to avoid noise
You can turn this adaptive behavior on or off. When enabled, it makes the script self-tuning across timeframes — more reactive on clean moves, more skeptical in chop.
How to Use It
Start on a log-scaled daily chart
Enable the indicator and optionally turn on Adaptive Sensitivity
Look for:
Green Circles = bullish signal with favorable RSI + trend
Orange Circles = still bullish, but possibly overextended
For bearish setups, enable Parabolic Drops in settings
I am still experimenting with it, so if you find a better way to use it, let us know!
My suggested tweaks:
sensitivity: 3–5 for normal, higher for stricter
signalThreshold: 0.7–0.85 depending on how picky you want to be
Weights for slope1/slope2/trend
RSI boost/penalty levels
開源腳本
秉持TradingView一貫精神,這個腳本的創作者將其設為開源,以便交易者檢視並驗證其功能。向作者致敬!您可以免費使用此腳本,但請注意,重新發佈代碼需遵守我們的社群規範。
免責聲明
這些資訊和出版物並非旨在提供,也不構成TradingView提供或認可的任何形式的財務、投資、交易或其他類型的建議或推薦。請閱讀使用條款以了解更多資訊。
開源腳本
秉持TradingView一貫精神,這個腳本的創作者將其設為開源,以便交易者檢視並驗證其功能。向作者致敬!您可以免費使用此腳本,但請注意,重新發佈代碼需遵守我們的社群規範。
免責聲明
這些資訊和出版物並非旨在提供,也不構成TradingView提供或認可的任何形式的財務、投資、交易或其他類型的建議或推薦。請閱讀使用條款以了解更多資訊。