OPEN-SOURCE SCRIPT
已更新 Market Snapshot
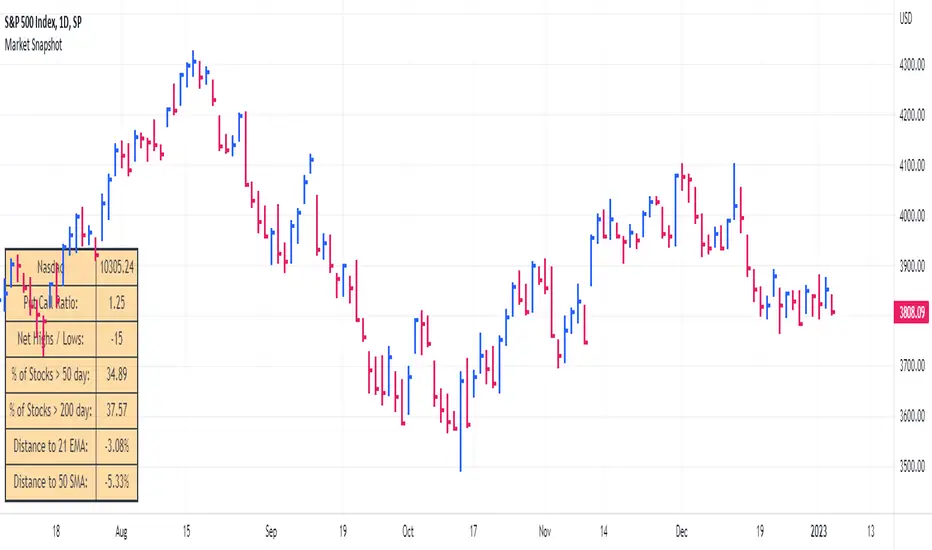
Get a snapshot of the market with the index's last price, distance to selectable moving averages, and breadth data.
Choose to see data based on the Nasdaq or SPX, as well as net highs / lows for the Nasdaq, NYSE or combined.
Snapshot shows:
- Index's (SPX or Nasdaq's) last price
- Put call ratio
- % of stocks above the 50 day moving average for the index of your choice
- % of stocks above the 200 day moving average for the index of your choice
- Distance to or from two selectable moving averages. (negative number means price is below the moving average, positive means price is above)
Configurable options:
- Which moving averages to use
- Where to display the table on your chart
- Table size, background and text colors
發行說明
fixed table sizing 發行說明
bug fix開源腳本
秉持TradingView一貫精神,這個腳本的創作者將其設為開源,以便交易者檢視並驗證其功能。向作者致敬!您可以免費使用此腳本,但請注意,重新發佈代碼需遵守我們的社群規範。
Trusted Pine programmer. Send me a message for script development.
免責聲明
這些資訊和出版物並非旨在提供,也不構成TradingView提供或認可的任何形式的財務、投資、交易或其他類型的建議或推薦。請閱讀使用條款以了解更多資訊。
開源腳本
秉持TradingView一貫精神,這個腳本的創作者將其設為開源,以便交易者檢視並驗證其功能。向作者致敬!您可以免費使用此腳本,但請注意,重新發佈代碼需遵守我們的社群規範。
Trusted Pine programmer. Send me a message for script development.
免責聲明
這些資訊和出版物並非旨在提供,也不構成TradingView提供或認可的任何形式的財務、投資、交易或其他類型的建議或推薦。請閱讀使用條款以了解更多資訊。