OPEN-SOURCE SCRIPT
Z-Score
The "Z-Score" indicator is a unique and powerful tool designed to help traders identify overbought and oversold conditions in the market. Below is an explanation of its features, usefulness, and what makes it special:
Features:
Z-Score Calculation: The indicator calculates the Z-Score, a statistical measure that represents how far the current price is from the moving average (MA) in terms of standard deviations. It helps identify extreme price movements.
Customizable Parameters: Traders can adjust key parameters such as the Z-Score threshold, the type of MA (e.g., SMA, EMA), and the length of the moving average to suit their trading preferences.
Signal Options: The indicator offers flexibility in terms of signaling. Traders can choose whether to trigger signals when the Z-Score crosses the specified threshold or when it moves away from the threshold.
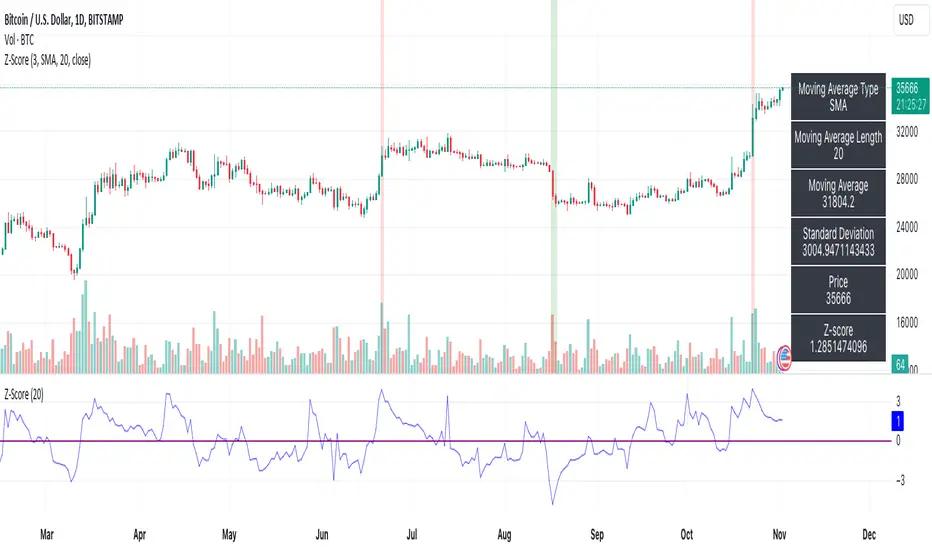
Visual Signals: Z-Score conditions are represented visually on the chart with color-coded background highlights. Overbought conditions are marked with a red background, while oversold conditions are indicated with a green background.
Information Table: A dynamic information table displays essential details, including the MA type, MA length, MA value, standard deviation, current price, and Z-Score. This information table helps traders make informed decisions.
Usefulness:
Overbought and Oversold Signals: Z-Score is particularly valuable for identifying overbought and oversold market conditions. Traders can use this information to potentially enter or exit positions.
Statistical Analysis: The Z-Score provides a statistical measure of price deviation, offering a data-driven approach to market analysis.
Customization: Traders can customize the indicator to match their trading strategies and preferences, enhancing its adaptability to different trading styles.
Visual Clarity: The visual signals make it easy for traders to quickly spot potential trade opportunities on the price chart.
In summary, the Z-Score indicator is a valuable tool for traders looking to incorporate statistical analysis into their trading strategies. Its customizability, visual signals, and unique statistical approach make it an exceptional choice for identifying overbought and oversold market conditions and potential trading opportunities.
Features:
Z-Score Calculation: The indicator calculates the Z-Score, a statistical measure that represents how far the current price is from the moving average (MA) in terms of standard deviations. It helps identify extreme price movements.
Customizable Parameters: Traders can adjust key parameters such as the Z-Score threshold, the type of MA (e.g., SMA, EMA), and the length of the moving average to suit their trading preferences.
Signal Options: The indicator offers flexibility in terms of signaling. Traders can choose whether to trigger signals when the Z-Score crosses the specified threshold or when it moves away from the threshold.
Visual Signals: Z-Score conditions are represented visually on the chart with color-coded background highlights. Overbought conditions are marked with a red background, while oversold conditions are indicated with a green background.
Information Table: A dynamic information table displays essential details, including the MA type, MA length, MA value, standard deviation, current price, and Z-Score. This information table helps traders make informed decisions.
Usefulness:
Overbought and Oversold Signals: Z-Score is particularly valuable for identifying overbought and oversold market conditions. Traders can use this information to potentially enter or exit positions.
Statistical Analysis: The Z-Score provides a statistical measure of price deviation, offering a data-driven approach to market analysis.
Customization: Traders can customize the indicator to match their trading strategies and preferences, enhancing its adaptability to different trading styles.
Visual Clarity: The visual signals make it easy for traders to quickly spot potential trade opportunities on the price chart.
In summary, the Z-Score indicator is a valuable tool for traders looking to incorporate statistical analysis into their trading strategies. Its customizability, visual signals, and unique statistical approach make it an exceptional choice for identifying overbought and oversold market conditions and potential trading opportunities.
開源腳本
秉持TradingView一貫精神,這個腳本的創作者將其設為開源,以便交易者檢視並驗證其功能。向作者致敬!您可以免費使用此腳本,但請注意,重新發佈代碼需遵守我們的社群規範。
免責聲明
這些資訊和出版物並非旨在提供,也不構成TradingView提供或認可的任何形式的財務、投資、交易或其他類型的建議或推薦。請閱讀使用條款以了解更多資訊。
免責聲明
這些資訊和出版物並非旨在提供,也不構成TradingView提供或認可的任何形式的財務、投資、交易或其他類型的建議或推薦。請閱讀使用條款以了解更多資訊。