INVITE-ONLY SCRIPT
Asset Correlation with XAU/USD (Macroeconomics X Gold)

This Pine Script calculates the correlation of economic assets with gold (XAU/USD), including indicators such as the DXY, the S&P 500, the US 10-year yield (US10Y), oil (USOIL), the USD/JPY pair, and the AUD/USD pair. The goal is to analyze the impact of these variables on the price of gold, particularly in a macroeconomic context.
Main Features:
Asset Monitoring: The script monitors 24-hour variations of six key assets (DXY, S&P 500, US10Y, USOIL, USDJPY, AUDUSD), along with the price of XAU/USD.
Percentage Change Calculation: The percentage change for each asset is calculated based on the previous day's close, compared to the most recent 5-minute close.
Direction Determination: The direction of each asset (whether the change is positive, negative, or neutral) is calculated and used to determine the potential impact on the price of gold.
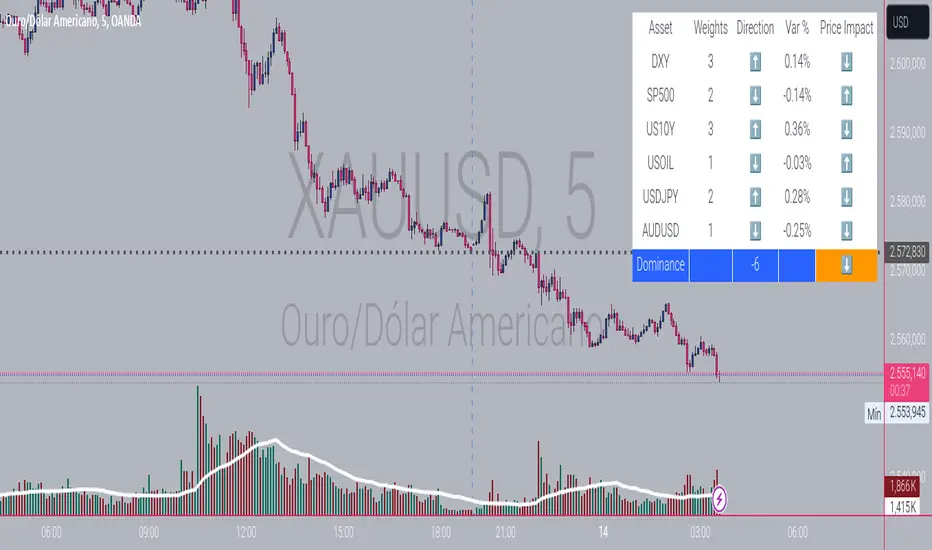
Interactive Tables: The results of directions, variations, and impacts are displayed in a table on the screen, with each asset being evaluated by its weight (influence on gold) and direction. The table also includes arrows indicating the impact of each asset on the price of gold, based on the correlation between them.
Dominance: The overall dominance of gold is calculated based on the weights and directions of the assets, generating a result that reflects whether gold is trending upwards or downwards due to the other observed assets. An arrow symbol indicates whether the dominance is positive (⬆️), negative (⬇️), or neutral (—).
Table Details:
The table displays the monitored assets, their assigned weights, the direction (arrows up, down, or neutral), the percentage change of each asset, and the impact of these assets on the price of gold.
The last column shows the "dominance" overall, with the final impact of these assets on the direction of the XAU/USD price.
Usage: This script is useful for traders and analysts who want to monitor how different macroeconomic factors (such as the value of the dollar, the S&P 500, US interest rates, oil prices, and currency pairs) influence the price of gold. It provides a clear view of how these assets correlate with gold, helping to make more informed decisions in the market.
For a better view of the table, right-click on >> visual order >> bring it to the top.
As a developer, my goal is to contribute to the community by creating solutions that promote collective growth. I believe in collaboration and knowledge sharing for continuous learning and innovation.
免責聲明
這些資訊和出版物並不意味著也不構成TradingView提供或認可的金融、投資、交易或其他類型的意見或建議。請在使用條款閱讀更多資訊。