OPEN-SOURCE SCRIPT
已更新 MARS - Moving Average Relative Strength
The original idea from this script is from the script "Percentage Relative Strength" by dman103. The original script compared a symbol to an index by their everyday percentage change. The symbol percentage was subtracted from percentage change of the index, & the results were then smoothed by moving averages.
Instead of daily percentage changes, this script directly calculates relative strength via a moving average. We call this simpler approach as MARS (Moving Average Relative Strength).
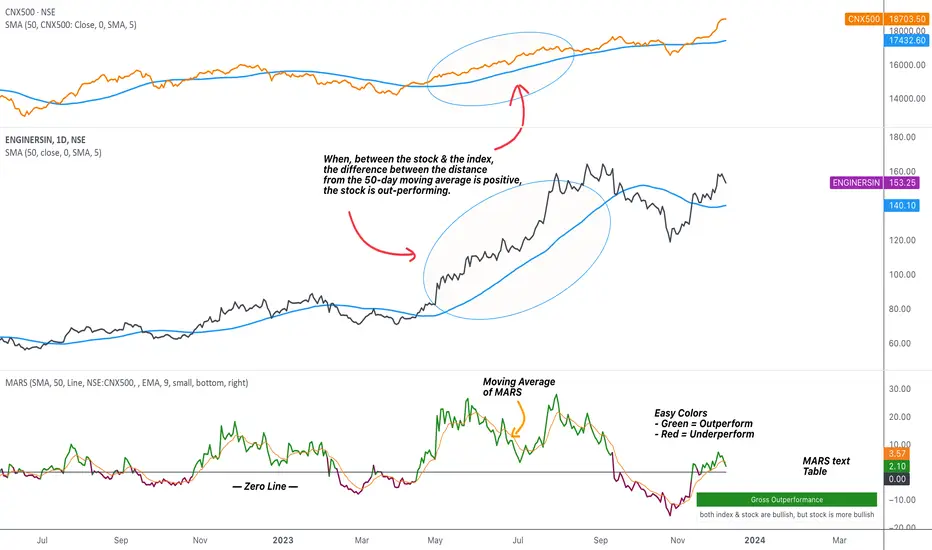
MARS compares a symbol to the index by making use of the price's distance from a moving average. By default, we compare the distance from the 50-day simple moving average of the stock vs that of the index. Both the type & the length of the moving average is customisable.
Background color indicates the index being above or below its moving average.
The histogram indicates whether the stock is under-performing or out-performing the index.
The color of the histogram indicates the type of out-performance or under-performance. There can be a total of 6 such colors:
Additional customisation options:
Instead of daily percentage changes, this script directly calculates relative strength via a moving average. We call this simpler approach as MARS (Moving Average Relative Strength).
MARS compares a symbol to the index by making use of the price's distance from a moving average. By default, we compare the distance from the 50-day simple moving average of the stock vs that of the index. Both the type & the length of the moving average is customisable.
Background color indicates the index being above or below its moving average.
- Blue background: index is above its moving average
- Pink background: index is below its moving average
The histogram indicates whether the stock is under-performing or out-performing the index.
- Up-bars: stock is out-performing the index i.e. between the stock & the index, the difference between the distance to/from the 50-day moving average is a positive value.
- Down-bars: stock is under-performing the index i.e. between the stock & the index, the difference between the distance to/from the 50-day moving average is a negative value.
The color of the histogram indicates the type of out-performance or under-performance. There can be a total of 6 such colors:
- Relative out-performance: both index & stock are bearish, but stock is less bearish. The script prints light green up-bars on a pink background.
- Gross out-performance: both index & stock are bullish, but stock is more bullish. The script prints green up-bars on a blue background.
- Absolute out-performance: index is bearish, but stock is bullish! The script prints blue up-bars on a pink background.
- Relative under-performance: both index & stock are bullish, but stock is less bullish. The script prints light red bars on a blue background.
- Gross under-performance: both index & stock are bearish, but stock is more bearish. The script prints dark red bars on a pink background.
- Absolute under-performance: index is bullish, but stock is bearish! The script prints black down-bars on a blue background.
Additional customisation options:
- Paint bars option changes the bar colors to mirror the histogram colors.
- Easy colors option just changes the histogram colors to either blue or pink, indicating out-performance or under-performance, respectively. This is when the trader does not wish to demarcate between the above-mentioned 6 conditions.
發行說明
Minor bug fixes in the code.發行說明
Added an option to change the colour of the Zero line.發行說明
⦿ Default plot display is now a line style, instead of the previous histogram style. This is still user-customisable.⦿ Moving average for smoothing of MARS is now incorporated. By default, it uses a 9 EMA of MARS. If the MARS stays above its moving average, it indicates that MARS is going up, & is a bullish sign.
⦿ Text description of the current relative strength state is visible as a table. It is a verbose table by default (with details of the current MARS state). You can turn off the detailed text or even turn off the entire table altogether.
⦿ Easy color mode is modified & turned on by default. Easy colors are now really 'easy', as the strong & weak colors are now represented by green & red, respectively.
發行說明
Updated to include more options in the 'Index to compare to' dropdown. Default now is NIFTYMIDSML400.開源腳本
秉持TradingView一貫精神,這個腳本的創作者將其設為開源,以便交易者檢視並驗證其功能。向作者致敬!您可以免費使用此腳本,但請注意,重新發佈代碼需遵守我們的社群規範。
免責聲明
這些資訊和出版物並非旨在提供,也不構成TradingView提供或認可的任何形式的財務、投資、交易或其他類型的建議或推薦。請閱讀使用條款以了解更多資訊。
開源腳本
秉持TradingView一貫精神,這個腳本的創作者將其設為開源,以便交易者檢視並驗證其功能。向作者致敬!您可以免費使用此腳本,但請注意,重新發佈代碼需遵守我們的社群規範。
免責聲明
這些資訊和出版物並非旨在提供,也不構成TradingView提供或認可的任何形式的財務、投資、交易或其他類型的建議或推薦。請閱讀使用條款以了解更多資訊。