OPEN-SOURCE SCRIPT
MACD M4CD
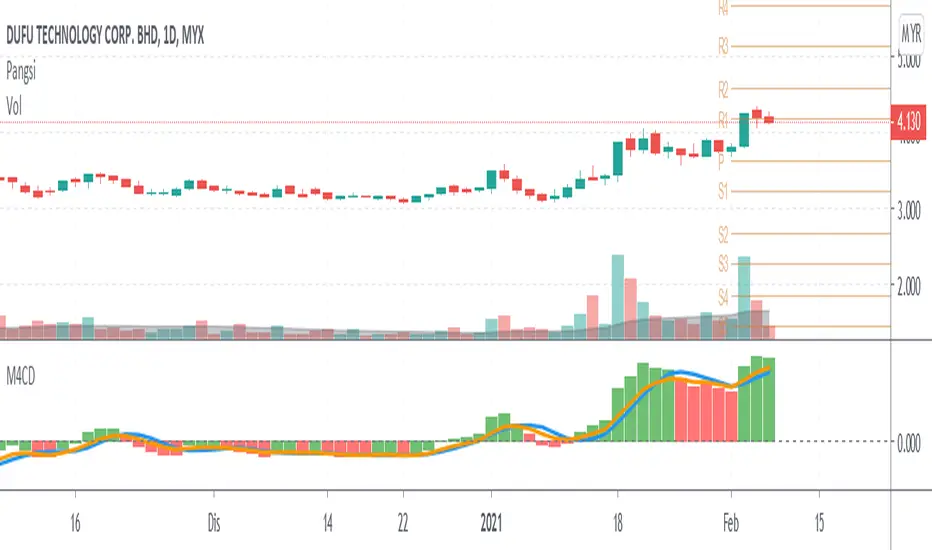
This script show:
1. Signal line base on sma blue color
2. Signal line base on ema orange color
3. Green bar mean current bar is high than signal line
4. Red bar mean current bar is low than signal line
if bar upper zero line, it show uptrend
if bar below zero line, it show downtrend
If orange line cross up blue line, it show signal buy.
If blue line cross down orange line, it show signal sell.
Combined it with other indicator you preferred such as support and resistant to avoid more noise.
The default setting is 5,20,5. (for short to midterm strategy)
my idea:
5 for five days in a week.
20 for twenty day in a month.
Thats all, hope benefit tou you all.
Thank you.
開源腳本
秉持TradingView一貫精神,這個腳本的創作者將其設為開源,以便交易者檢視並驗證其功能。向作者致敬!您可以免費使用此腳本,但請注意,重新發佈代碼需遵守我們的社群規範。
免責聲明
這些資訊和出版物並非旨在提供,也不構成TradingView提供或認可的任何形式的財務、投資、交易或其他類型的建議或推薦。請閱讀使用條款以了解更多資訊。
免責聲明
這些資訊和出版物並非旨在提供,也不構成TradingView提供或認可的任何形式的財務、投資、交易或其他類型的建議或推薦。請閱讀使用條款以了解更多資訊。