INVITE-ONLY SCRIPT
TRUE Vibration 2.0
已更新
True Vibration was designed as a Comprehensive Trading Tool for active traders.
All Markets and all assets constantly chop on all time frames. No asset is exempt from this.
Our goal in trading is (should be) to utilize Technical Analysis in order to identify what the masses are likely thinking and to identify when and where they are likely wrong (or trapped). Generally speaking, the masses tend to do well during trends and they tend to perform terribly at inflection points. I designed this tool in an effort to help Traders better identify these areas in both TRENDING and RANGING markets.
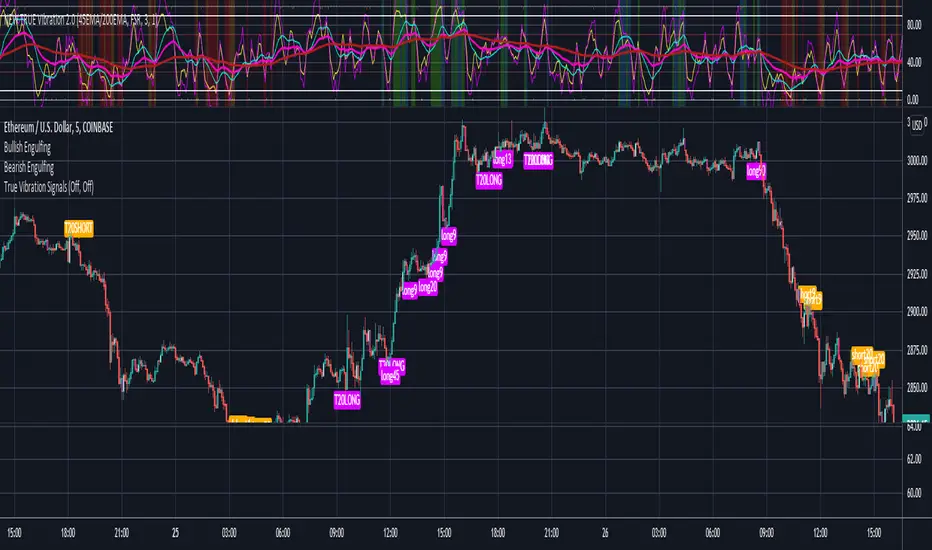
There is a lot happening in this oscillator (by design). The key outputs provided through the oscillator include:
-Identification of Market Structure (Rule #1 of trading & yet it is also the first thing most traders forget)
-Potential Pivots for Longs and Shorts
-A simple Trend identification feature
-A bursting feature for areas showing confluence which often leads to bigger moves
-Multiple variations of unique momentum indicators
-Divergence on the momentum indicator
and much more...
"A tool is only as good as its user". What many will find is that the more time they invest in learning the intricacies of this tool the better they will become at using it and receiving benefits from it. Intro and instruction video(s) will be made available to give users a head start on the learning curve with this tool.
All Markets and all assets constantly chop on all time frames. No asset is exempt from this.
Our goal in trading is (should be) to utilize Technical Analysis in order to identify what the masses are likely thinking and to identify when and where they are likely wrong (or trapped). Generally speaking, the masses tend to do well during trends and they tend to perform terribly at inflection points. I designed this tool in an effort to help Traders better identify these areas in both TRENDING and RANGING markets.
There is a lot happening in this oscillator (by design). The key outputs provided through the oscillator include:
-Identification of Market Structure (Rule #1 of trading & yet it is also the first thing most traders forget)
-Potential Pivots for Longs and Shorts
-A simple Trend identification feature
-A bursting feature for areas showing confluence which often leads to bigger moves
-Multiple variations of unique momentum indicators
-Divergence on the momentum indicator
and much more...
"A tool is only as good as its user". What many will find is that the more time they invest in learning the intricacies of this tool the better they will become at using it and receiving benefits from it. Intro and instruction video(s) will be made available to give users a head start on the learning curve with this tool.
發行說明
True Vibration was designed as a Comprehensive Trading Tool for active traders.All Markets and all assets constantly chop on all time frames. No asset is exempt from this.
Our goal in trading is (should be) to utilize Technical Analysis in order to identify what the masses are likely thinking and to identify when and where they are likely wrong (or trapped). Generally speaking, the masses tend to do well during trends and they tend to perform terribly at inflection points. I designed this tool in an effort to help Traders better identify these areas in both TRENDING and RANGING markets.
There is a lot happening in this oscillator (by design). The key outputs provided through the oscillator include:
-Identification of Market Structure (Rule #1 of trading & yet it is also the first thing most traders forget)
-Potential Pivots for Longs and Shorts
-A simple Trend identification feature
-A bursting feature for areas showing confluence which often leads to bigger moves
-Multiple variations of unique momentum indicators
-Divergence on the momentum indicator
and much more...
"A tool is only as good as its user". What many will find is that the more time they invest in learning the intricacies of this tool the better they will become at using it and receiving benefits from it. Intro and instruction video(s) will be made available to give users a head start on the learning curve with this tool.
發行說明
The MAIN addition to True Vibration 2.0 is an additional tool that can be turned ON within the settings. The tools is called the Directional Bias Indicator (DBI) and this tool is very helpful in showing the path of least resistance for a given time frame. While the user is always the most important part in any trade, the DBI has the ability to strengthen the EDGE of any preferred technique which also includes all the EDGE-based techniques/signals that already exist within True Vibration 2.0.Enjoy!
發行說明
True Vibration has been updated with multiple strategies that have tremendous EDGE to them and make the user experience easier to use and learn.發行說明
Alert Bug correction發行說明
Small changes on this update. We went from version 4 to version 5. We did a little clean up. We changed the 70/30 lines to 80/20 be default (but, you cand change those if you'd like. We have a dashed 50 line on by default currently(this can be changed as well). Enjoy!僅限邀請腳本
僅限作者授權的用戶訪問此腳本,並且通常需要付費。您可以將其增加到收藏腳本中,但是只有在向作者請求並獲得許可之後,才能使用它。 請聯繫TrueCrypto28以了解更多信息,或按照下面作者的說明進行操作。
TradingView 不建議購買並使用此腳本,除非您 100% 信任其作者並了解腳本的工作原理。在許多情況下,您可以在我們的社群腳本中免費找到良好的開源替代方案。
作者的說明
″DM me @TrueCrypto28 for no-cost access.
想在圖表上使用此腳本?
警告:請閱讀,然後再請求訪問權限。
免責聲明
這些資訊和出版物並不意味著也不構成TradingView提供或認可的金融、投資、交易或其他類型的意見或建議。請在使用條款閱讀更多資訊。